
Box sets » Fiscal sustainability

To investigate the effect of an ageing population on asset demand and rates of return in the context of the wider pension system, we have used the UK Overlapping Generations model (UK OLG). This box explained why the UK OLG is uniquely useful for this kind of life cycle analysis, presented an outline of the model's structure, and gave an overview of the data sources we used to calibrate the model.

Unfunded pension liabilities represent the second-largest government liability after gilts, but are not included in the PSNFL measure of debt. In this box, we analysed the treatment of unfunded pensions in the National Accounts and the fiscal risks they create.

Public sector net debt (ex BoE) has risen substantially over the past 25 years, despite repeated government plans to get it falling. In this box, we examined the key drivers behind this upward trend, including the impact of major economic shocks, the persistent gap between forecasted and actual debt outcomes, and the increasing difficulty of stabilising debt due to structural fiscal pressures.

The 2025 Spending Review increased the envelope for departmental financial transactions relative to the assumptions in our March 2025 forecast. In this box, we explored how this funding has been allocated and how this may impact future OBR work.
The expected level of write-offs associated with different parts of the Government's loan book affects how they are recorded by the ONS in the public finances. In this box we reviewed the effect which the valuation methodology used by the ONS for different elements of the loan book has on PSNFL.
There is a large degree of uncertainty around the estimates of the fiscal costs from climate damage. In this box we considered the main sources of the risks and uncertainties to climate damage costs, which are skewed to the downside.

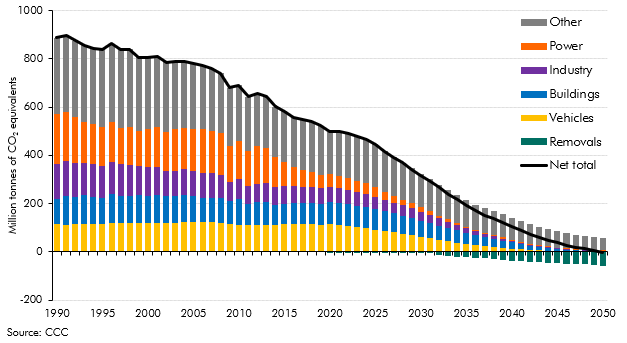
In June, the Government published the conclusions of the 2025 Spending Review, including allocations to net zero spending over the five years from 2025-26 to 2029-30. In this box we reviewed how the Government's Spending Review plans compare to the CCC's central scenario above for the public investment costs needed to achieve net zero emissions by 2050.
There is considerable uncertainty around the economic and fiscal costs associated with climate change mitigation. In this box we explored wider upside and downside risks around the CCC's central estimates of the whole-economy costs of the net zero transition and the impact the transition could have on the productive potential of the UK economy.

The UK’s fiscal position is increasingly vulnerable, by both historical and international standards. In this box, we considered the drivers of fiscal vulnerability, such as persistent large deficits, slower growth and higher interest rates, and the extent to which these may limit the Government's scope to respond to future economic shocks.
Throughout a forecast process the OBR, in conjunction with other government departments, uses a number of approaches to understand uncertainty in our fiscal forecasts. This box set out these approaches in detail and looked at those taken when incorporating the fiscal impacts of new policy announcements.

Our March 2023 fiscal forecast had a difference across other current spending of £14.9 billion, accounting for around 40 per cent of the £39.8 billion overall difference between the March 2023 spending forecast and outturn. This box explored explanations and set out which forecast methodologies we would review as priorities.
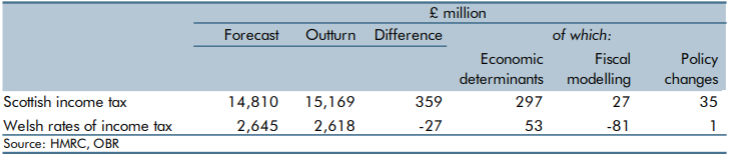
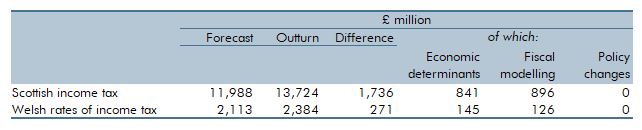
Income tax was devolved to the Scottish Parliament in 2016 and the Welsh Senedd in 2019. In this box we evaluated our March 2022 forecasts for 2022-23, and how they compared to the eventual outturn data. We explained the drivers behind the differences between our inital forcasts and final outturn behind the 2.4 per cent surplus for Scotland and 1.0 per cent shortfall in Wales. This was a particularly difficult period to forecast given the economy was recovering from the unprecedented impact of the Covid-19 pandemic.
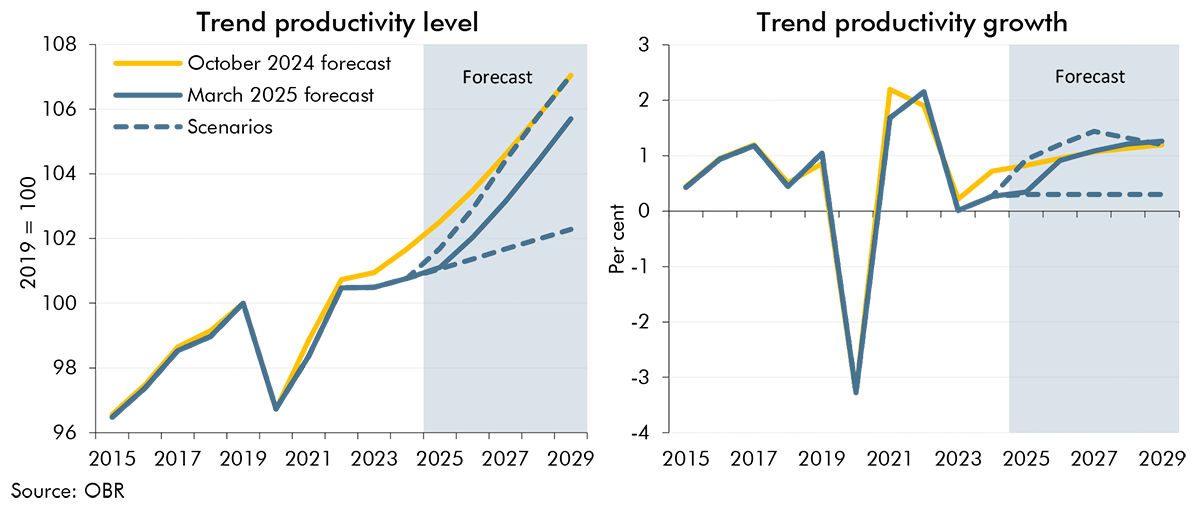
The outlook for trend productivity is one of the most important and uncertain forecast judgements. Successive past forecasts for trend productivity have proven to be too optimistic as productivity growth has continued to disappoint. In this box we explored two alternative scenarios for trend productivity: One where the recent weakness in trend productivity growth persists throughout the forecast period and one where it proves to be entirely cyclical and is offset by higher growth in the near-term.
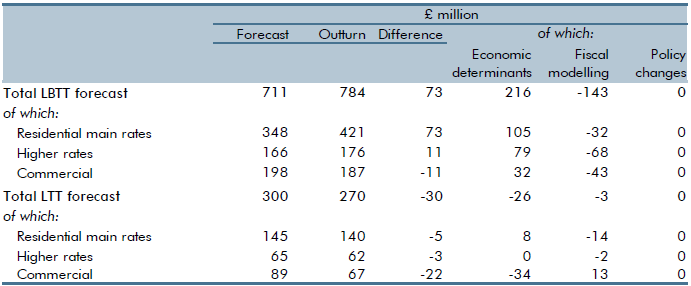
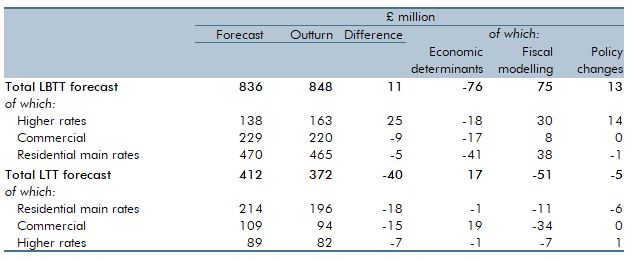
The land and buildings transaction tax (LBTT) was implemented in Scotland on April 1 2015 while the land transactions tax (LTT) began in April 1 2018. Both taxes replaced the UK Government’s stamp duty land tax but operate in similar ways. In this box we evaluated our March 2023 forecasts for 2023-24, and how they compared to the eventual outturn data. We explained the reasons behind the 10.3 per cent surplus for LBTT and the 9.9 per cent shortfall for LTT.
In the run-up to our March 2025 Economic and fiscal outlook, global trade policies had been subject to frequent changes and the future direction for trade policy was highly uncertain. In this box, we outlined three illustrative scenarios to show the potential impact of higher US and global tariffs on UK output and inflation, highlighting the primary transmission channels and their probable effects.
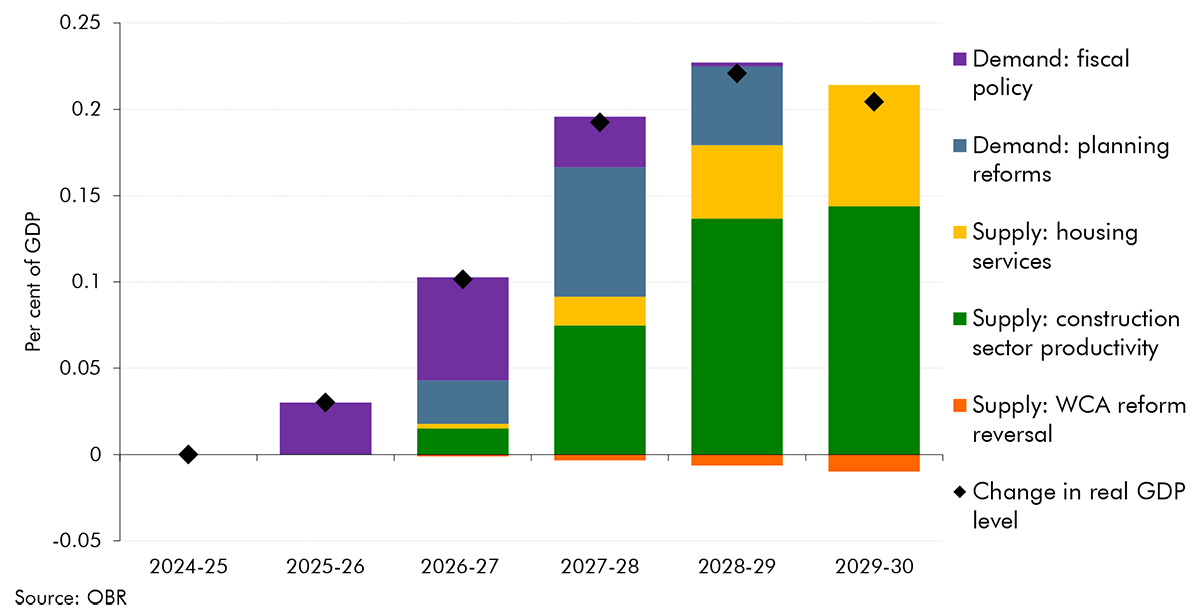
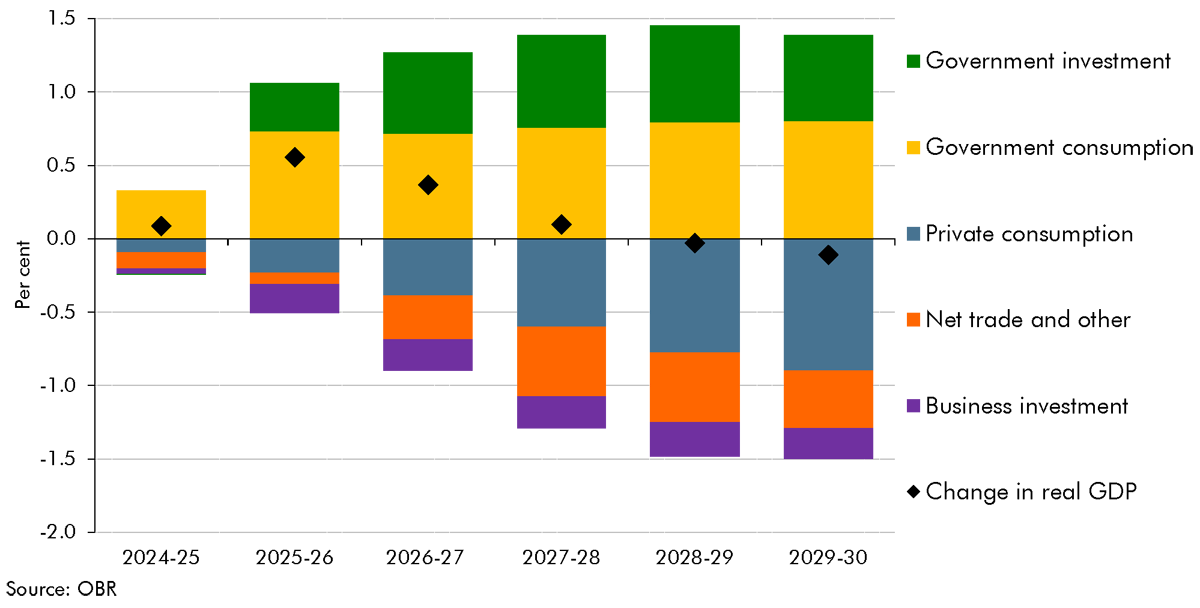
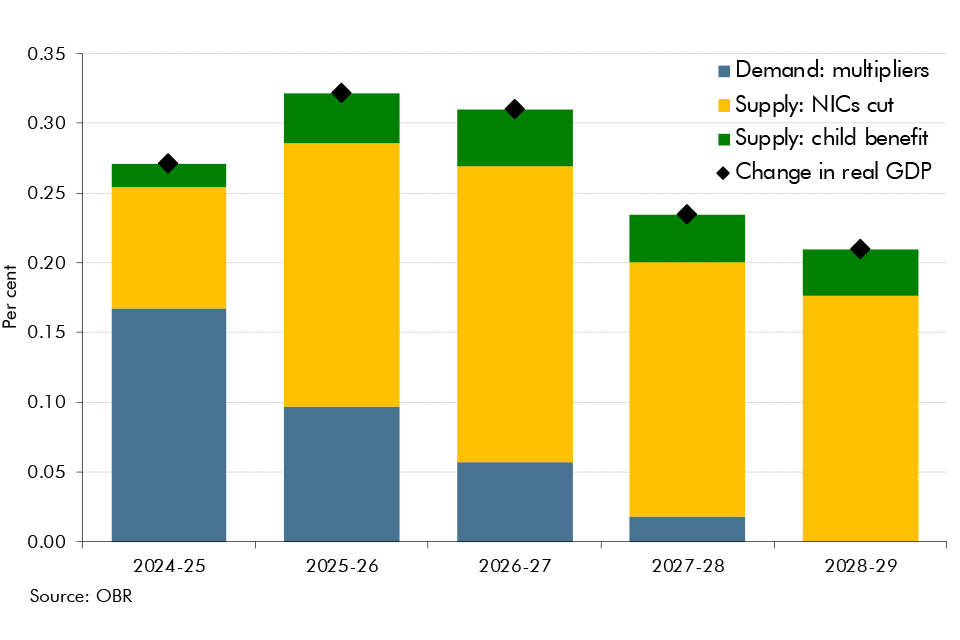
In this box, we discussed the impact that policy changes and announcements since October have on our economy forecast. Specifically, we looked at how the policy package and planning reforms affect real GDP and inflation, before also considering the impact of welfare reforms and its potential future impact.
The Pathways to Work Green Paper announced a range of welfare measures, some of which we have not incorporated in this forecast. In this box, we explained why some measures were not included, and indicated what risks they pose to our welfare spending and labour supply forecasts.
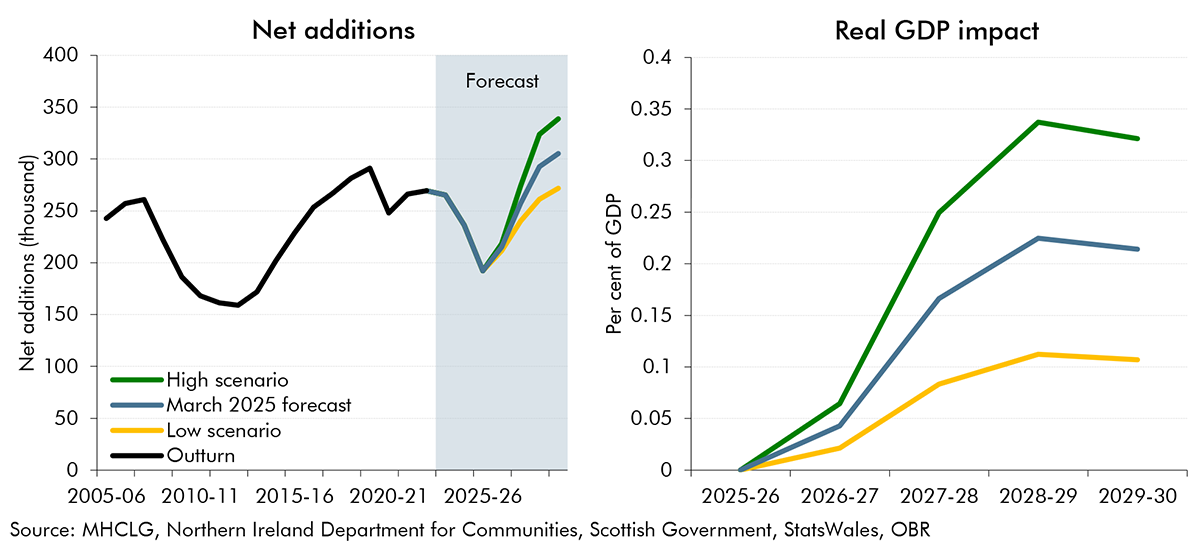
In our March 2025 forecast, we estimated that the Government's residential planning reforms will boost housebuilding by 170,000 and GDP by 0.2% by 2029-30. However, there are significant uncertainties around these estimates. In this box, we explored alternative scenarios for housebuilding and their corresponding impact on GDP.
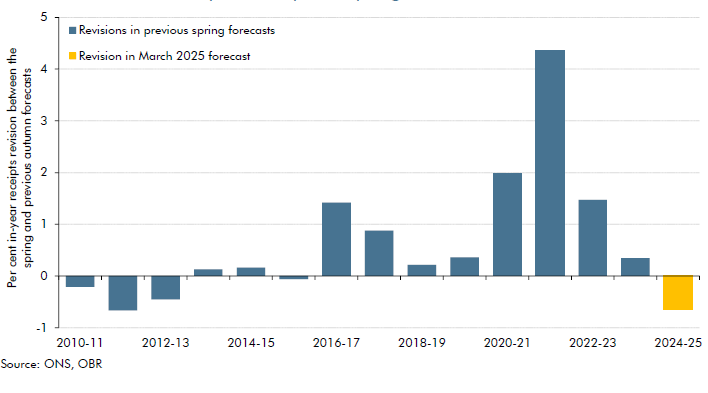
Our March 2025 forecast for 2024-25 receipts is £7.5 billion below our October 2024 forecast. This box compared this shortfall to past Autumn to Spring forecast changes, explained the reasons for this shortfall, and described its impacts on the forecast.
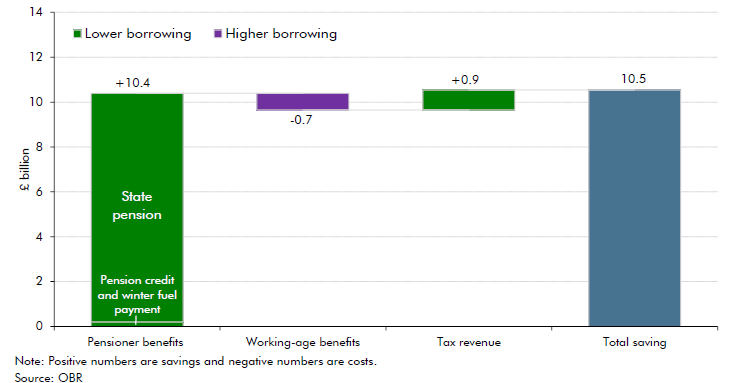
As life expectancy has increased, successive governments have increased the state pension age, and it next increases between 2026 and 2028 from 66 to 67. In this box, we estimated the impact of this increase on pensioner welfare spending, working-age welfare spending, and tax revenue.
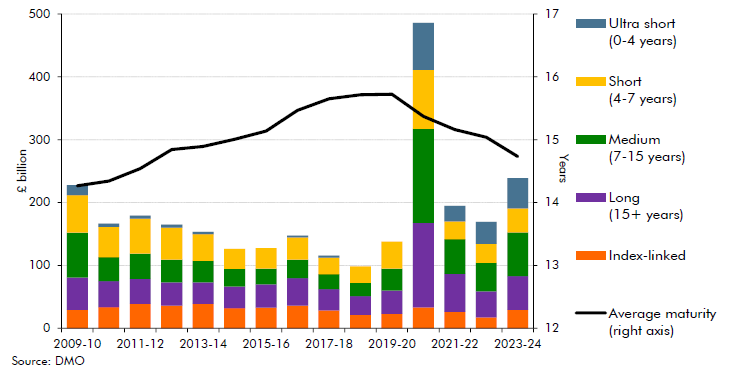
The UK government meets the bulk of its financing needs through issuing gilts across a variety of maturities. In recent years the average maturity of gilt issuance has fallen steadily, this box discussed the drivers of this change and the implications.
In each Economic and fiscal outlook we publish a box that summarises the effects of the Government’s new policy measures on our economy forecast. These include the overall effect of the package of measures and any specific effects of individual measures that we deem to be sufficiently material to have wider indirect effects on the economy. In our October 2024 Economic and fiscal outlook, we adjusted our forecast to account for fiscal loosening and considered the effects of changes to taxation and increases in public investment.
As we finalised our pre-measures forecast on 26 September, our forecast did not include the Quarterly National Accounts released on 30 September 2024, which contained Blue Book 2024 consistent revisions. This box examined the potential implications that including the latest data may have had on our forecast. We judged that the data revisions would have provided limited new information on current economic conditions, leaving our economic and fiscal forecast broadly unchanged.
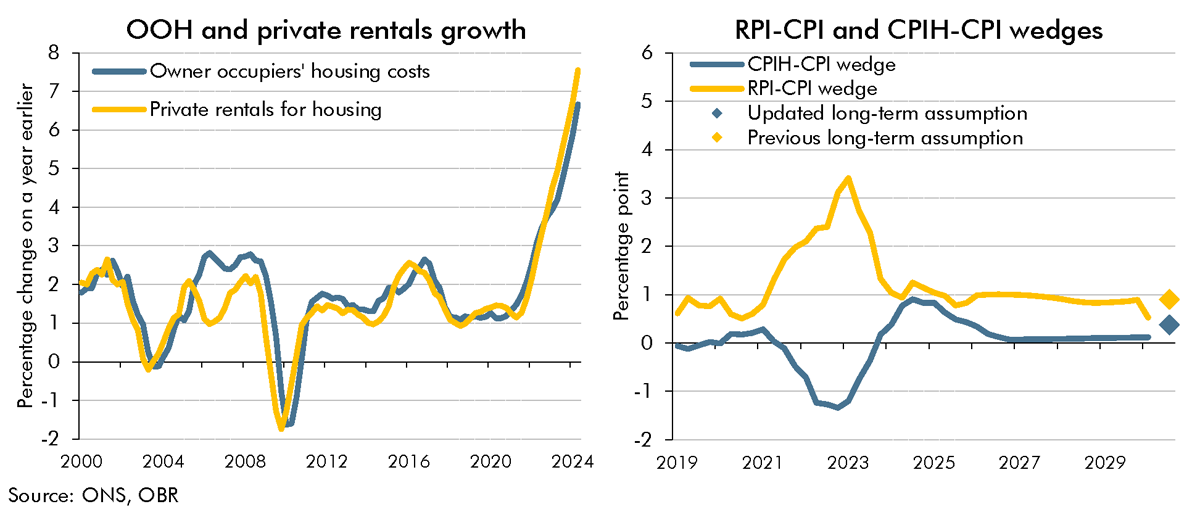
As as result of the shortcomings with the methodology for calculating the Retail Prices Index (RPI), the ONS's current plans are to address these by bringing the methods and data sources from the Consumer Prices Index including owner occupiers' housing costs (CPIH) into the RPI in February 2030. In this box, we explained how this change would impact our estimate of the long-run difference between RPI and CPI inflation.
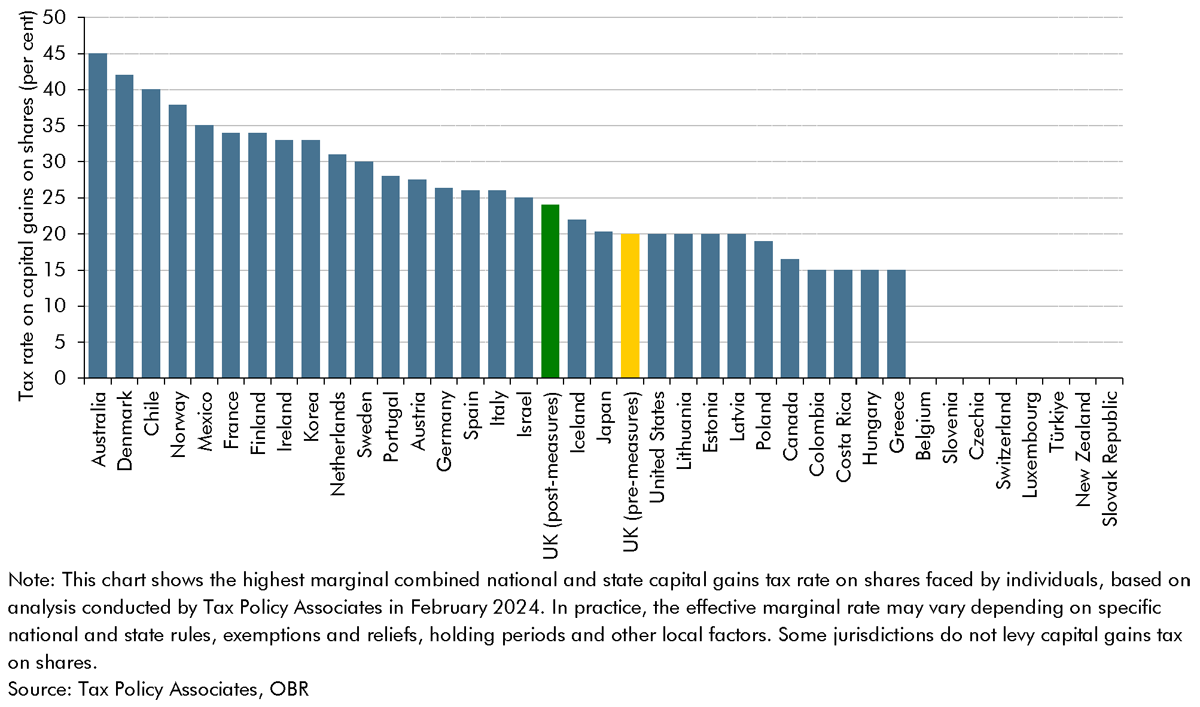
The capital tax measures announced in the October 2024 Budget affected an overlapping set of taxpayers and tax bases, mainly across capital gains tax, inheritance tax and income tax. In this box, we considered how individuals can respond to an increase in a capital tax liability, and what we assumed about these behaviours in our costings for capital tax measures.
The OBR, the Treasury, HMRC, DWP, DfE and DHSC have established a set of monitoring and evaluation arrangements for the 13 policies for which impacts have been explicitly incorporated in our potential output forecast as indirect effects since the Spring Budget 2023. In this box, we provided an update on monitoring and evaluation of these policies, and used the new evidence to assess how implementation and delivery align with our original judgements for indirect effects across the forecast horizon, culminating in a downward revision to labour supply in 2028-29 of 0.04 per cent.
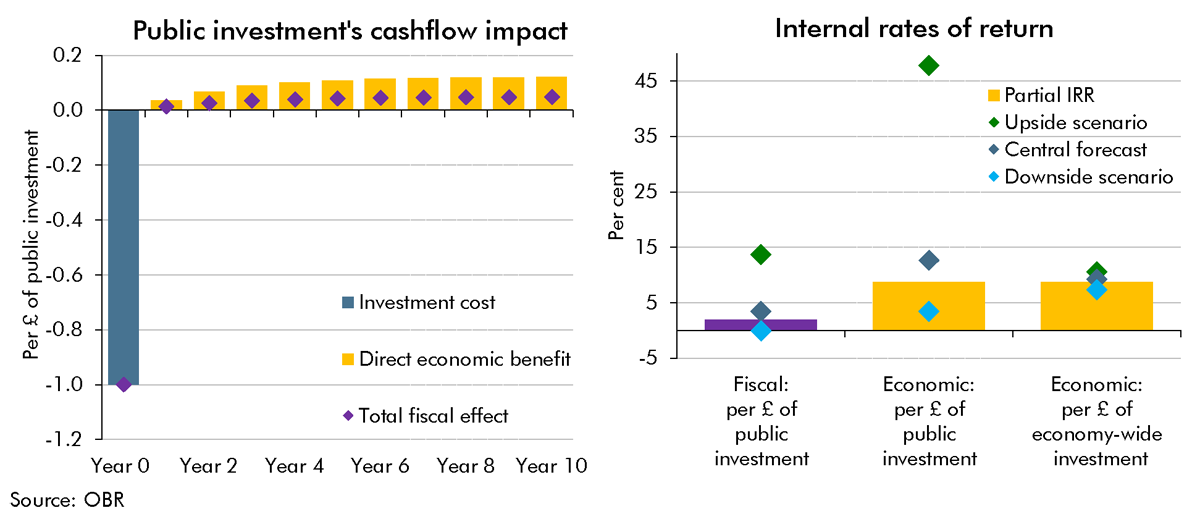
A key uncertainty around the long-run impact of the Budget's plans for higher public investment is the extent to which the public capital stock is a complement to (or substitute for) business investment. This Box provided scenarios in which the future business capital stock was higher or lower than we had assumed in our central forecast. We showed these scenarios' impacts on potential output in 50 years' time and the implications they had for different measures of the internal rate of return on investment.
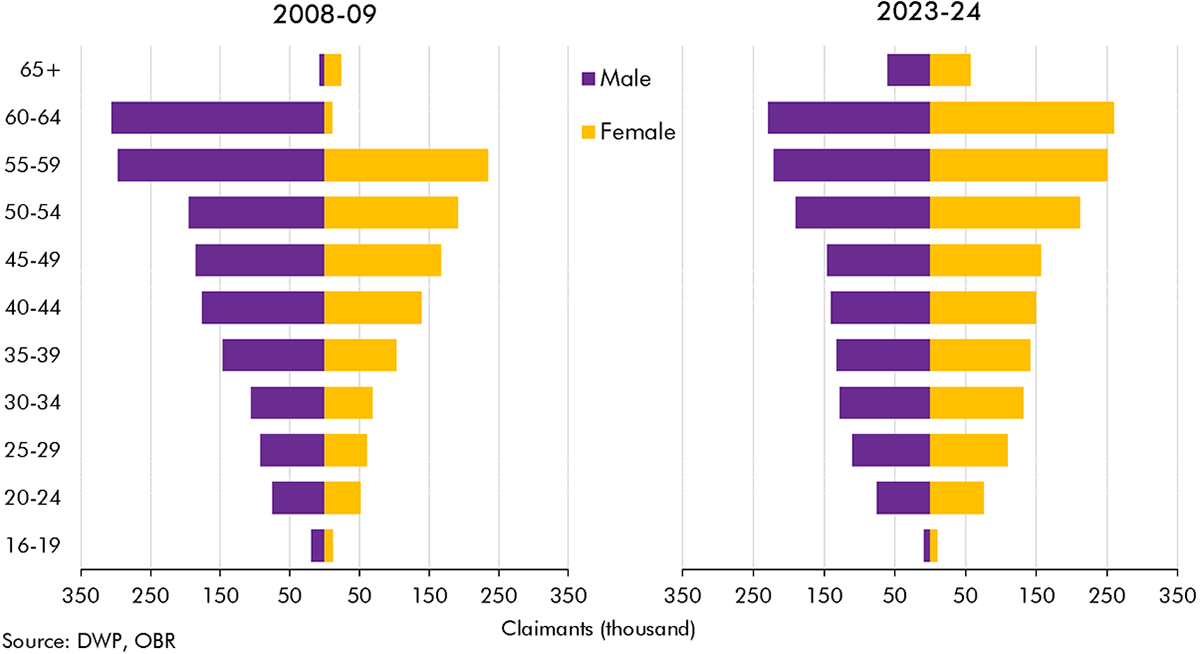
The rise in incapacity benefits after 2013-14 coincided with a rise in the state pension age. In this box we explained how much of the change in incapacity benefit caseload was explained by rises in the state pension age and the ageing of the population.
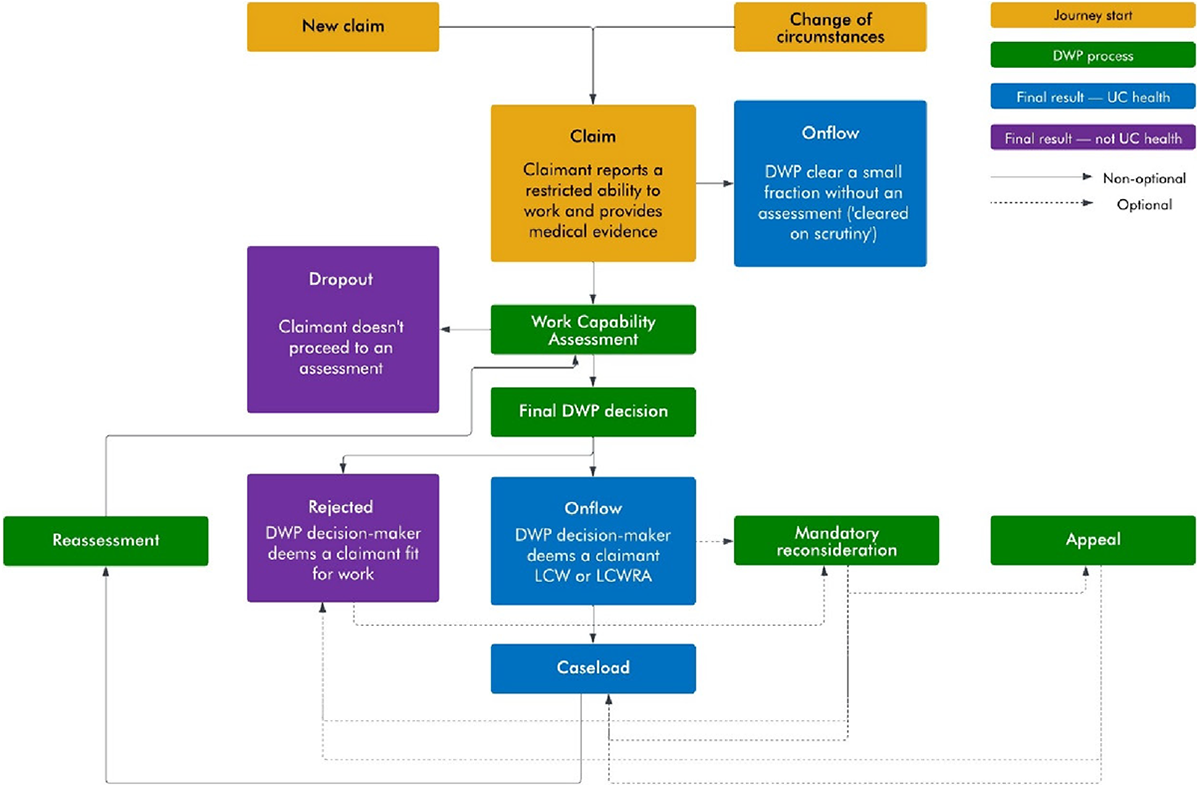
There are several stages before a claimant joins an incapacity benefit. In this box we explained the stages involved in joining either the less-severe (LCW) or more-severe (LCWRA) groups under universal credit, and differences in the predecessor employment support and allowance benefit.
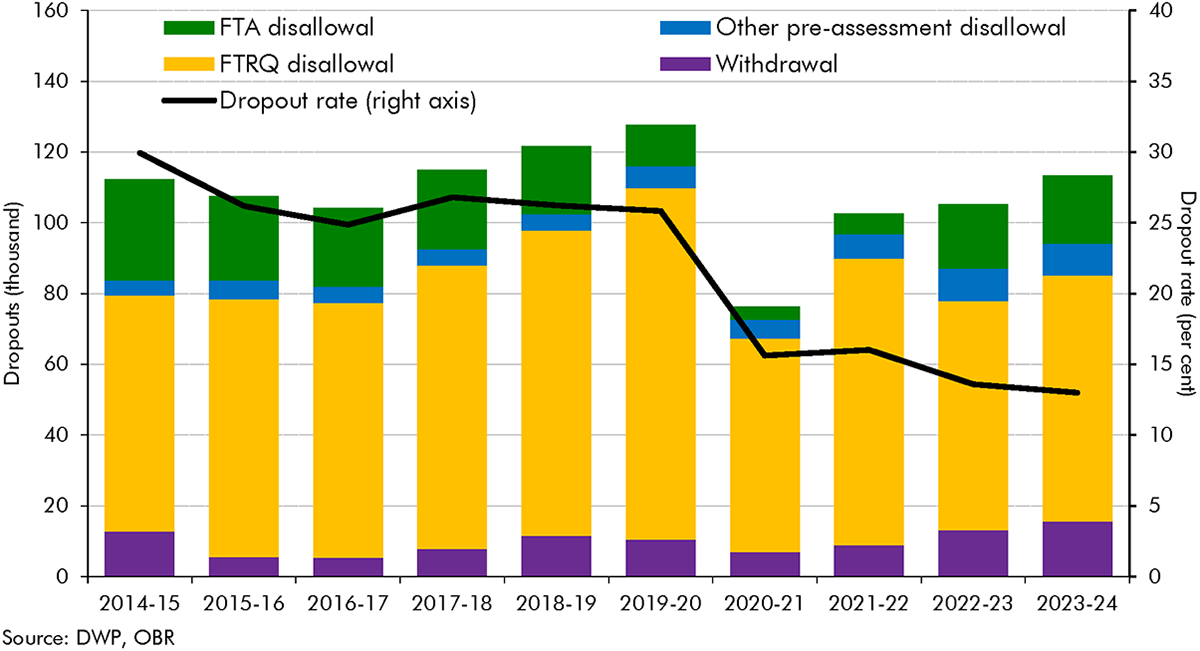
Both incapacity and disability benefit onflows have grown substantially since 2018-19. In this box we compared the different drivers of these respective increases in onflows and drew some lessons from the granular disability benefit data for how incapacity onflows may have been changing.
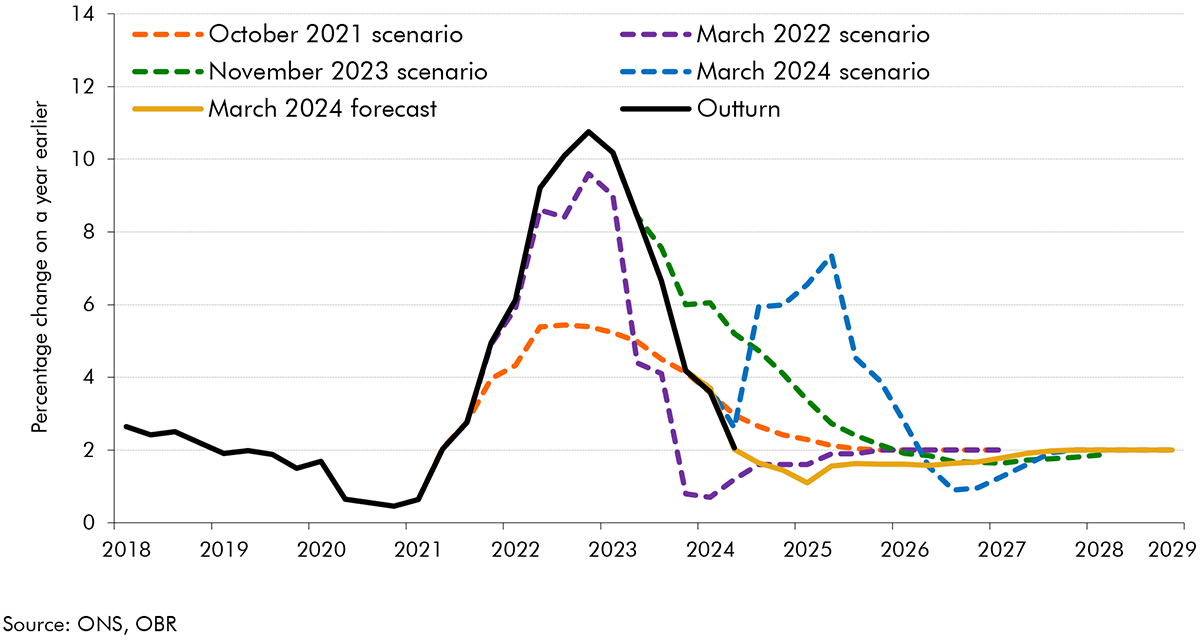
The outlook for inflation was highly uncertain at the time of our March 2023 forecast: the UK was experiencing the largest inflation shock since the 1980s, and the first significant shock in the era of independent inflation-targeting central banks. In this box, we reviewed the ways we have presented uncertainty in our successive EFOs, in particular our use of fan charts and scenarios.
Adaptation measures can significantly reduce the economic impact of climate change, but come with additional costs that add to the fiscal pressure of climate change. This box discussed the current state of adaptation investment within the UK.
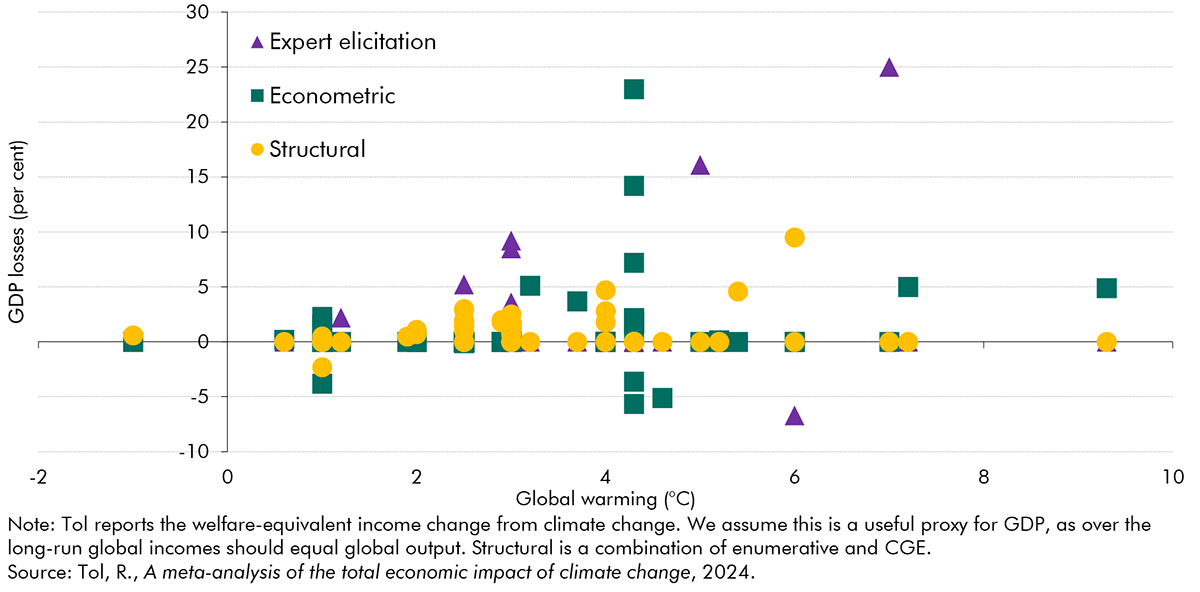
There is growing literature on the economic costs of climate change, where there is near-consensus on the negative impact on economic output but with a wide range of estimated losses. This box explored the the scale of, and reasons for, such differences and examined relevant UK studies in this context.
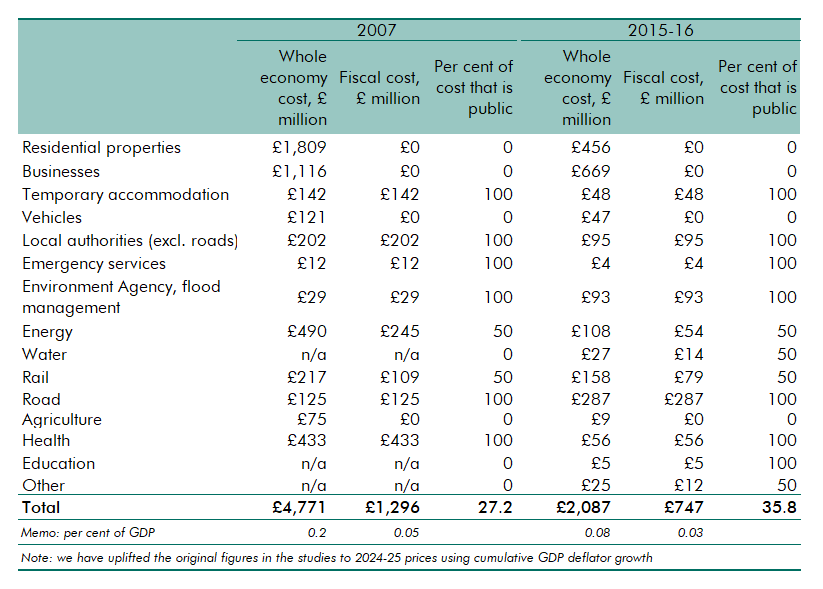
In 2010 and 2018, Defra and the Environment Agency produced reports exploring the costs of the 2007 summer floods and 2015-16 winter floods to the UK economy. In this box we used these numbers to estimate the direct fiscal costs of these flood events.
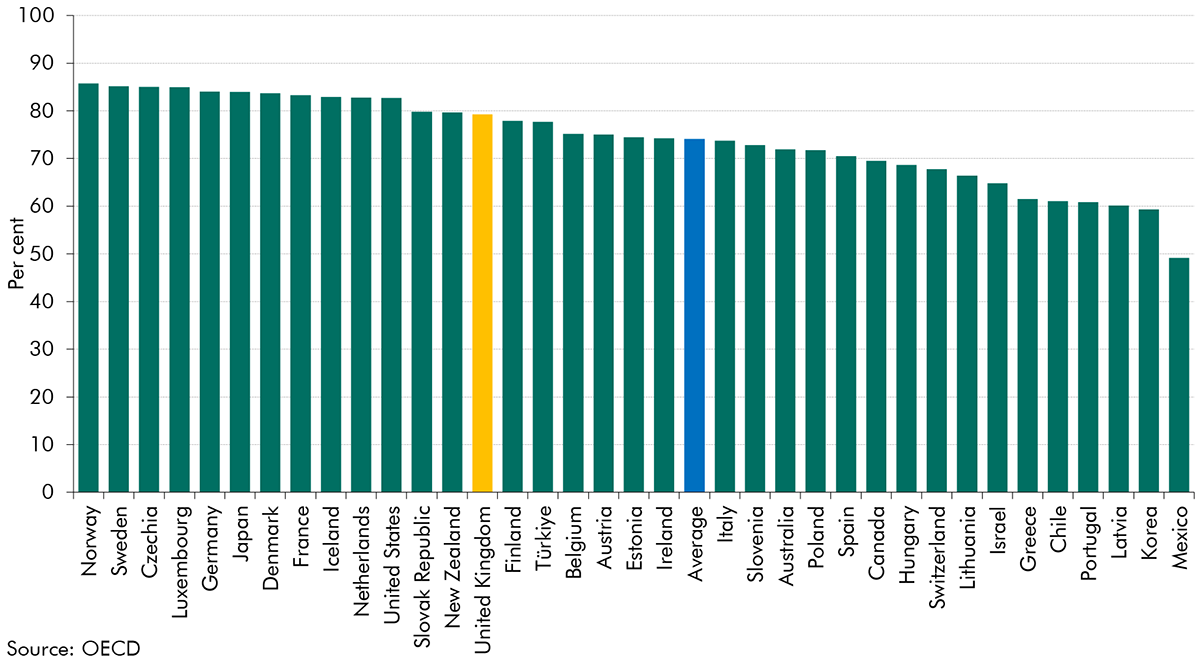
Our long-term fiscal projections focus on public spending on health, but private spending accounts for a significant share of health expenditure in the UK and particularly in other advanced economies. This box explored recent trends in private health spending in the UK and how this compares with other advanced economies.
Income tax was devolved to the Scottish Parliament in 2016 and the Welsh Senedd in 2019. In this box we evaluated our March 2021 forecasts for 2021-22, and how they compared to the eventual outturn data. This was a particularly difficult period to forecast given the economy was recovering from the unprecedented impact of the Covid-19 pandemic. The double-digit difference between our initial forecast and the final outturn, for both Scotland and Wales, is largely explained by the faster-than-expected post-pandemic recovery.
In each Economic and fiscal outlook we publish a box that summarises the effects of the Government’s new policy measures on our economy forecast. These include the overall effect of the package of measures and any specific effects of individual measures that we deem to be sufficiently material to have wider indirect effects on the economy. In our March 2024 Economic and fiscal outlook, we adjusted our forecast to account for fiscal loosening and considered the effects of policy to boost employment on our potential output forecast.
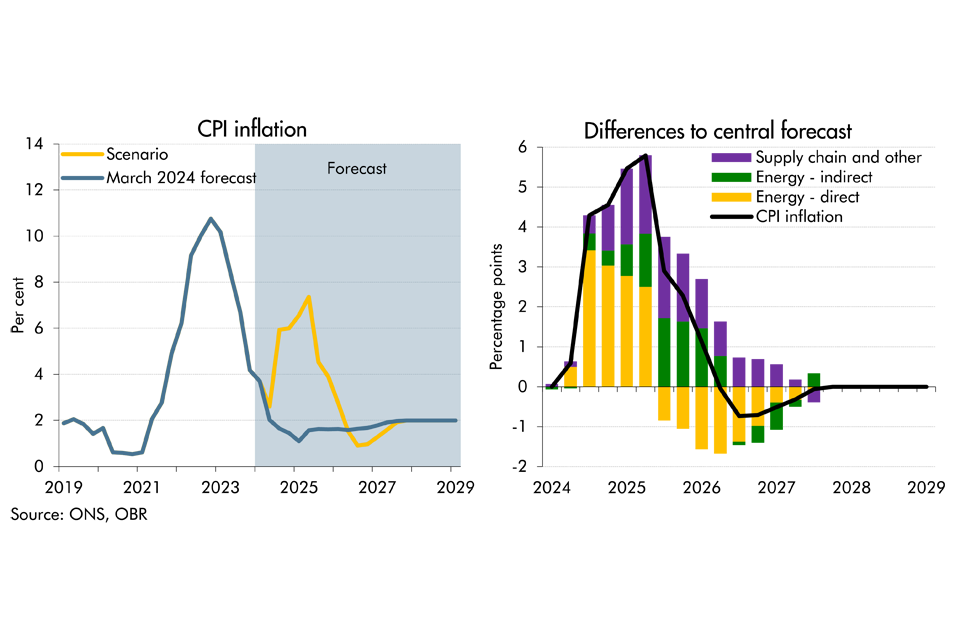
As tensions have risen in the Middle East, there has been increasing concern over the possibility of a wider escalation in the region and its implications on the UK economy. In this box we considered the economic growth and inflationary implications of an adverse scenario. In this scenario, supply chain disruption reaches levels not seen since the pandemic levels and energy costs rise sharply for a second time since the pandemic.
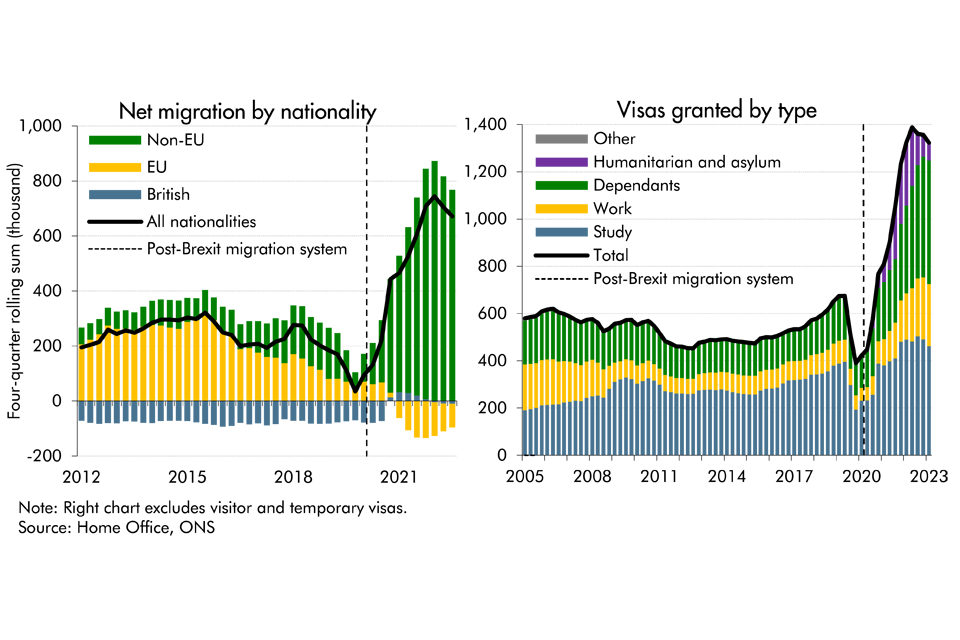
Latest data from the ONS suggest that net migration to the UK was higher than previously thought in recent years, while it's also projected to be higher than previously expected. In this box, we presented our migration forecast and its impact on labour supply. As there is considerable uncertainty around the outlook, we also considered alternative scenarios for net migration and its economic impact.
The land and buildings transaction tax (LBTT) was implemented in Scotland on April 1 2015 while the land transactions tax (LTT) began in April 1 2018. Both taxes replaced the UK Government’s stamp duty land tax but operate in similar ways. In this box we evaluated our March 2022 forecasts for 2022-23, and how they compared to the eventual outturn data. We explained the reasons behind the 1.4 per cent surplus for LBTT and the 9.6 per cent shortfall for LTT.
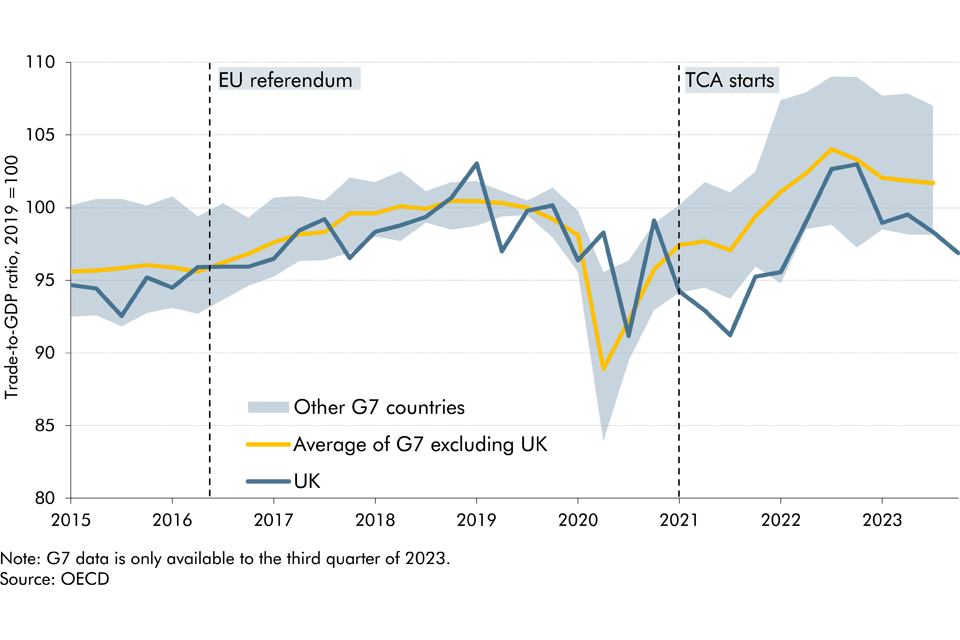
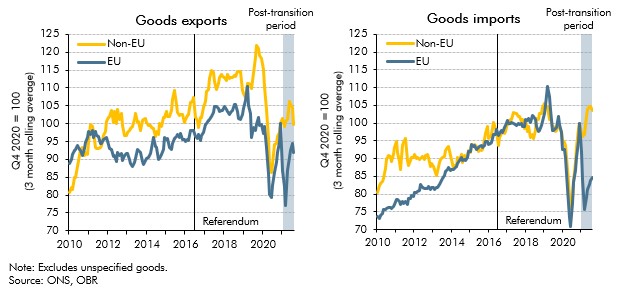
Since the June 2016 EU referendum, our forecasts have incorporated a set of assumptions about the economic impact of Brexit on trade, productivity, investment, and migration. In this box, we assessed our current assumptions on trade against the latest evidence.
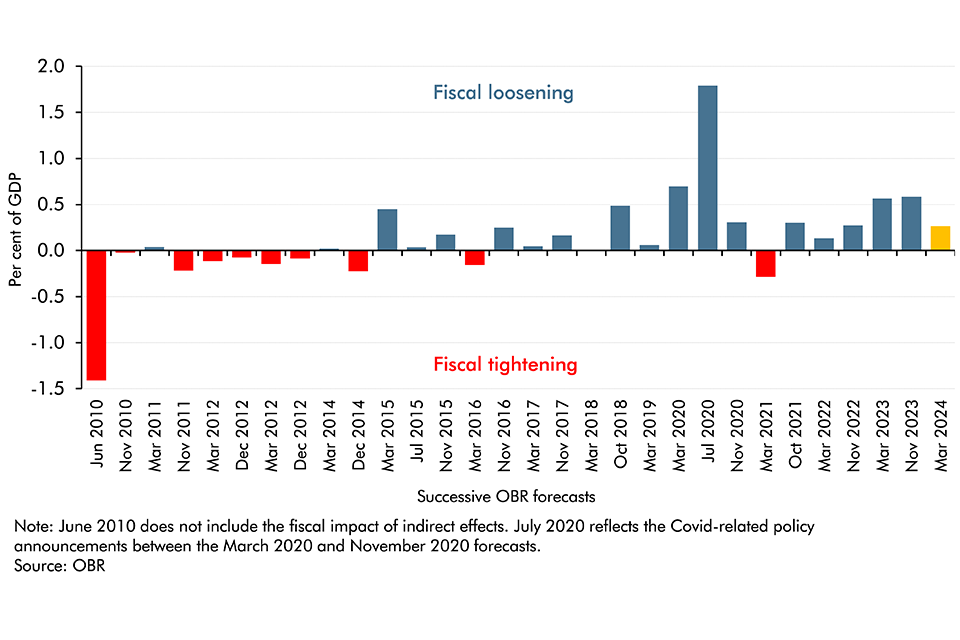
In Budget 2024, the Chancellor has chosen to loosen fiscal policy following the improvement in the underlying fiscal outlook. This continues the consistent pattern of expansionary fiscal policy packages that have been announced in recent years. Since 2010, in every instance of good news on the underlying fiscal position, the policy response has been to spend at least some of the windfall.
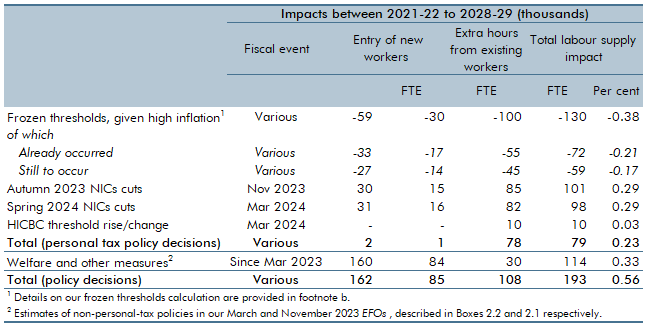
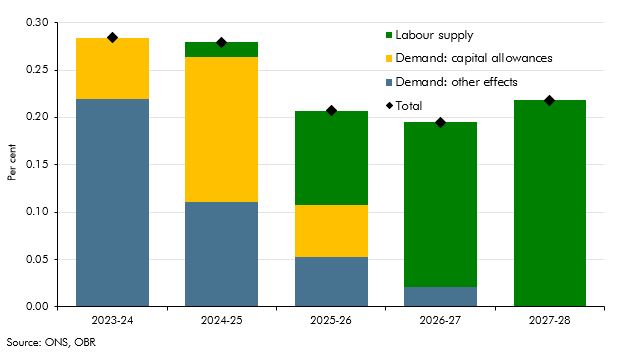
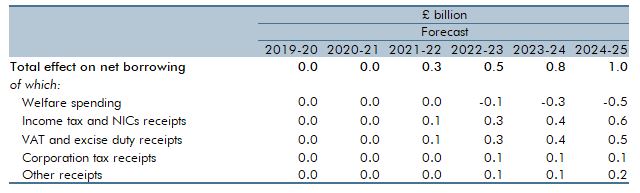
Between March 2021 and November 2022, almost all the main allowances and thresholds in income tax and national insurance contributions (NICs) were frozen rather than indexed to inflation, as is the default in nearly all cases, up to and including 2027-28. The Chancellor has subsequently announced personal tax cuts that are due to offset around a half of the resulting impact on the personal tax burden by 2028-29. In this box, we showed estimates for total effects of these policy decisions on work incentives, given high inflation, over the period from 2021-22 to 2028-29.
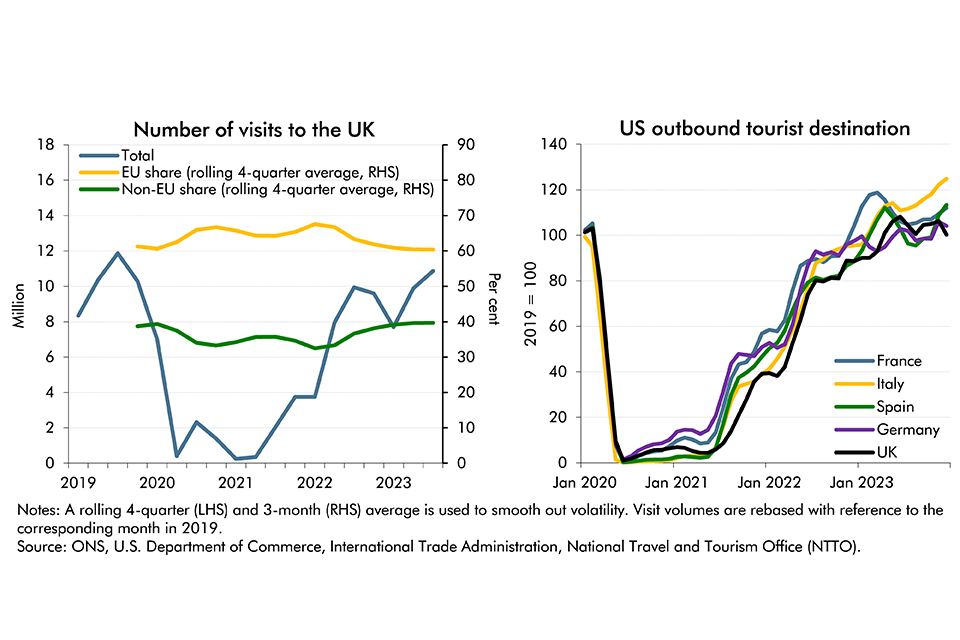
The VAT Retail Export Scheme enabled non-EU visitors to the UK to reclaim the VAT incurred in purchasing goods from participating retailers. It was abolished following the UK’s exit from the EU in January 2021. In reviewing our November 2020 costing in this box, we concluded that its methodology still appears reasonable and that the costing was a central estimate. We updated that estimate to account for the impacts of visitors’ wider spending, but continued to believe that this measure is unlikely to significantly affect the productive capacity of the economy.

The tax gap is the difference between taxes collected by HMRC and the theoretical liability, or what, in theory, should be collected. As a share of GDP, it has reduced from 2.3 per cent in 2005-06 to 1.5 per cent in 2021-22, two-thirds of which is explained by reductions in the VAT gap. In this box, we explored the recent drivers of changes in tax gaps, explained what assumptions we make about tax gaps in our forecast and outlined the associated uncertainties.

In the final four years of our March 2024 forecast, departmental spending follows an overall envelope set by the Government because the detailed departmental spending plans set at the last Spending Review only extend to March 2025. In this box, we explored the implications of these plans for different departments, and how past governments have revised departmental spending at Spending Reviews.

Debt interest spending has reached post-war records as a per cent of revenue and GDP in recent years and has also proved to be incredibly volatile and subject to large revisions between our forecasts. In this box we looked at the reasons for this elevated spending and volatility and how the process of quantitative tightening by the Bank of England will impact the maturity of this debt.
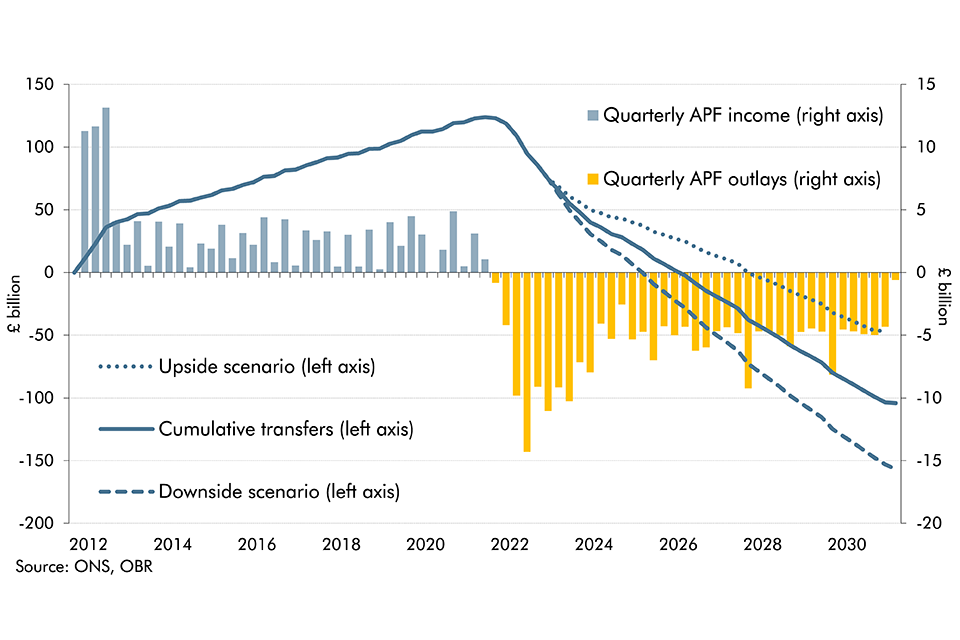
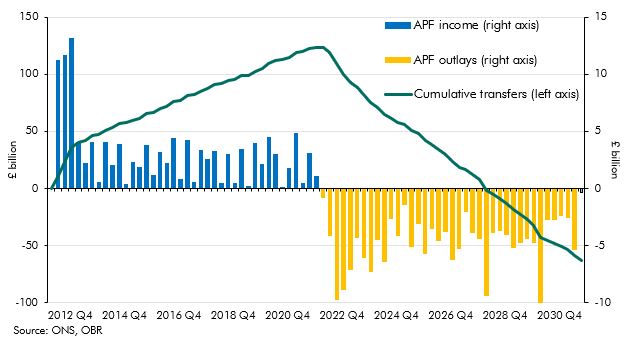
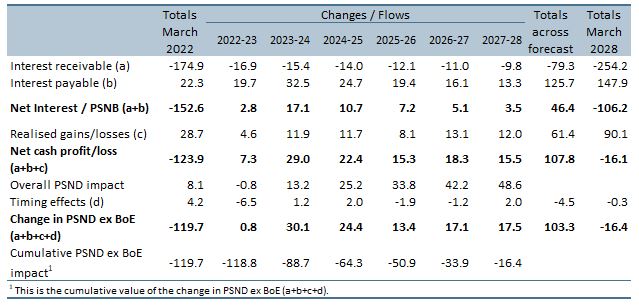
The Bank of England's Asset Purchase Facility (APF) conducts the Bank's operations for quantitative easing and tightening. In this box we updated our estimate of the lifetime direct costs of the APF and scenario analysis looked at the impact of changes in interest rates on this lifetime cost.

Following the upwards revision to our migration forecast, this box explored the implications of higher migration on our central forecasts for tax revenues, spending and borrowing. We also drew on alternative scenarios for migration to illustrate how uncertainty in the migration forecast translates into the fiscal forecast.

Public sector net debt (excluding the Bank of England) as a share of GDP has tripled since the beginning of this century. This box explored the drivers of the rise and its evolution over the forecast.
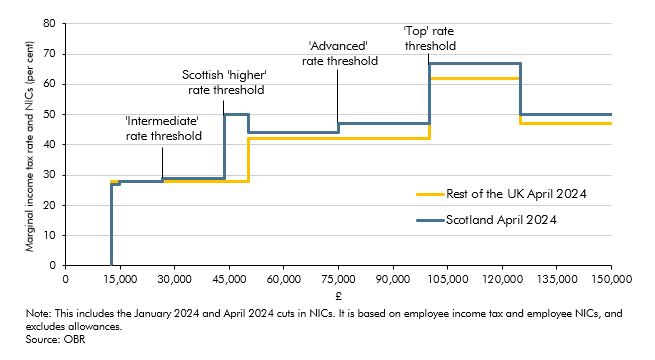
Income tax was devolved to the Scottish Government in 2016 and policy changes since then have led to a divergence with the UK Government’s income tax system. In this box we explored the costing of the Scottish Government’s December 2023 decision to introduce a new 45 per cent ‘advanced’ rate and to raise the ‘top’ rate to 48 per cent, including the potential behavioural responses.
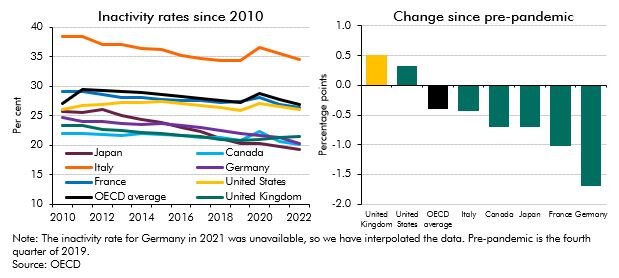
Inactivity fell across the G7 countries in the years prior to the onset of the pandemic and the UK consistently had one of the lowest inactivity rates. Since then inactivity has risen in the UK and US, but fallen across the rest of the G7 countries. This box detailed these changes and looked at ill-health as a driver of inactivity across the G7.
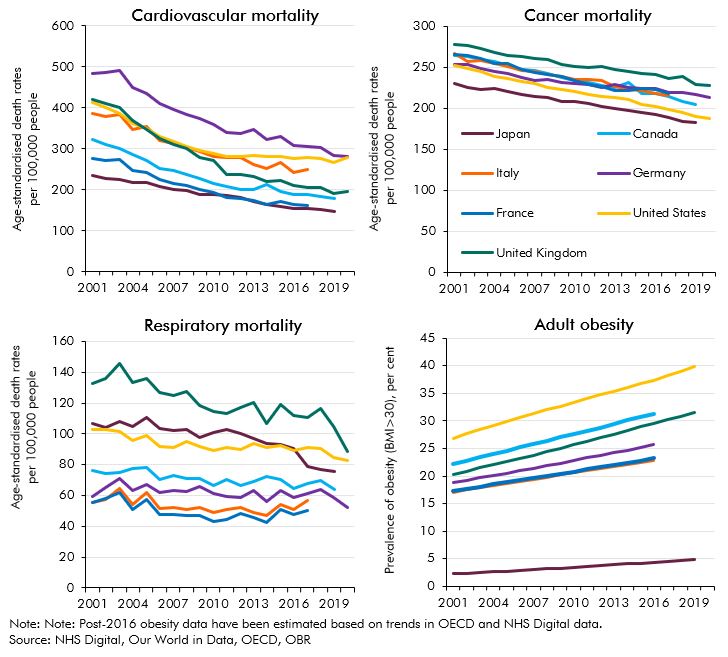
The improvements seen in life expectancy and a variety of other health indicators in the UK over a period of several decades have slowed down and - in some cases - partially reversed. This box detailed these changes and compares them to trends in other G7 countries.
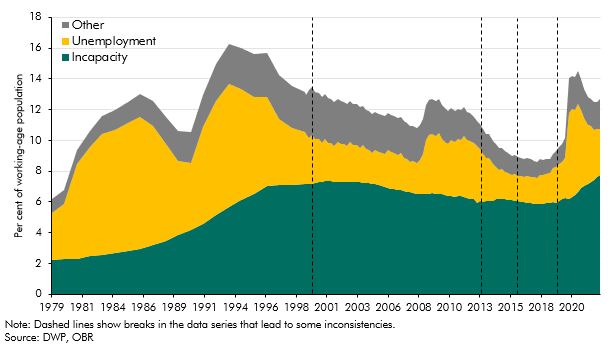
Benefits for working-age claimants with health problems have changed significantly over the last thirty years through the introduction of new benefits and assessments. This box described how the UK welfare system operates for working age claimants with and without health problems, and how this has changed over time.
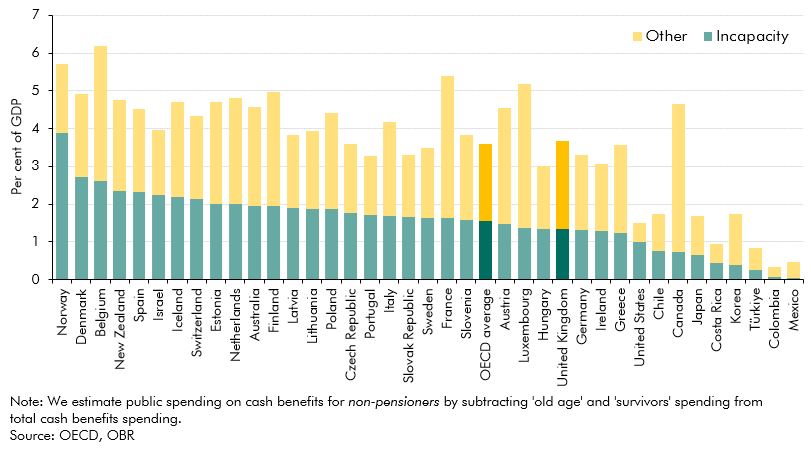
The UK spent close to the OECD average on non-pensioner cash benefits in 2019. This box compared the provision and generosity of health-related welfare across countries, drawing on several international studies.
The referral to elective treatment waiting list in England has risen steadily since the onset of the pandemic, to 7.4 million treatments in April 2023. This box used waiting list and LFS data to estimate the effect on employment and inactivity of halving the waiting list by 2027-28.
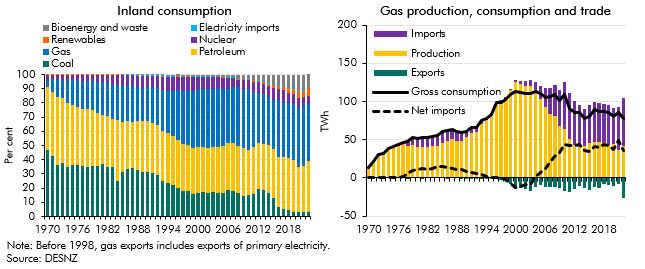
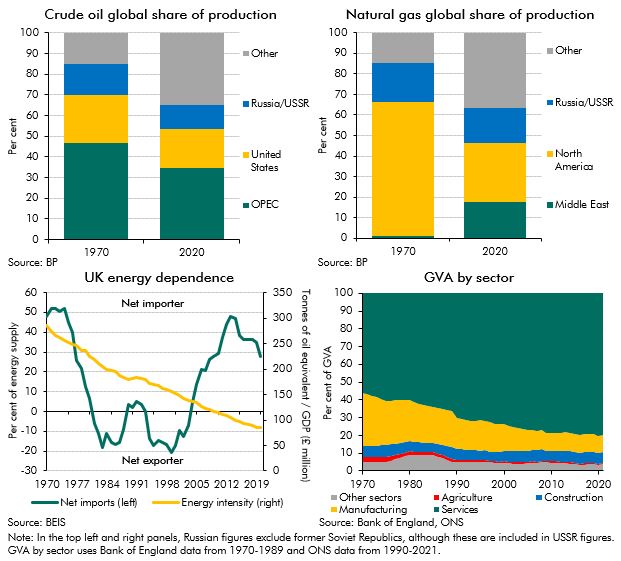
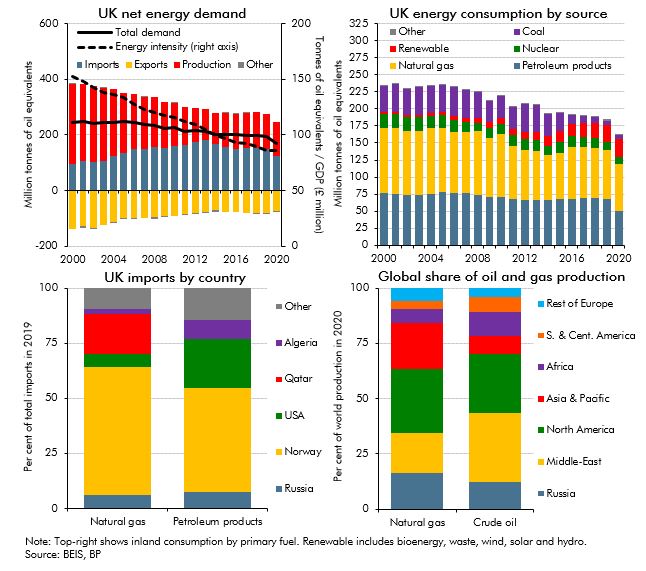
Since 1970 the UK's energy sector has undergone significant shifts following the discovery of oil and gas in the North Sea and the energy shocks of the 1970s. In this box we summarised the historical events and changes that has led to the UK has become increasingly dependent on imported gas.
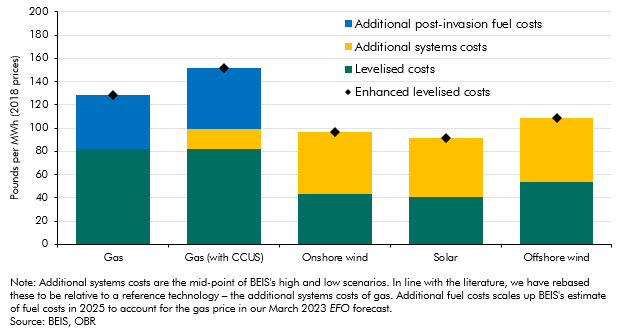
An estimate of the full cost of different energy sources to the power system needs to reflect more than just the construction and operating costs of energy generators that are captured in the levelised cost of electricity (LCOE). In this box we explored enhanced measures of levelised costs of energy.
Since our 2021 Fiscal risks report - which showed that reaching net zero carbon emissions will have significant impacts on the public finances in the UK - estimates of the fiscal impacts of reducing emissions in other countries have begun to be produced. In this box we recapped our 2021 work and discussed how IMF and French analysis compared to it.
Up to July 2022 the Bank of England's quantitative easing (QE) activities had made large profits resulting in large transfers to the Treasury but since then flows have reversed. This box described what the whole lifetime direct costs of QE would be based on our March EFO assumptions.
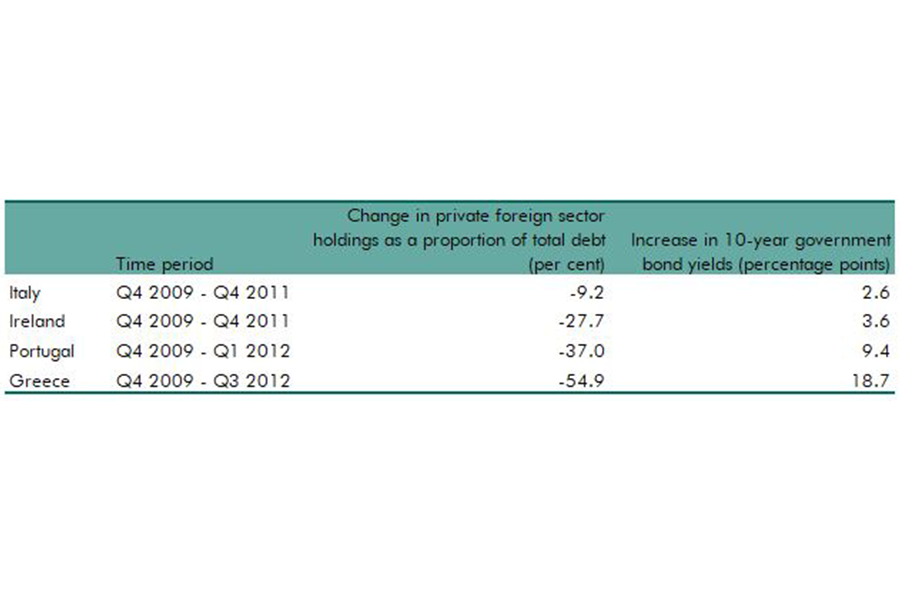
As the stock of foreign holdings of UK debt has risen this century, so have questions about the risks of increasing, relatively high, levels of these holdings. This box looked at the why holdings of debt by foreign investors may lead to greater market volatility.
There has been a notable shift in the environment of interest rates over the past 18 months in the UK. This box looked at the extent of surprise for rate rises relative to market implied expectations and the increase in capital adequacy ratios of UK banks since the global financial crisis.
Our recent forecasts have significantly underestimated inflation outturns, with the March 2021 underestimation of inflation in 2022-23 being the largest difference between forecast and outturn since the OBR began forecasting in 2010. In this box we explored the reasons that might have driven these differences since our March 2022 forecast. In particular, we considered the extent to which the knock-on effects of higher energy prices on CPI inflation might have been higher than we originally assumed.
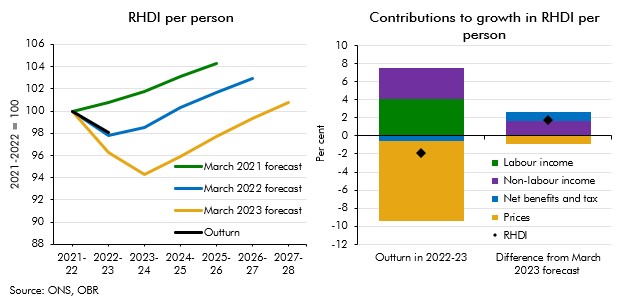
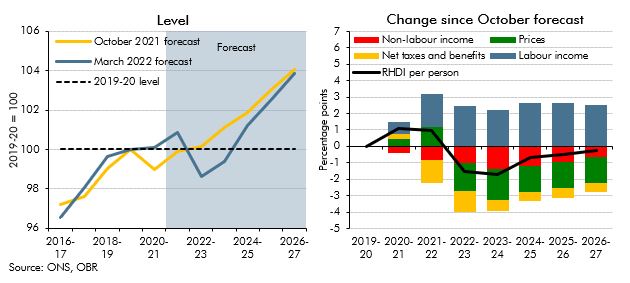
Real household disposable income turned out stronger than our recent forecasts expected for 2022-23. This box explained that differences are largely explained by net benefits and taxes as well as non-labour incomes providing stronger support to living standards than forecast.
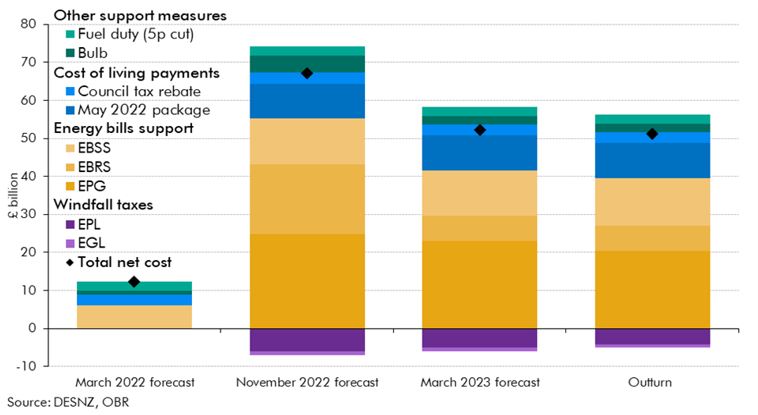
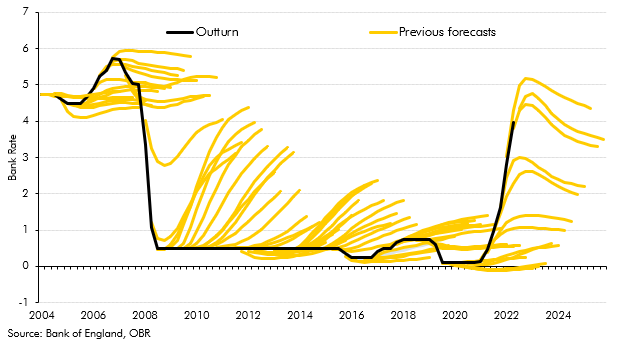
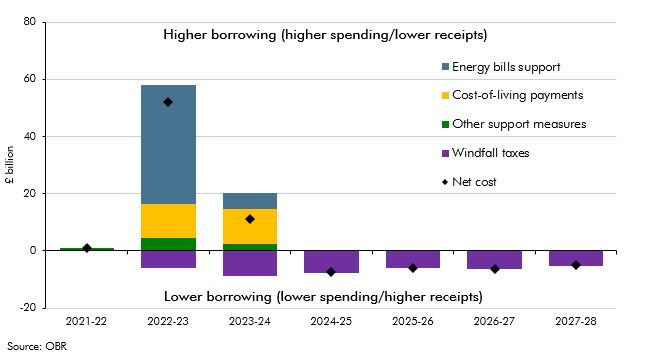
Russia’s invasion of Ukraine in late February 2022 led to a surge in wholesale and retail energy prices, and a subsequent rise in inflation to a four-decade high. To support households and businesses, the Government introduced a series of policies during 2022 which were a key factor pushing spending and borrowing outturn in 2022-23 above both our March 2021 and March 2022 forecasts. This box examines how the costs associated with this policy response in 2022-23 evolved over successive forecasts and in initial outturn.
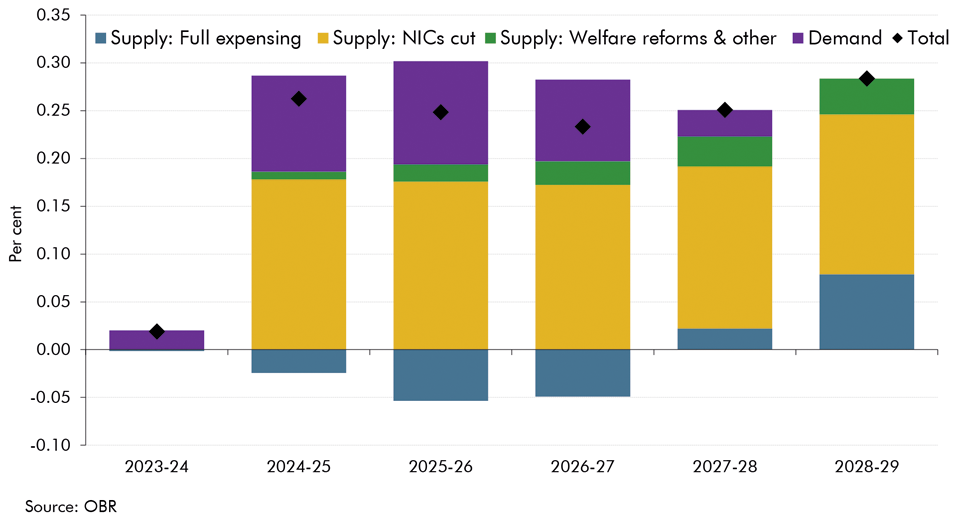
In each Economic and fiscal outlook we publish a box that summarises the effects of the Government’s new policy measures on our economy forecast. These include the overall effect of the package of measures and any specific effects of individual measures that we deem to be sufficiently material to have wider indirect effects on the economy. In our November 2023 Economic and fiscal outlook, we adjusted our forecast to account for permanent full expensing and fiscal loosening. And, we considered the effects of policy to boost employment on our potential output forecast.
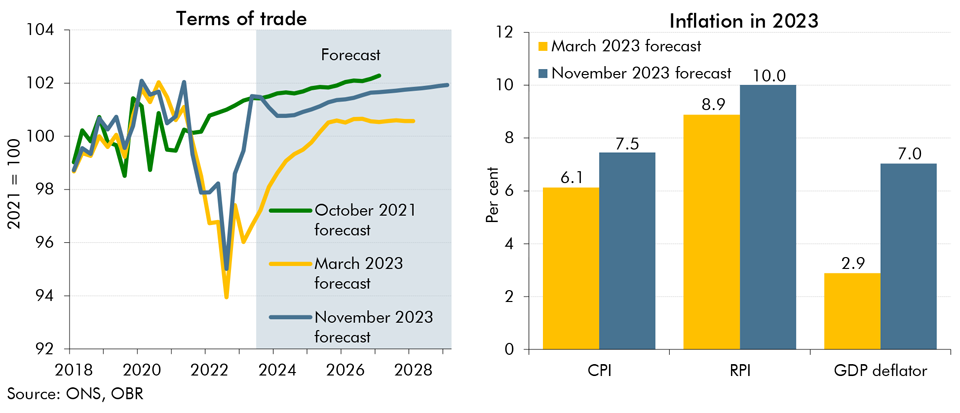
In our November 2023 forecast we expect inflation to be both more persistent and more domestically generated than in March. In this box we explored the reasons behind our assessment for inflation to be more domestically rather than externally driven and its implications for the public finances.
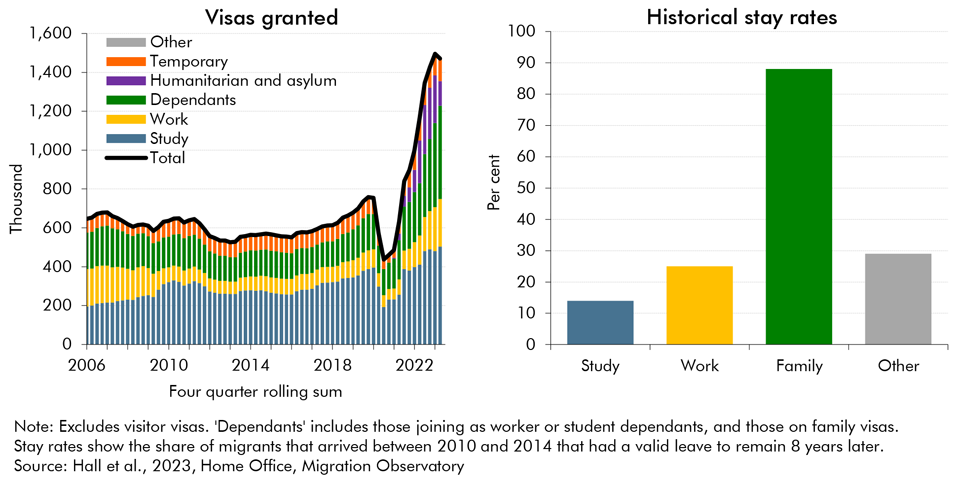
Net migration to the UK increased substantially in recent years but the ONS's population projections, that normally underpin our forecast, did not fully account for that rise at the time. In this box, we explored recent trends in migration and outlined our revised near-term migration forecast. We also examined how likely the migrants were to participate in the labour market.
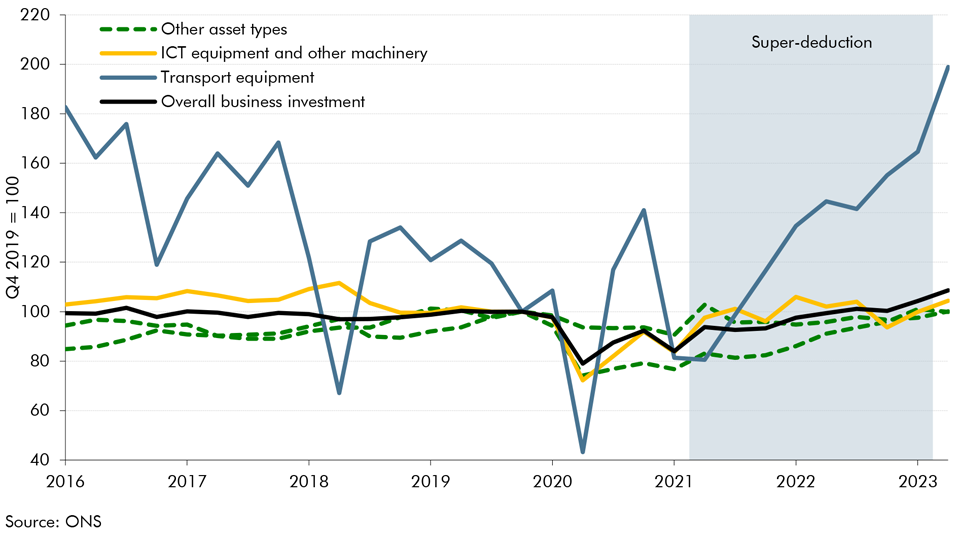
Over the last 3 years, the UK corporation tax system has witnessed four major changes which have consequences on the outlook for business investment. In this box, we explored the effect of the corporation tax rate rise and the super-deduction on investment, before assessing the impact of moving from temporary to permanent full expensing as announced in this Autumn Statement.
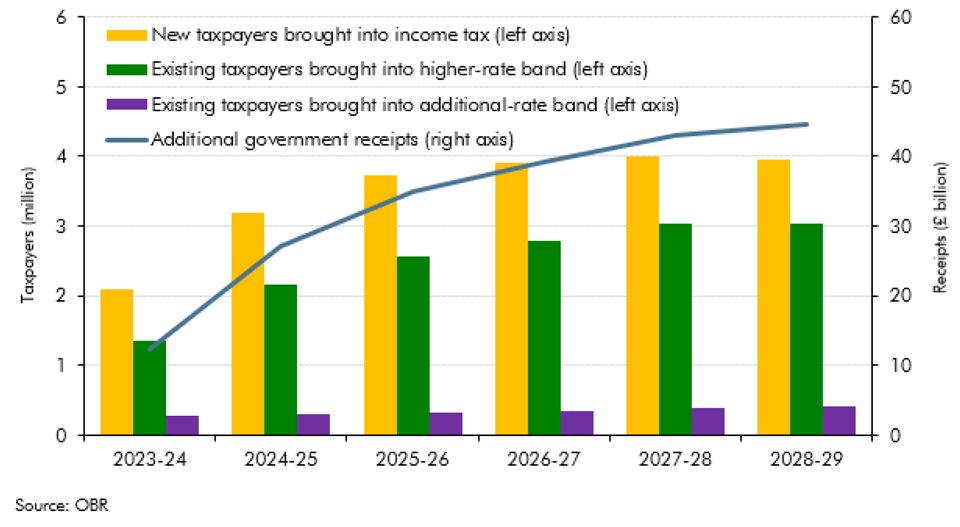
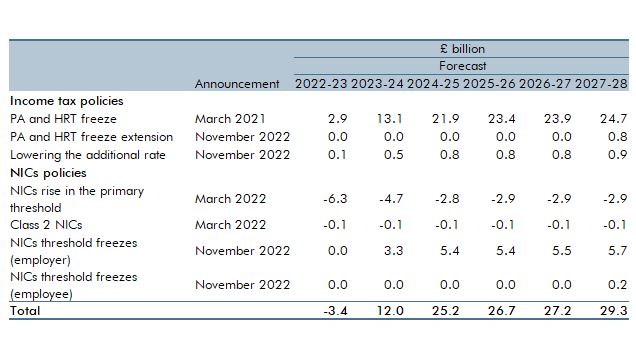
This box discussed the continuing impact of the multiple freezes and changes to personal tax thresholds between March 2021 and November 2022. It provided an update on the estimated receipts from these policies, and the additional number of tax payers by tax band.
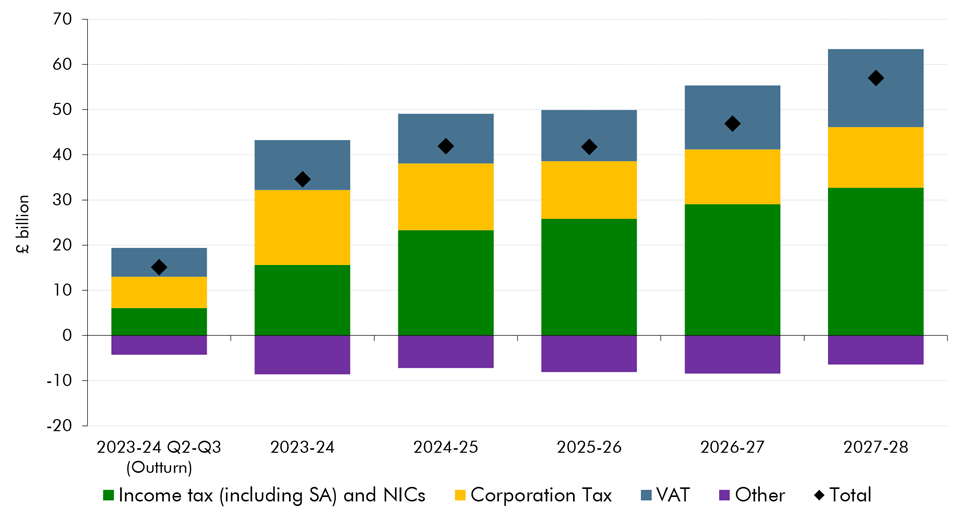
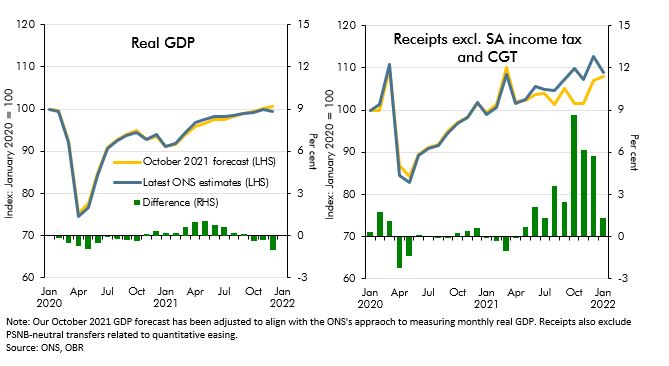
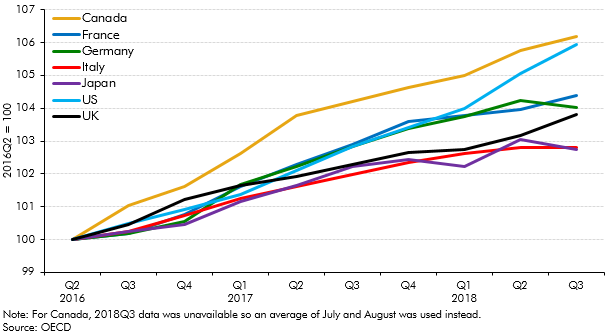
We have made a significant upward revision to our pre-measures receipts forecast. This box explored the drivers behind the revision, which taxes drive the revision and how much of this change is due to real GDP, inflation and the effective tax rate.
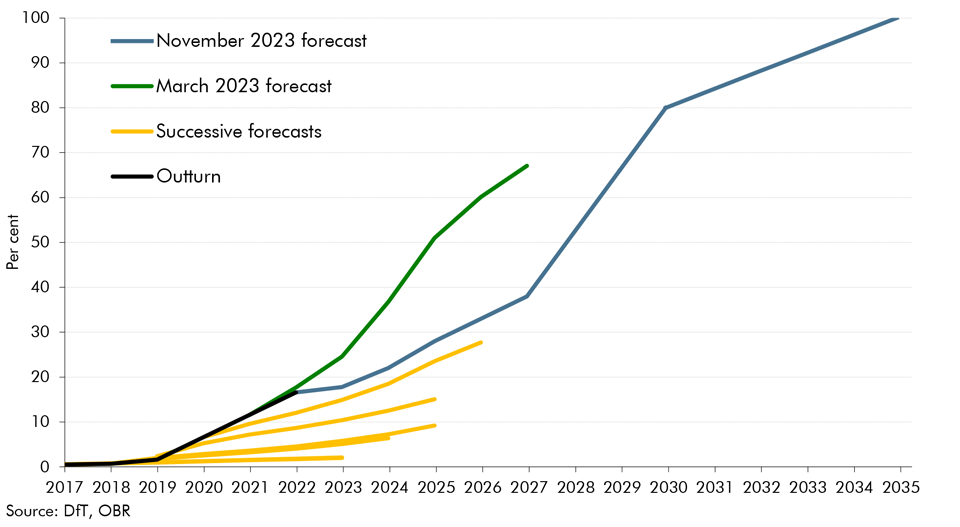
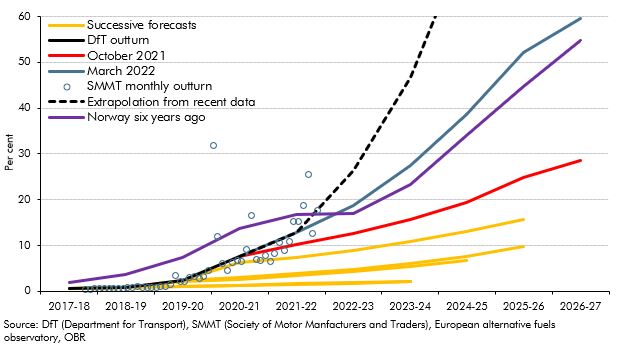
The transition to electric vehicles (EVs) has direct fiscal implications for fuel duty revenues (and, to a lesser extent, vehicle excise duty). In this box we explained why we have revised down our EV assumptions and the impact of this revision on fuel duty and VED revenues.
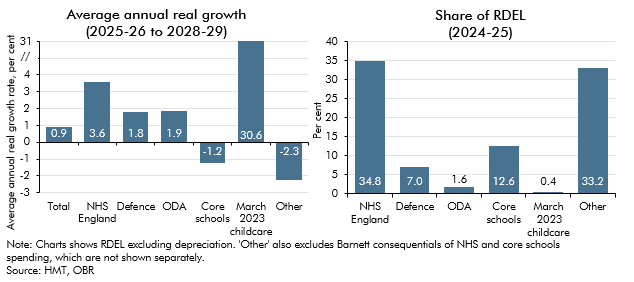
In the final four years of our November 2023 , departmental spending follows an overall envelope set by the Government because the detailed, department-by-department plans set at the last Spending Review only extend to 2024-25. In this box, we explored the implications of these plans for different departments.
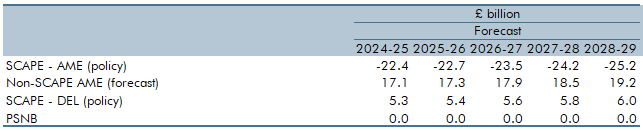
The new SCAPE discount rate, to be implemented in April 2024, increases the present value of future pensions payments and in turn causes employer contributions to rise. Box 4.4 explained the SCAPE rate change and its overall impact on the public finances.
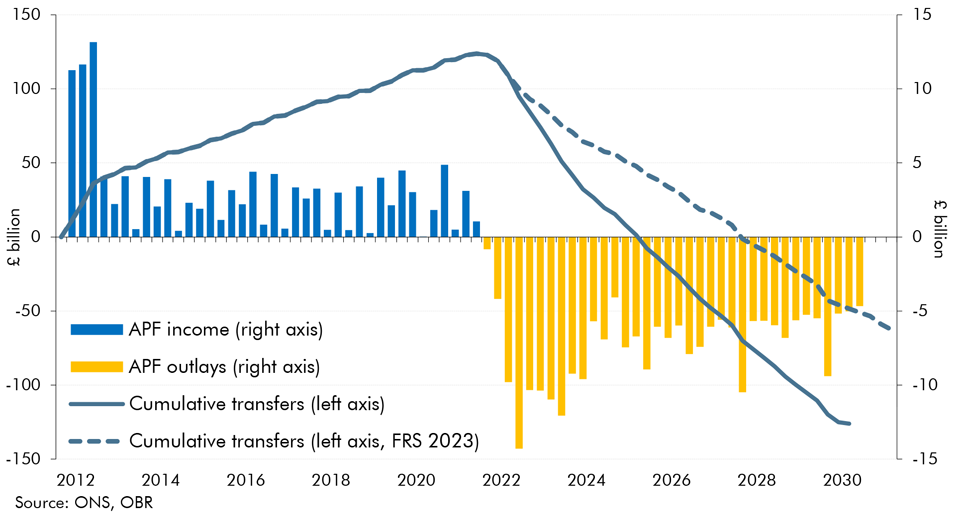
The Bank of England's Asset Purchase Facility (APF) conducts the Bank's operations for quantitative easing and tightening. Since the sharp rise in interest rates in 2022, historic profits from the APF have turned to losses. This box looked at the impact of these losses on fiscal aggregates and the lifetime direct cost of QE.
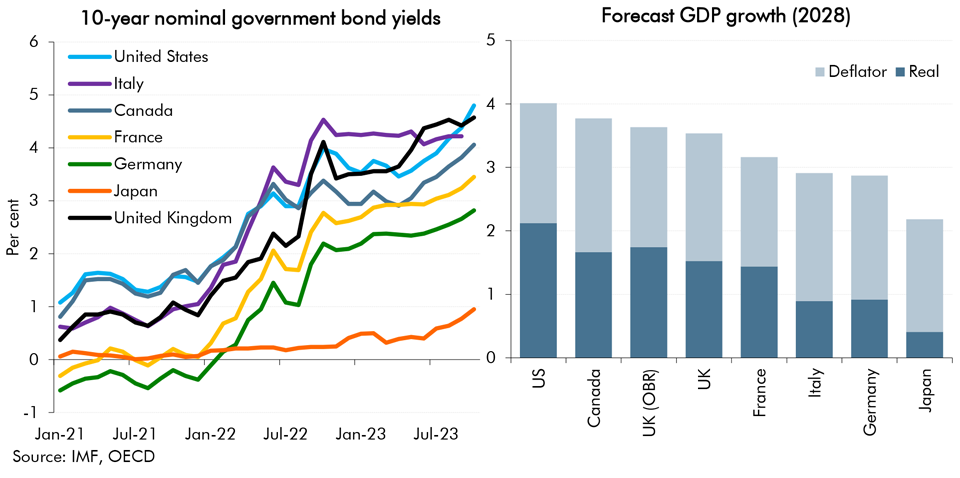
In our November 2023 forecast, alongside higher interest rates, we revised down our estimates for medium term growth. This box explored the challenging fiscal implications of the deterioration in the UK's growth-corrected interest rate, with comparison to other G7 economies.
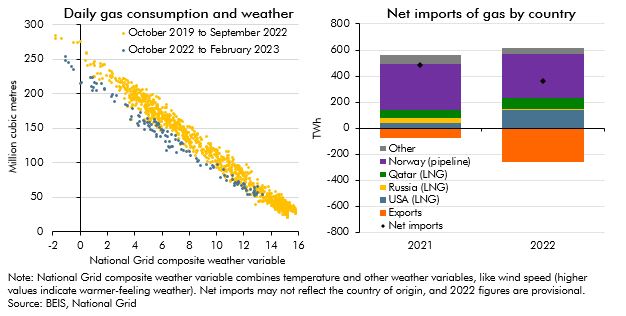
In response to the largest rise in energy prices in around 50 years, an immediate reduction in energy demand, and more gradual change in the composition of energy supply, might be expected. In this box we look at how the sharp rise in the household price of gas has changed households consumption of gas this winter as well as how the Russian invasion of Ukraine and the rise in wholesale gas prices has changed the UK's energy supply over the last year and how it may change further in the future. We then briefly outline how we forecast gas prices and why we do so.
In each Economic and fiscal outlook we publish a box that summarises the effects of the Government’s new policy measures on our economy forecast. These include the overall effect of the package of measures and any specific effects of individual measures that we deem to be sufficiently material to have wider indirect effects on the economy. In our March 2022 Economic and fiscal outlook, we adjusted our forecast to account for the loosening of fiscal policy, including a temporary capital allowance. And, we considered the effects of policy to boost employment on our potential output forecast.
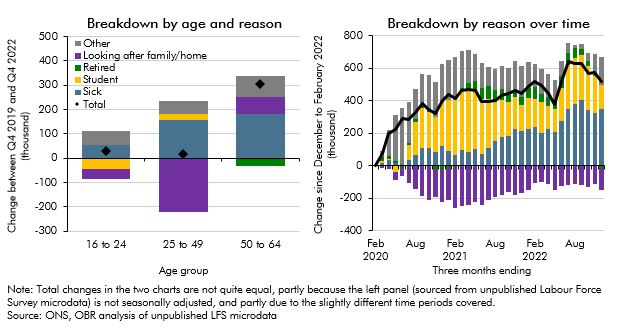
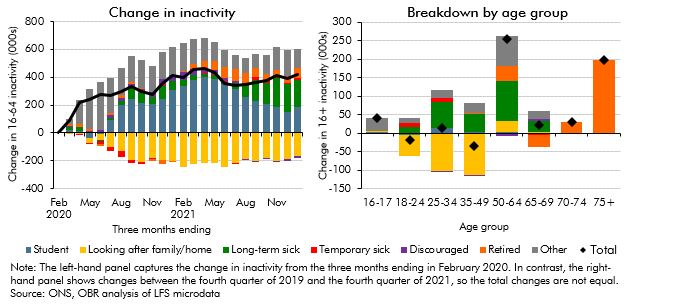
Economic inactivity rose significantly following the pandemic. This box explored the factors behind this rise, including decomposing it into different age brackets and considering the reasons behind it, as well as analysing the flows into and out of inactivity.
Since the June 2016 EU referendum, our forecasts have incorporated a set of assumptions about the economic impact of Brexit on trade, productivity, investment, and migration. In this box, we assessed our current assumptions against the latest evidence.
In the March 2023 EFO we estimated that the policy package in response to the rise in energy prices would cost £78 billion in 2022-23 and 2023-24. This box assessed how the cost of the UK Government's response compares internationally.
In our March 2023 Economic and fiscal outlook, we evaluate the impact of the freeze or reduction of various personal tax thresholds since April 2021. This box looked at the receipts generated by these measures as well as the impact on taxpayers: the number of new taxpayers these measures create and the number of taxpayers pulled into higher and additional rates.
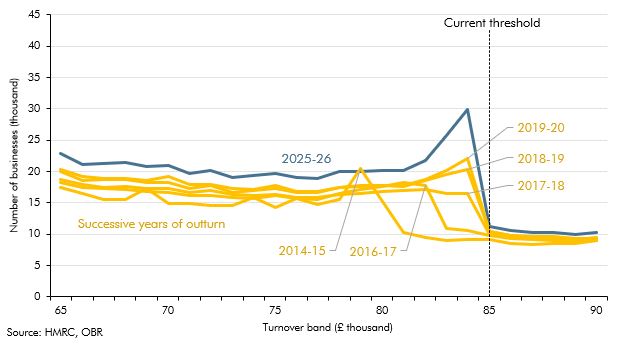
In our March 2023 Economic and fiscal outlook, we evaluate the distorting impact of the frozen VAT registration threshold – the turnover threshold at which firms must register for VAT. This box looked at the tendency for businesses to bunch just below the threshold, as they limited their turnover to avoid needing to register. At the time of the box the threshold had been frozen at £85,000, and was due to remain at that level until the end of March 2026.
In November 2021 the Government appointed administrators for Bulb Energy Limited and provided facilities to cover Bulb's financing needs. This box described how we accounted for transactions with Bulb in our March 2023 forecast.
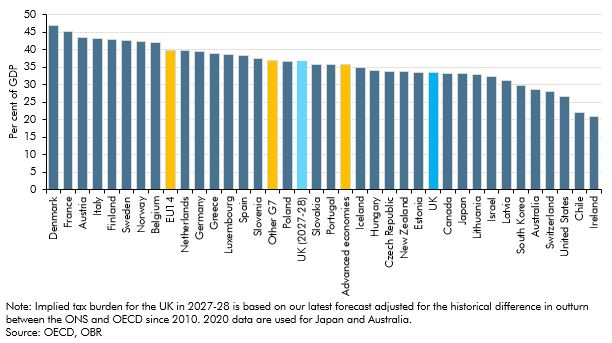
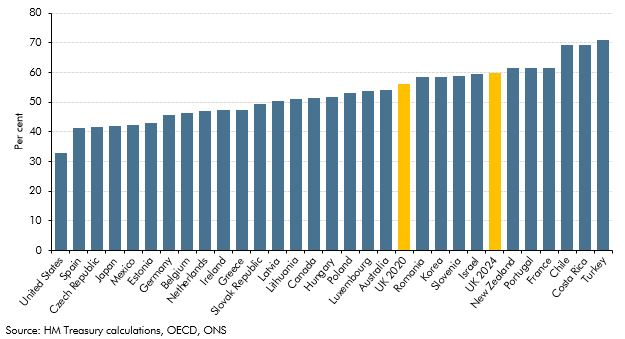
In our March 2023 Economic and fiscal outlook, we forecast that the UK's tax burden was set to rise to a post-war high. This box considered the UK's tax burden in international and historical context.
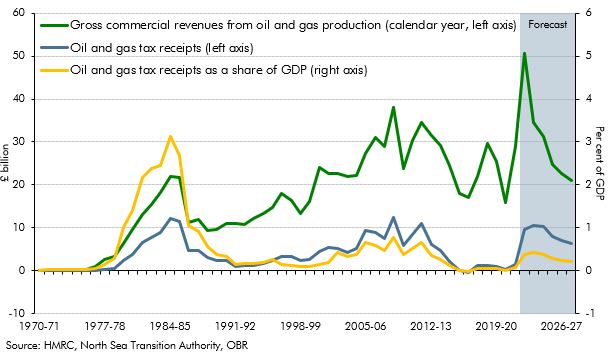
In our March 2023 Economic and fiscal outlook, we forecast that North Sea oil and gas receipts would rise sharply in the near-term to close to their all-time high in cash terms. This box explored the evolution of receipts since the discovery of North Sea oil and gas.
The Bank of England's Asset Purchase Facility (APF) conducts the Bank's operations for quantitative easing and tightening. Following sharp rises in interest rates in 2022 the APF has started to make large cash losses. This box looked at the causes of those losses and how they feed through to fiscal aggregates.
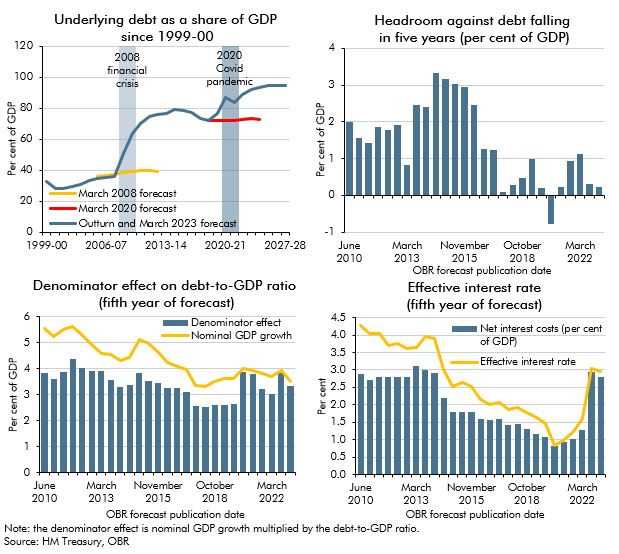
Since the financial crisis successive Chancellors have aimed to reduce debt as a share of GDP. This box looked at why that goal had proved difficult to achieve and in particular the challenges in our most recent forecasts.
In each Economic and fiscal outlook we publish a box that summarises the effects of the Government’s new policy measures on our economy forecast. These include the overall effect of the package of measures and any specific effects of individual measures that we deem to be sufficiently material to have wider indirect effects on the economy. In our November 2022 Economic and fiscal outlook, we adjusted our economy forecast to take into account plans for the energy price guarantee (EPG) and consider the impact of tax and spending measures on the supply side of the economy.
In 2022-23 and 2023-24, living standards are set for the largest fall on record. This box set out our forecast for real household income, the impact of government policy in buffering the income shock, and its implications for our consumption forecast.
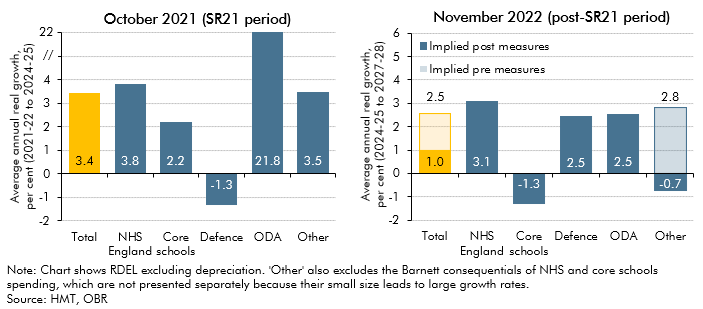
In November 2022 the government reduced its departmental (DEL) spending assumptions for the final three years of the forecast period. This box discussed the implications of the government's day-to-day and capital spending plans for various departments and public services during and after the 2021 Spending Review.
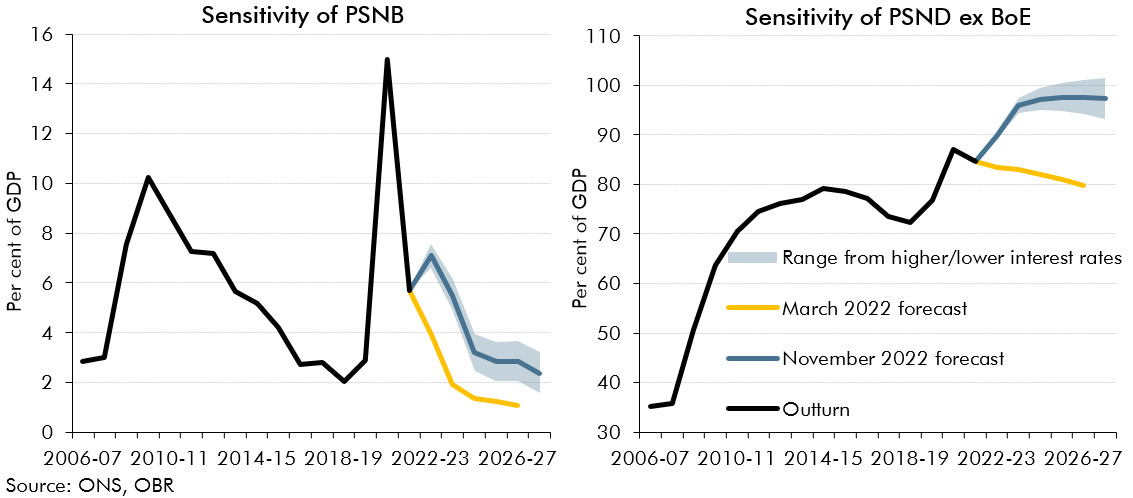
In 2022-23 we have seen sharp rises in gas prices and interest rates, both of which are forecast to remain elevated in 2023-24. This box presented the potential fiscal impacts of a higher-than forecast path for gas prices and two scenarios where Bank Rate is either a percentage point higher or lower than in our central forecast.
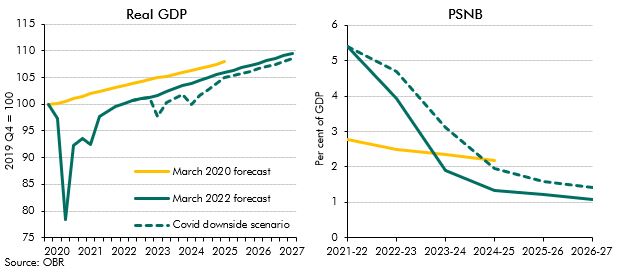
The possibility of a new vaccine-escaping Coronavirus variant cannot be ruled out. In this box we explored the possibility of such an escape and investigated the potential economic and fiscal consequences.
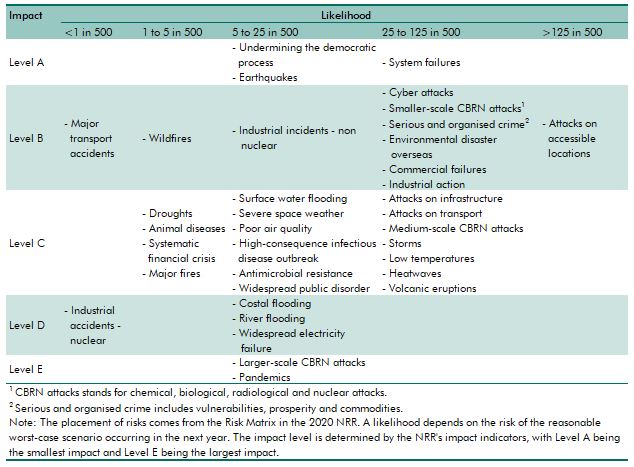
The National Risk Register (NRR) provides the Government's assessment of the likelihood and potential impacts of a range of risks to the safety and security of the UK. In this box box we compared the topics covered by the NRR and those we have focussed on in our risk analysis.
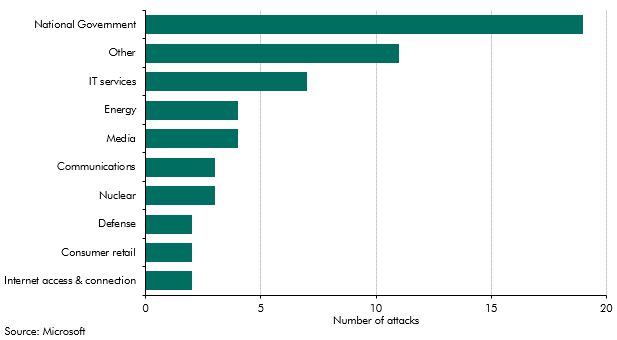
The Russian invasion of Ukraine in February 2022 led to questions over the impact that cyber attacks were likely to have during the conflict. This box looked at the history of cyber-related activity in the region, and the evidence available for cyber impacts of the conflict to date.
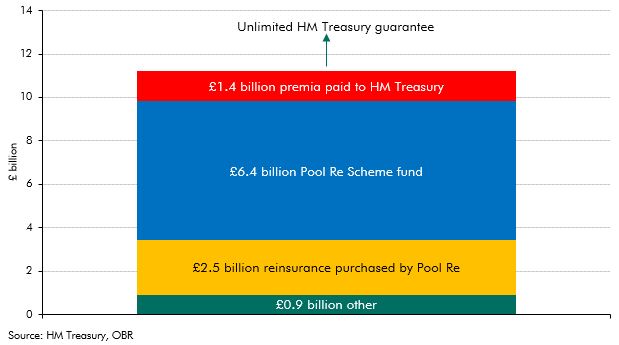
Given signs of pressure in the cyber insurance market, this box considered previous precedent of government intervention to help private insurers provide cover for large and uncertain risks. This included a detailed look at Pool Re, one of the longest running government-guaranteed reinsurance schemes, for terrorism risk.
There are signs that global economic integration has stalled in recent years on some measures and reversed on others. This box discussed the implications of integration for the economy and public finances.
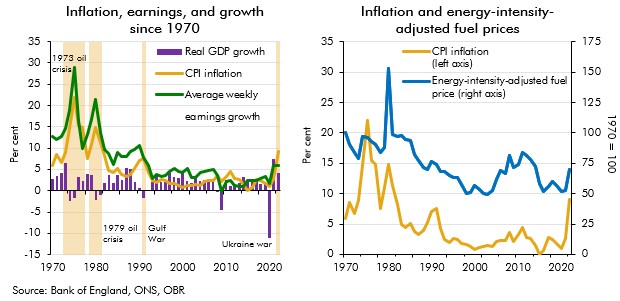
The recent surge in energy prices and its associated effects on inflation has led to comparisons with the last major global energy crisis in the 1970s. This box examined the ways in which the shocks are similar and how they are different, with a focus on how the UK economy in some ways has become more resistent to energy price shocks.
Persistently higher energy prices can reduce the supply capacity of the economy. In this box, we use a production function to estimate the impact of higher fossil fuel prices on potential output.
In May 2022, the Government announced a package of measures to support households with the cost of living. In this box, we explained how we had adjusted our March 2022 Economic and fiscal outlook forecast for these policies.
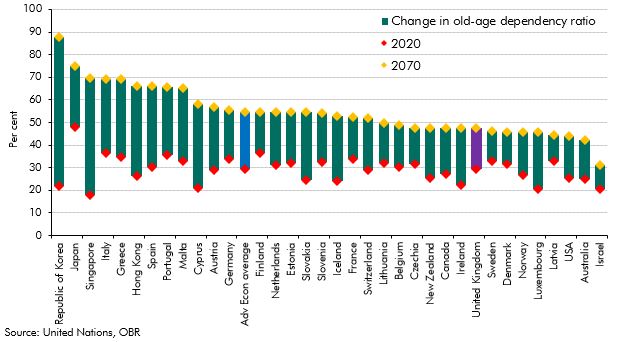
The populations of most advanced economies are ageing, placing new demands on these countries' public finances. This box explored why the UK population is forecast to age slower than most advanced economies over the next fifty years.
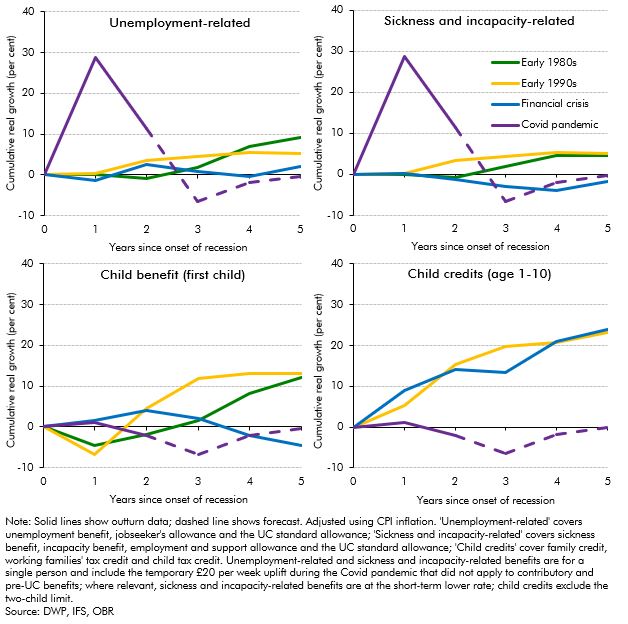
The real-terms value of benefits was forecast to fall by around 5 per cent in 2022-23 (£12 billion in total) before catching up the year after, largely due to the significant rise in inflation and the lag in benefit uprating. In this box we compared these post-pandemic uprating dynamics to the real value of non-pensioner benefit rates following the previous three recessions. This showed that the forecast trough in the real value of benefits was deeper in the wake of the pandemic than for any of the previous three recessions.
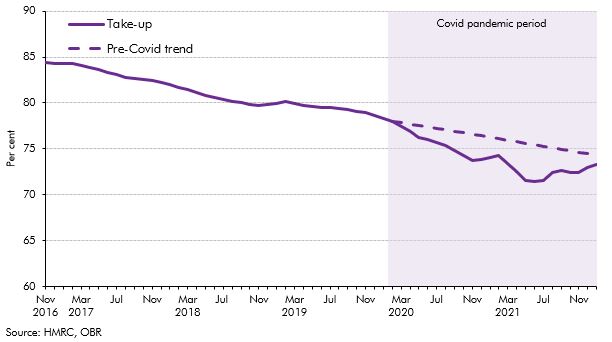
Take-up of child benefit had been declining since 2012-13, but this downwards trend accelerated at the onset of the Covid pandemic in March 2020, which resulted in a steep decline in take-up over the subsequent 18 months. In this box, we considered the main drivers of the child benefit caseload and the effect the pandemic had on each of them. We set out the reasons why the pandemic contributed to lower take-up, and then considered the medium-term impact of the pandemic-driven drop in take-up on our forecast.
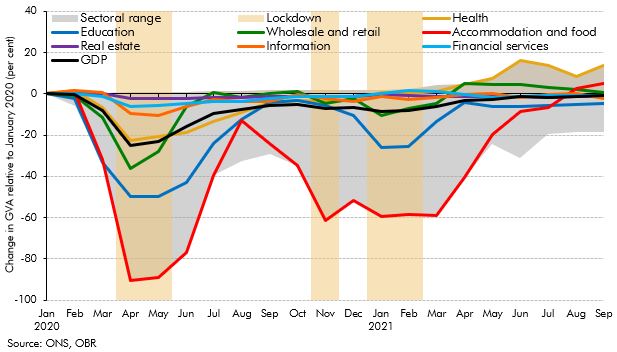
One of the unique features of the coronavirus shock was its extraordinary degree of sectoral differentiation. In this box, we explored the accuracy of our sectoral forecasts and considered the key drivers of forecast errors.
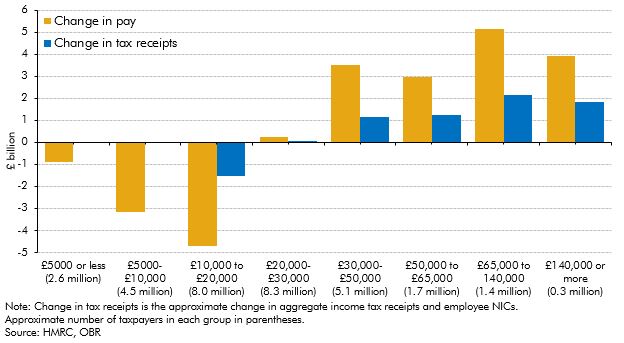
The impact of the pandemic and the national lockdowns has not been equal across the earnings distribution. While it was expected that income tax receipts would be significantly impacted, this box showed that the growth in receipts from higher earners has more than outweighed the fall in receipts from the lowest earners.

The Government introduced several tax deferral policies in response to the pandemic in an attempt to mitigate the strain on businesses. This box provided an update of the impact of those policies, and the level of tax debt still owed.
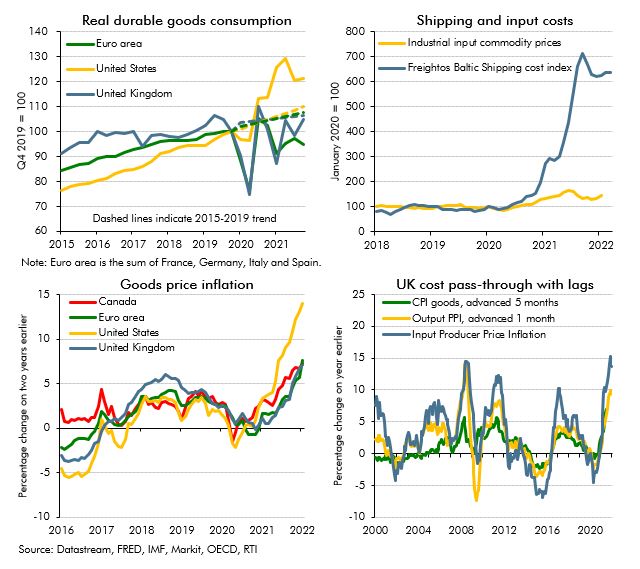
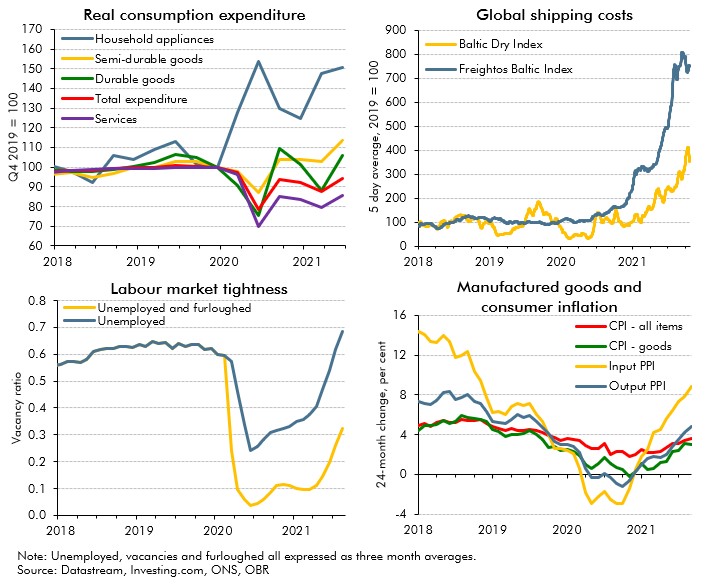
The recovery from Covid in the second half of 2021 was characterised by the emergence of imbalances between supply and demand in many markets. In this box we explored the impact of and outlook for these imbalances, or bottlenecks, in global product markets.
Russia’s invasion of Ukraine in the run-up to our March 2022 Economic and fiscal outlook represented a significant adverse shock, primarily via a sharp rise in gas and oil prices. In this box, we considered where the UK gets its energy from and the channels through which higher energy prices raise inflation. We then set out how the economic shock from the invasion had been reflected in our forecast as well as several potential channels through which the invasion could affect the UK economy that our forecast did not explicitly capture.
In each Economic and fiscal outlook we publish a box that summarises the effects of the Government’s new policy measures on our economy forecast. These include the overall effect of the package of measures and any specific effects of individual measures that we deem to be sufficiently material to have wider indirect effects on the economy. In our March 2022 Economic and fiscal outlook, we adjusted our economy forecast to take into account plans to loosen fiscal policy from 2022-23, to support households with the cost of living crisis, as well as for several specific measures, such as the cut in fuel duty and the freezing of the BBC liscence fee.
The labour market has seen mixed performance following the closure of the coronavirus job retention scheme. Low unemployment surprised to the upside whereas participation remained weaker than expected. In this box, we compared these weak participation outturns with two pre-pandemic counterfactuals, and explored the reasons why fewer people were active than we expected in previous forecasts, including by looking at the trends in different age groups. We also discussed whether we expected these trends to unwind over our forecast.
The cost of living has risen rapidly for households, with inflation reaching a 30-year high in January 2022 and the Russian invasion of Ukraine expected to increase inflation further. In this box we outlined our forecast for real household disposable incomes per person and explained that despite the Government's policy measures, 2022-23 is set to see the largest fall in living standards since ONS records began in 1956-57.
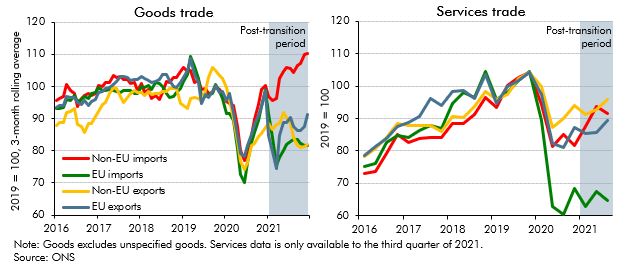
Our March 2022 EFO was published just over a year since the end of the transition period. In this box, we presented the latest evidence for the impact of Brexit on UK trade and considered the UK's recent trade performance relative to other advanced economies.
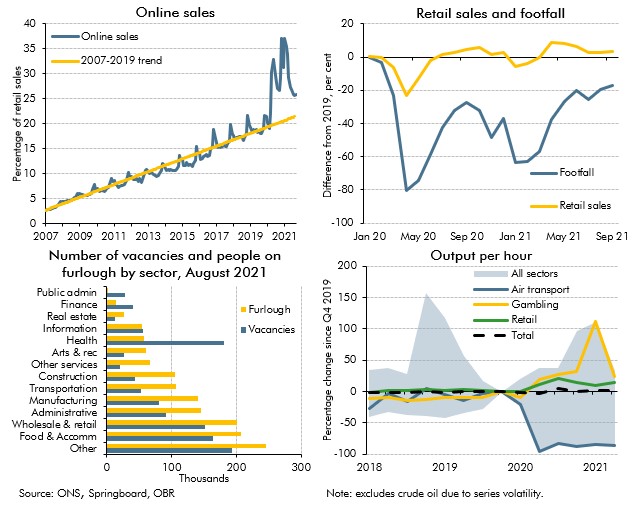
Since our October 2021 EFO the real economy has performed largely as expected in 21-22 but tax receipts have come in well above that forecast. In this box, we examined reasons why tax receipts have recovered so quickly particularly in comparison to economic data.
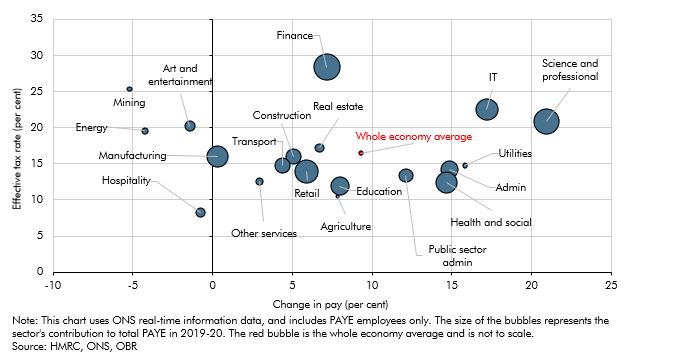
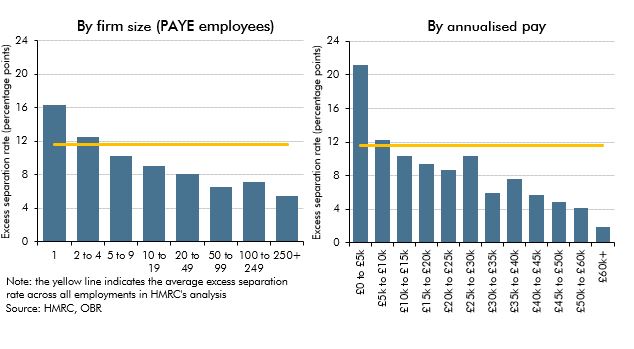
This box considered the reasons for particular strength in income tax receipts since 2019. It covered the growth in aggregate pay across the income distribution using RTI data; looked at pay growth and effective tax rate by sector since 2019; and finally at how the freeze to tax thresholds from April 2022 will compound this strength in receipts.
This box outlined the recent growth in electric vehicle sales and the fiscal implications of this and the role of policy in the transition.
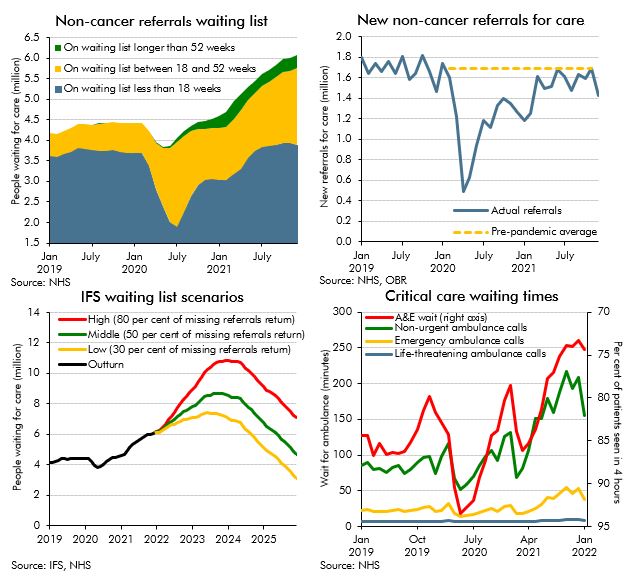
The NHS is the largest single item of public spending in the UK, and has been placed under extraordinary pressure as a result of the pandemic. Historically, some of the largest policy-related revisions have related to health spending, including the £13 billion a year announced at the 2021 Spending Review. This box explores indicators of pressure across the health service and the potential for these pressures to result in risks to our forecast.
In the final month of the coronavirus job retention scheme (September 2021), over 1 million people were still receiving payments from the scheme. In this box we explore the labour outcomes, up to January 20222, for this population after the closure of the scheme, compared to individuals in employment who were not on furlough in September 2021.
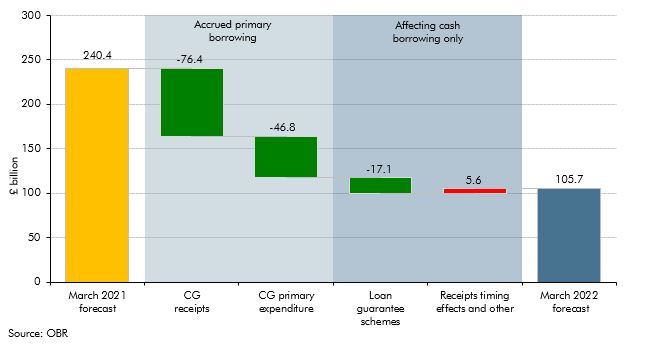
Forecasts for the government's cash borrowing in 2021-22 were revised significantly between the March 2022 and October 2021 forecast, with even larger revisions between March 2021 and March 2022. In this box we decomposed the sources of these revisions, and explained why cash borrowing outturn was much lower than forecast in March 2021, as well as why the revisions to cash borrowing were much higher than those for accrued borrowing.
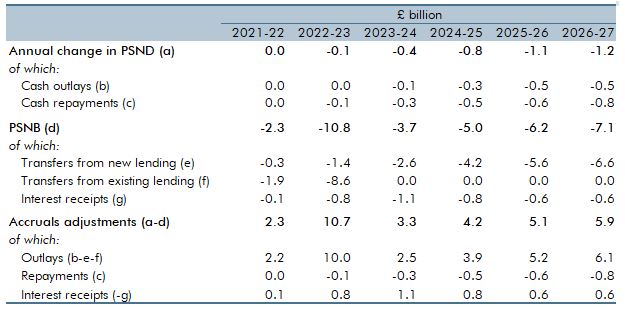
On 24 February 2022 the Government introduced a raft of changes to the working of the higher education student loans system in England. In this box we: summarised the reforms, explained their impacts on the complex accounting for student loans, and showed the overall impact on the latest forecast.
In each Economic and fiscal outlook we publish a box that summarises the effects of the Government’s new policy measures on our economy forecast. These include the overall effect of the package of measures and any specific effects of individual measures that we deem to be sufficiently material to have wider indirect effects on the economy. In our October 2021 Economic and fiscal outlook, we adjusted our economy forecast to take into account plans to loosen fiscal policy from 2022-23, as well as for several specific measures, including the impact of the HSC Levy on earnings.
Covid-19 caused dramatic changes in people's behaviour, which affected where, what and how much economic activity took place. In this box we examined the changes which appeared likely to outlast the pandemic, and the progress the economy had made in adjusting to them.
As we closed our pre-measures forecast earlier than usual at October Budget 2021, our forecast did not include the Quarterly National Accounts released on 30 September 2021, which contained Blue Book 2021 consistent revisions. This box examined the potential implications that including the latest data may have had on our forecast. We judged that the data revisions and other developments since we closed our forecast would have largely offset one another, leaving our economic forecast broadly unchanged.
In October 2021 commentators became increasingly concerned that the inability of supply to keep up with demand in specific areas of the economy would hold back the recovery. In this box we examined these 'supply bottlenecks' in energy, product and labour markets, discussing their consequences for wage and price inflation.
On 1 January 2021 some, but not all, of the provisions of the Trade and Cooperation Agreement came into effect following the UK's departure from the EU. In this box we looked at the initial impact of the new regime on UK trade patterns. We also considered whether the data was consistent with our assumption that Brexit will eventually reduce UK imports and exports by 15 per cent.
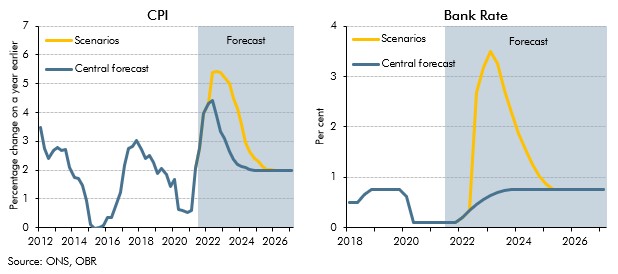
Inflation risks intensified after we closed our pre-measures forecast for the October 2021 Budget. This box showed two stylised scenarios embodying higher and more persistent inflation than in our central forecast to highlight the uncertainty surrounding the outlook. In one scenario inflation was driven mainly by pressures in the product market, and the other mainly pressures in the labour market, which had different implications for wages and consumption.

The pandemic generated only modest structural damage to the fiscal position but did still create a gap in what the Chancellor considered a sustainable fiscal position. This box compared the scale of fiscal consolidation facing the chancellor and his approach to repairing the public finances with the challenge that faced Chancellor George Osborne after the financial crisis.
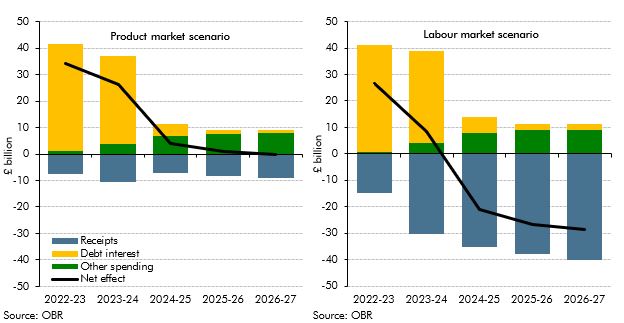
The level and nature of inflation has consequences for the public finances. This box explored the fiscal consequences of the sharp rise in inflation since our March 2021 forecast and examined the fiscal effects of the two scenarios described in Box 2.6 in our October 2021 EFO one where inflation is driven mainly by pressures in the product market, and the other mainly pressures in the labour market. The box concluded the labour market inflation scenario was significantly more beneficial for the public finances.
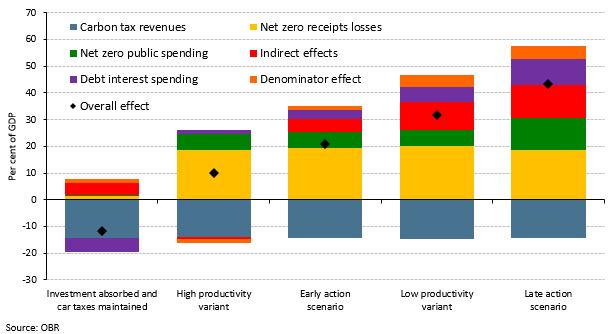
Our 2021 Fiscal risks report explored the fiscal risks posed by climate change and the Government’s commitment to reduce the UK’s net carbon emissions to zero by 2050. This box examined the policies announced in the Budget, Spending Review, and Net Zero Strategy in October 2021, and the significant rises in market prices for hydrocarbons since we completed our Fiscal risks report, and how they had changed the risks associated with climate change and decarbonisation.
Our pre-measures fiscal forecast was closed earlier than usual to give the Chancellor a stable base to make decisions for the Budget and Spending Review. This box described the impact of news since the forecast closed on headroom to the Government's fiscal targets.
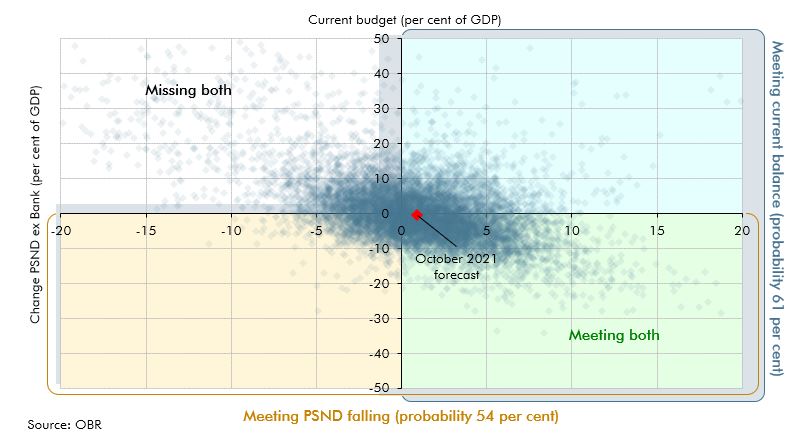
We illustrate the uncertainty around our forecasts using a variety of approaches. This box described using stochastic simulations to produce fan charts, which could be used to enhance presentation of uncertainty in future EFOs, and showed some experimental results.
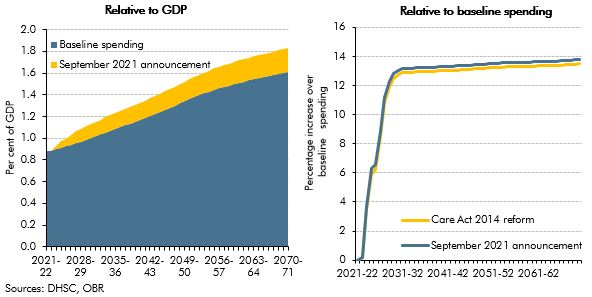
On 7 September 2021, the government announced a reform to the funding of adult social care in England. In this box, we described how this reform compares with the 2011 Dilnot Commission proposals and the reforms from the Care Act 2014 that were planned for April 2016 and then abandoned.

Fiscal space is an important consideration for how quickly and effectively a country's government can respond to a large shock. In this box, we explored different definitions of fiscal space over time, its multi-faceted nature and how the UK's position has evolved over the course of the coronavirus pandemic.
The Government announced in March 2021 that the coronavirus job retention scheme (CJRS) would be phased out completely by the end of September 2021. In this box, we looked at the latest evidence on the number of people on the scheme and their concentration in certain industries, as well as the latest data on vacancy rates. We also discussed how these data related to our labour market assumptions from March 2021.
Broader measures of the balance sheet are useful to consider when thinking about fiscal sustainability. However, under the national accounts framework even the broadest measures fail to recognise natural assets – the very assets affected by climate change. The box discussed the frameworks under which the ONS produces the environmental and natural capital accounts, and which bodies are working to address the gaps in these frameworks. The box also discussed key messages from the Dasgupta Review and Treasury’s response.
With the sale of new petrol and diesel cars to be banned from 2030, the transition to electric vehicles is a key element in the UK’s path to net zero emissions. This box outlined the recent growth in alternatively fuelled vehicle sales, the fiscal implications of this and the role of policy in the transition.
One of the greatest challenges in achieving net zero in terms of both cost and technical difficulty will be to decarbonise the more than 28 million homes in the UK that rely on fossil fuels for heating (typically gas central heating) and are, for the most part, poorly insulated. In this box we examined the similarities and differences between the future transition of domestic heating and one of the past, that of the switch to natural gas over the decade to 1977.
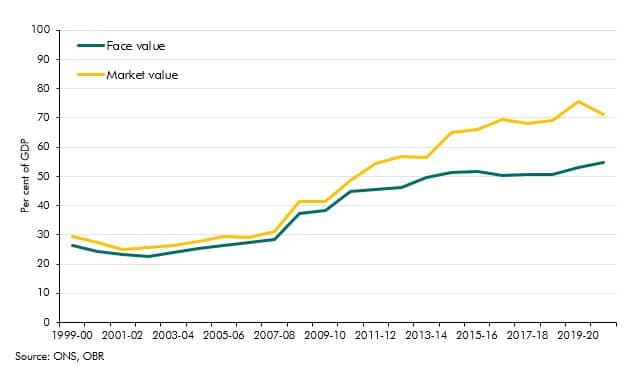
Government debt liabilities can be valued in various ways. In recent years market and face values have diverged sharply reaching 15% of GDP. In this box we explained why this has happened and why we use face value in our analysis.
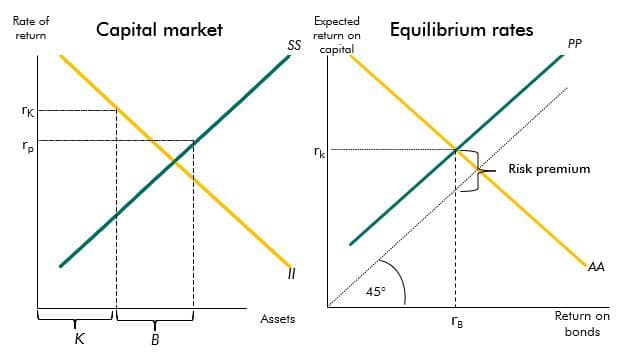
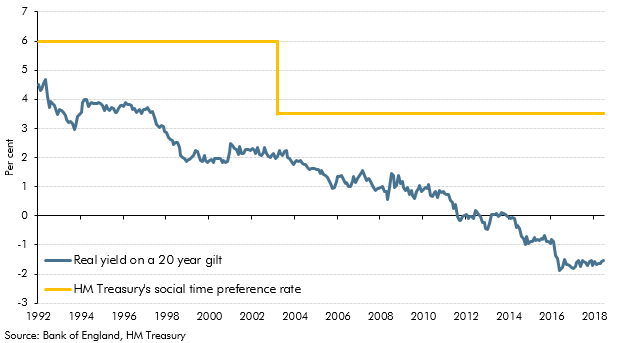
The yields on government debt have declined over recent decades. This box described a stylised model that provides a framework to explain the drivers of these changes.
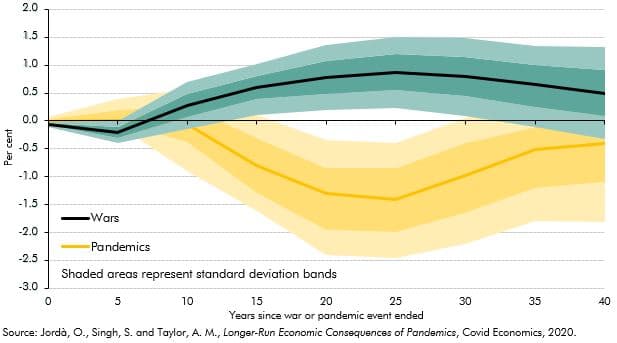
Past pandemics have had long-run impacts on real interest rates. A recent paper found that 20 years after a pandemic real rates fell by, on average, 1.5 percentage points (though less in the UK). This box examined the evidence for the current pandemic and suggested why this time it may be different.
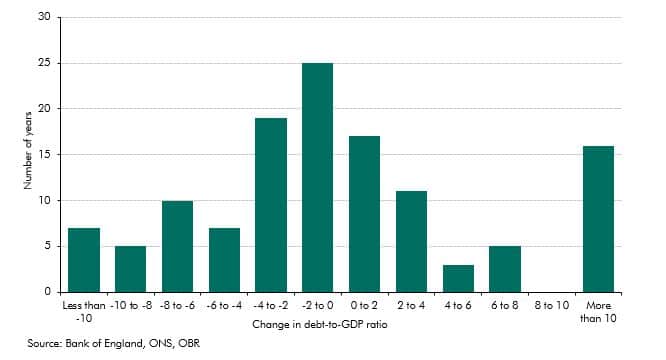
The history of UK government debt can be characterised as one of ‘punctuated equilibria’ in which long periods where the debt-to-GDP ratio is broadly stable or gradually falling are interspersed with occasional large increases in response to major shocks. This box looked at the instances of parge rises since 1900 and the long period of debt reduction after the second world war.
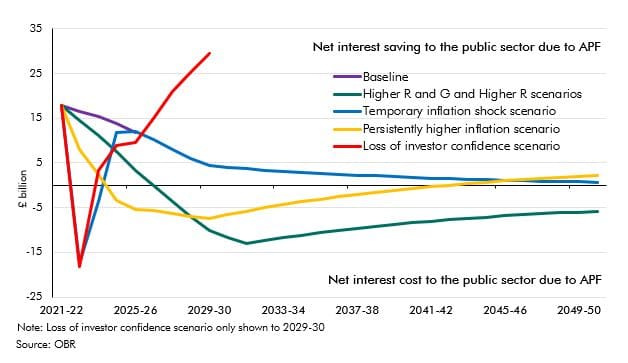
The Asset Purchase Facility (APF) houses the assets purchased by the Bank of England as part of its programme of quantitative easing. This box explained how this lowered interest rates benefitting the Treasury by £113 billion to date but it also increased the sensitivity of interest payments to future rate rises. The box showed how the cash flows to and from the APF change under various scenarios.

Cyberattacks are a growing global threat that, at the time of writing, had yet to cause sufficient disruption to national infrastructures to generate material economic and fiscal harm. We had not yet quantified the potential fiscal cost from cyberattacks, but included it in our Fiscal risk register for the first time. The box covered some of the potential types of cyberattack, their increasing prevalence and the mechanisms through which they might generate direct and indirect fiscal costs.
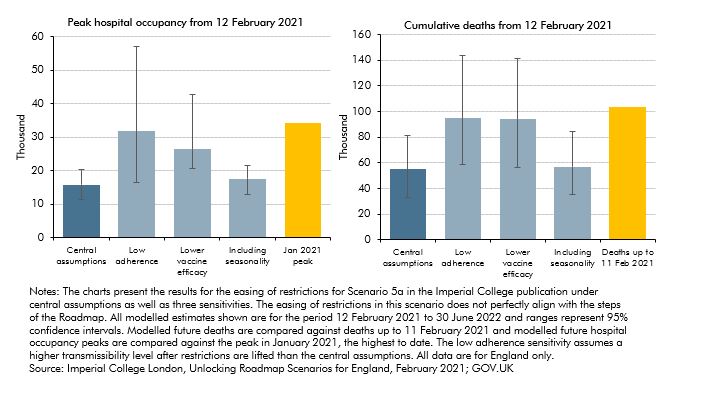
The path of the pandemic and the associated public health restrictions will be the most important near-term determinants of the UK’s economic and fiscal performance. Our March 2021 central forecast was conditioned on the Government’s ‘Roadmap’ for the lifting of restrictions and despite encouraging news regarding vaccines, there remains considerable uncertainty surrounding the future path of the pandemic and the economy. This box considered the uncertainties around key epidemiological assumptions on how the pandemic will unfold.
On 24 December, four and a half years after the EU referendum, the UK and the European Union concluded the Trade and Cooperation Agreement (TCA). This box compared the provisions of the TCA against our previous broad-brush assumption that UK-EU trade would take place under the terms of a ‘typical’ free-trade agreement. It also discusses the initial evidence regarding its short-term impact.
In each Economic and fiscal outlook we publish a box that summarises the effects of the Government’s new policy measures on our economy forecast. These include the overall effect of the package of measures and any specific effects of individual measures that we deem to be sufficiently material to have wider indirect effects on the economy. In our March 2021 Economic and fiscal outlook, we adjusted our economy forecast to take into account plans to loosen fiscal policy in 2021-22, before tightening from 2023-24 onwards, as well as for several specific measures, including the impact on our business investment forecast of temporarily much more generous capital allowances.
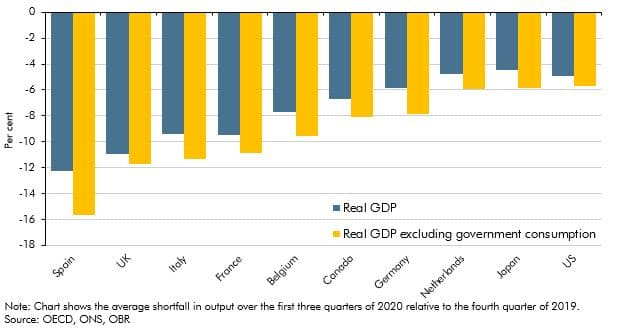
The coronavirus pandemic has affected economies of all countries around the world as a result of public health measures and voluntary social distancing. In this box we assessed how the UK had fared relative to other major advanced economics by examining the effect of using different measures of government output, the composition of these economies and the severity of the virus.
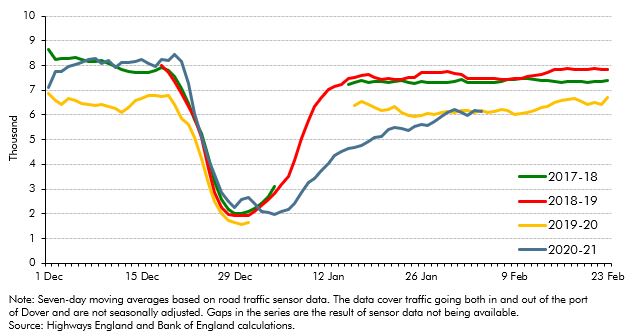
Output held up better in November 2020 than we had expected at the time of our November 2020 forecast. In light of this, this box considered whether the economy had become increasingly adapted to operating under lockdowns and other public health restrictions since the onset of the pandemic, and the implications that this might have had for the economy during the January 2021 lockdown.
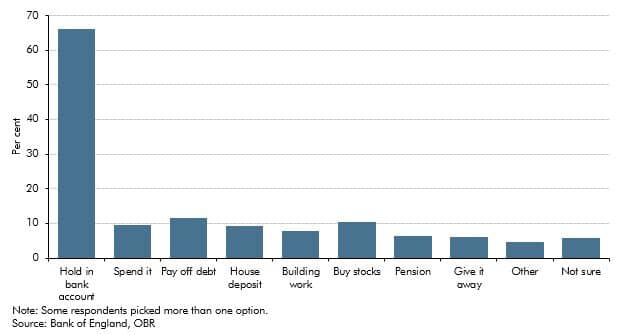
This box explored how the pandemic and associated policy response changed the flow of funds between the different sectors of the UK economy. It then considered the implications of how those flows unwind for the pace and sustainability of the recovery.
In the March 2021 EFO we estimated that policy measures responding to the coronavirus pandemic would add £344 billion to borrowing, with these policies announced across a number of statements beginning alongside the March Budget. This box updated on our estimate of this cost from November and the relative shares of support going to households, businesses and for public spending.
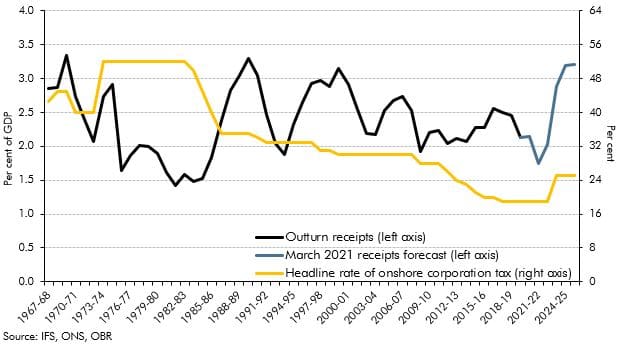
The rise in the main rate of corporation tax (CT) announced at Budget 2021, from 19% to 25% – from 2023-24, marks the first rise in the main rate of onshore CT since 1974. This box put this policy change in its historical and international context, by looking at onshore CT receipts as a share of GDP within the UK since its inception in 1965, and by looking at other corporate tax rates across OECD countries.
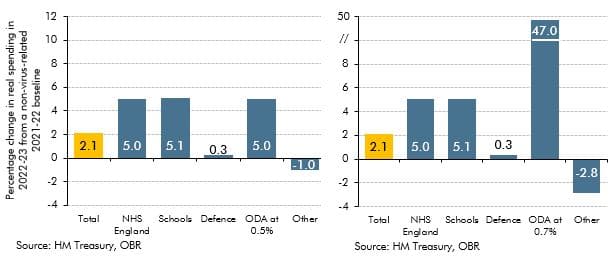
This box discussed the risks to our medium-term forecast of day-to-day departmental (RDEL) spending, particularly in relation to the impact of the pandemic.
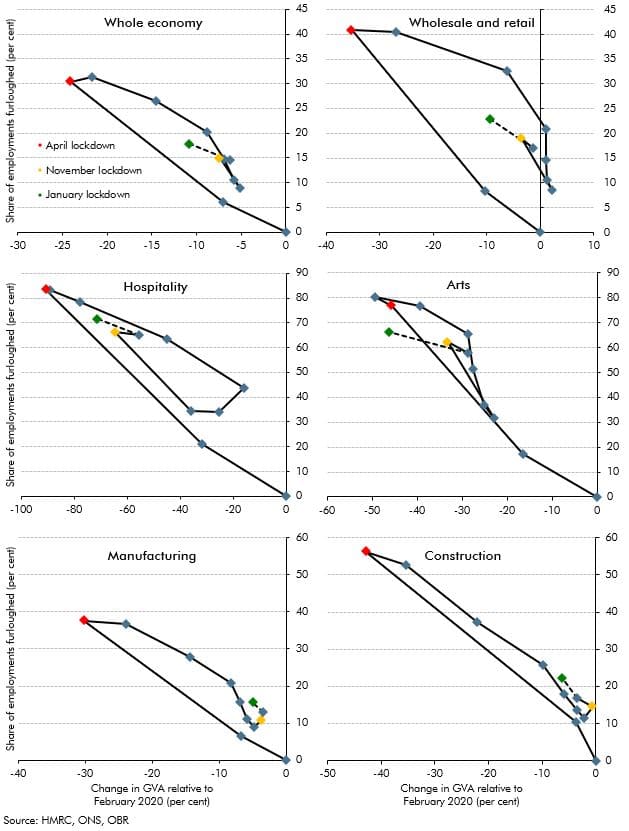
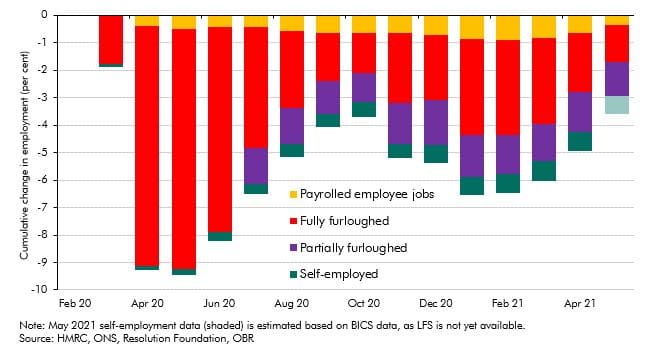
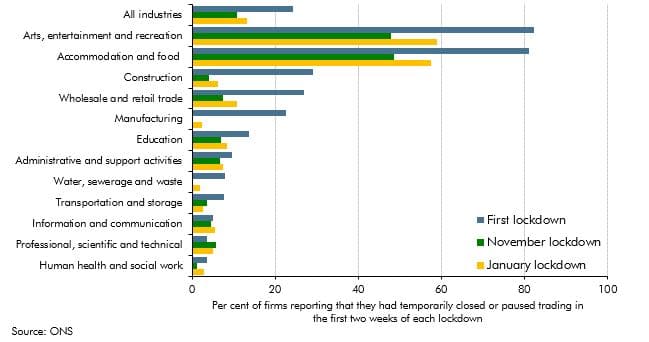
In this box, we discussed how the hospitality, wholesale and retail, arts, manufacturing and construction sectors, as well as the economy as a whole, adapted the usage of the furlough scheme in relation to output, and commented on the increased level of employees on furlough relative to the loss in output in the November 2020 and January 2021 lockdowns when compared with the April 2020 lockdown.
On 4 February 2021 the Government published its response to the December 2018 Court of Appeal ruling that the transitional protection arrangements in place across public service pension schemes based on years from retirement constituted a form of unlawful discrimination on the basis of age, commonly known as the ‘McCloud-Sargeant case’. This box explored the potential fiscal impacts of the Government’s remedy, as it was not possible to reflect the costs directly in our March 2021 EFO due to remaining uncertainty around the schemes’ implementation of the response.
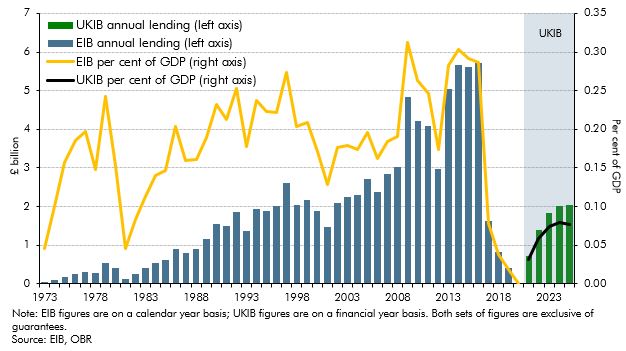
The Government announced the establishment of a new UK Infrastructure Bank (UKIB) at Budget 2021 to tackle climate change and support regional and local economic growth. It does this in part by replacing some of the activity of the European Investment Bank (EIB). This box looked at how UKIB will operate and how this compares to the EIB, as well as briefly exploring potential fiscal and classification risks.
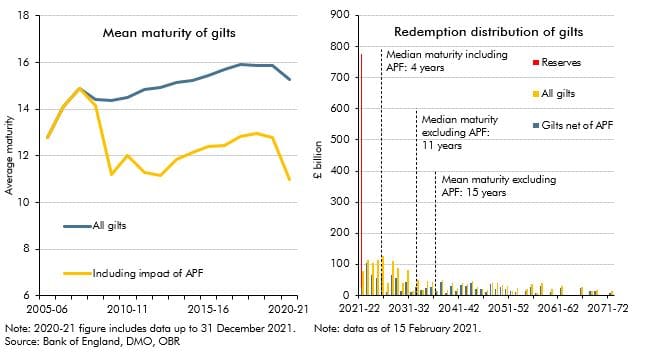
The average maturity of UK government bonds is longer than the average maturity of government debt in most other advanced economies. But the average maturity of the net debt of the public sector as a whole (including the Bank of England) has shortened considerably since the global financial crisis. In this box, we explored how the Bank of England's quantitative easing operations have shortened the maturity of public sector net debt, dramatically increasing the sensitivity of debt interest spending to changes in short-term interest rates.
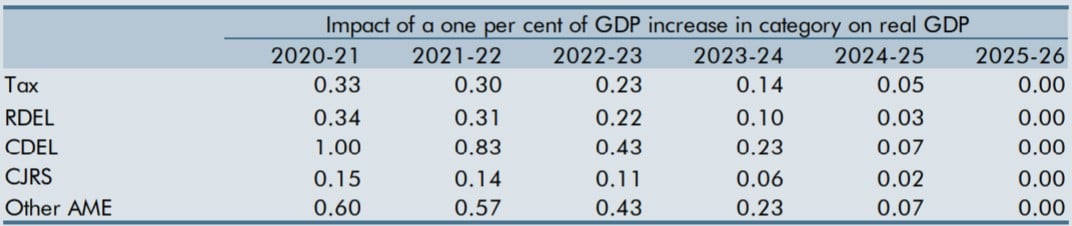
The unusual nature and size of the prevailing economic shock, and the Government’s fiscal response, raised the question of whether our usual fiscal multipliers were appropriate at the time. This box set out competing arguments for the multipliers being larger or smaller than those we usually employ and concluded that we would leave them largely unchanged.
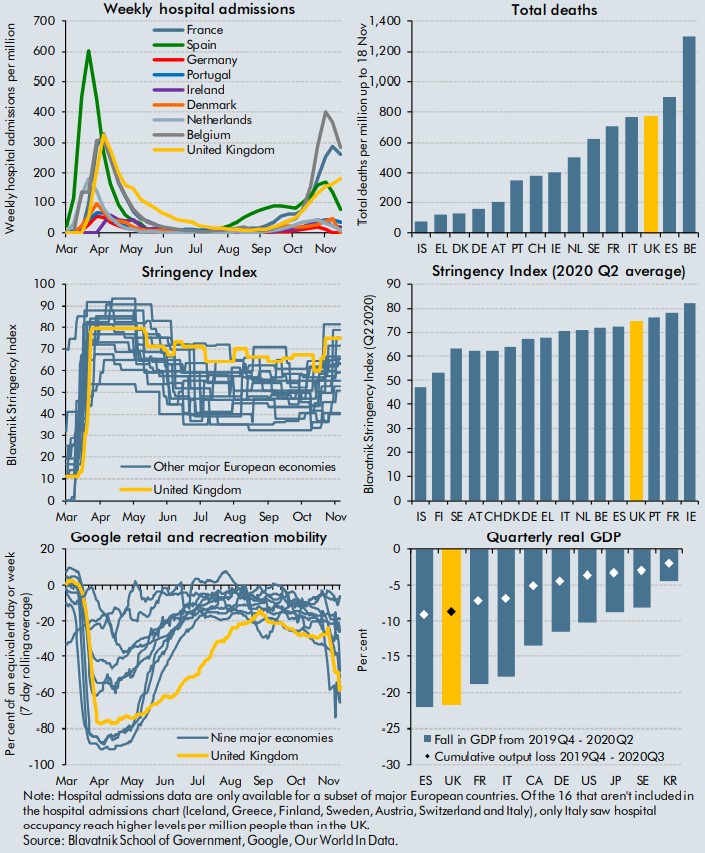
The coronavirus pandemic has forced governments around the World to introduce measures to curtail both the health, and economic impacts of the virus. This box aimed to compare the impacts on health and the economy of the virus with those of other selected countries, alongside the stringency of measures introduced by their respective governments.
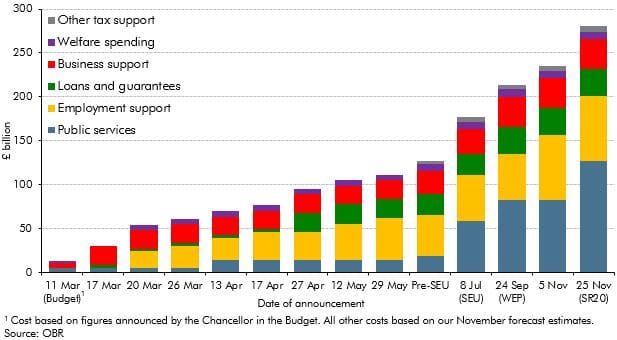
In the November 2020 EFO we estimated that policy measures responding to the coronavirus pandemic would add £280 billion to borrowing in 2020-21, with these policies announced across a number of statements beginning alongside the March Budget. This box considered the main statements contributing to this cost and the nature of the support included in these announcements.
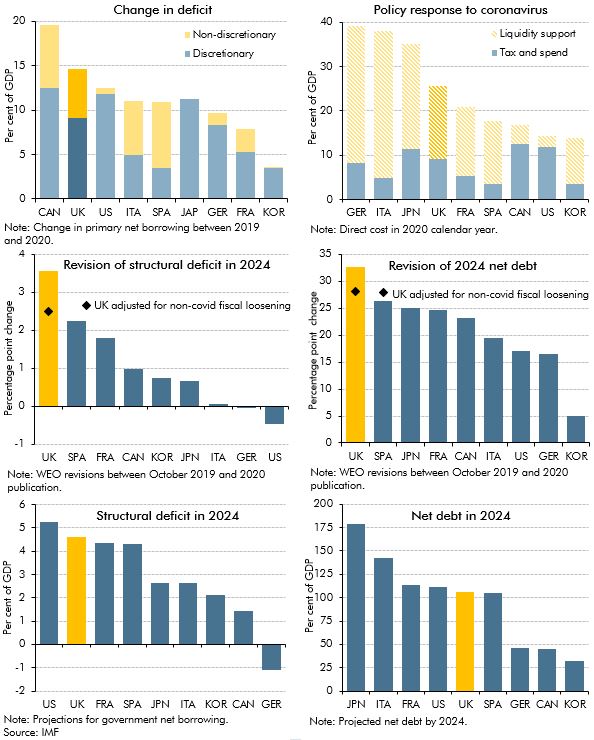
The pandemic has undoubtedly had a negative impact on public finances of countries around the world, but questions remain regarding the impact on the immediate and long-term fiscal positions of the UK relative to other major advanced economies. In this box, we considered the immediate term impact on primary deficits and the extent to which this reflected discretionary policy packages; the size of discretionary policy packages and the use of direct tax and spending policy versus liquidity support; and the impacts in the longer term on structural deficits and debt, including revisions between the IMF’s October 2019 and October 2020 WEO.
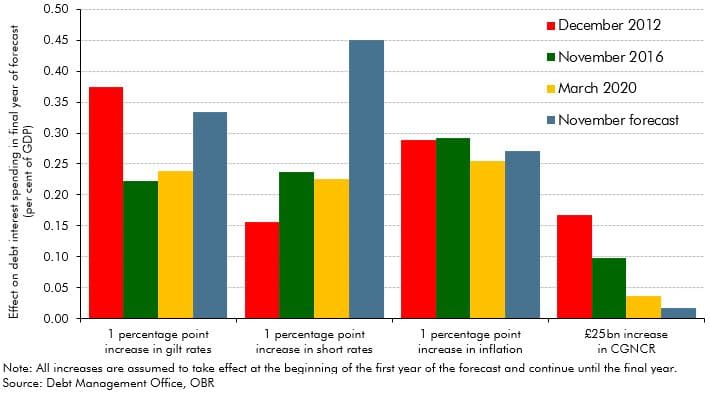
Despite debt rising as a share of GDP to a new post-war peak in our November 2020 forecast, government spending on debt interest was expected to fall to a new historic low as a share of total government revenue. This box explored how this had left the public finances more sensitive to future changes in the cost of servicing this higher debt burden.
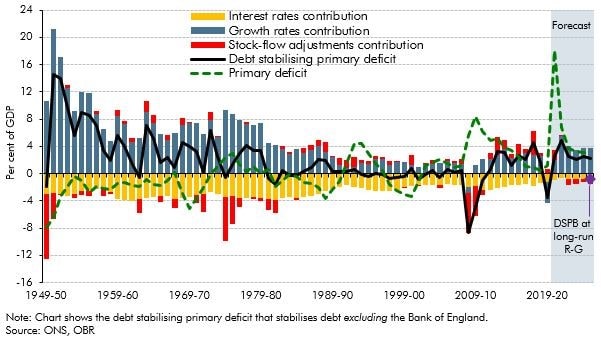
The debt-stabilising primary deficit depends on the level of debt, nominal growth rates, the effective nominal interest rate, and any 'stock-flow adjustments'. This box discussed the historical evolution of the debt stabilising primary balance, and also explained why it may appear to be ‘easier’ to stabilise debt the higher it rises, and the fiscal risks that such an interpretation entails.
On 8 July, the Chancellor announced further measures to support the economy as the lockdown is eased, which we were not notified of in sufficient time to incorporate into our scenarios. This box described the measures included in the package and the costs as estimated by the Treasury.
So far during the lockdown period, many businesses are struggling to meet their usual tax payment schedules and are seeking instead to delay those payments. In this box we considered the channels through which this might impact tax receipts and set out the key uncertainties in our medium-term scenario assumptions.
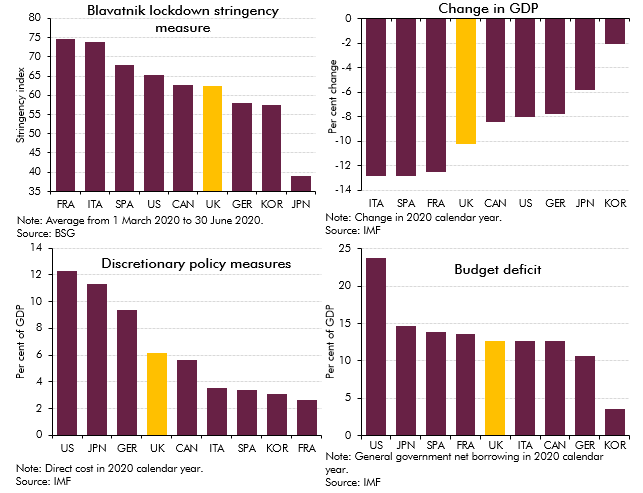
The coronavirus pandemic has hit the economic and public finances of all countries around the world as a result of lockdown measures imposed to control the outbreak and fiscal support provided to aid individuals and businesses. In this box we assessed how the UK had fared relative to other major advanced economics by looking at pandemic-related indicators and forecasts.
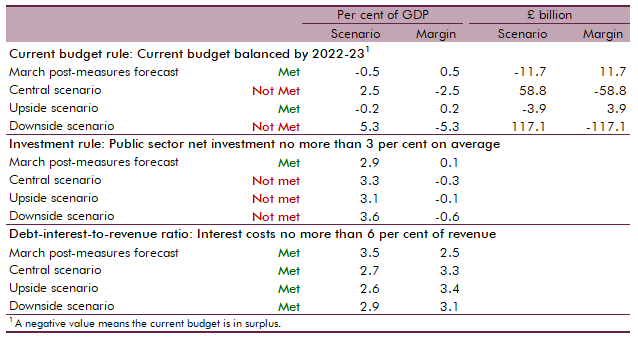
At Budget 2020 we assessed the Government's performance against the three proposed fiscal rules that featured in the Conservative Party's 2019 election manifesto. In this box we assessed whether the Government could meet these fiscal rules under our central, upside and downside scenarios.
On 31 January 2020, the UK left the EU and the transition period was set to finish at the end of 2020. This box set out our estimate of the effect of the EU referendum result on productivity to date. It also outlined the effect that leaving the EU and trading under the terms of a typical free trade agreement - which we assumed in this forecast - will have on productivity in the long run.
In each Economic and fiscal outlook we publish a box that summarises the effects of the Government’s new policy measures on our economy forecast. These include the overall effect of the package of measures and any specific effects of individual measures that we deem to be sufficiently material to have wider indirect effects on the economy. In our March 2020 Economic and fiscal outlook, we adjusted our economy forecast to account for the material increase in departmental spending and tax policy changes on GDP and inflation. In addition to this, our business investment forecast incorporates the reversal of the planned cut in corporation tax, increases in the structures and buildings allowance and R&D tax credits.
After we closed our March 2020 pre-measures forecast, it became clear that the spread of coronavirus would be far wider than assumed in our central forecast. This box described the effect we incorporated into the central forecast and explored the potential impacts the virus could have on the economy and public finances.
The Government announced plans for a new 'points based' immigration system set to come into place in 2021 that will align migration policy for EU and non-EU migrants. In this box, we considered the impacts of this new system on the outlook for potential output growth.
In March 2020, the Government introduced a new target for the National Living Wage (NLW) to reach two-thirds of median earnings (of the relevant population) by 2024, providing economic conditions allow. In this box we considered the effect of this policy change on the outlook for the economy and the public finances.
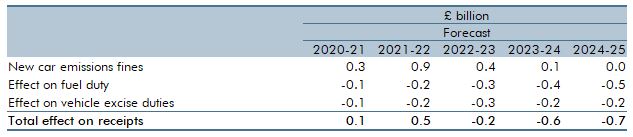
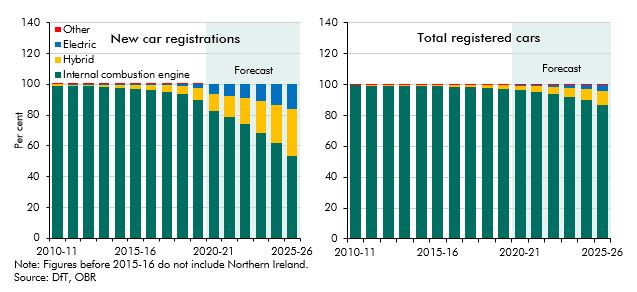
In April 2019, the European Parliament and Council adopted new regulations to set mandatory emissions targets for new cars. Ahead of our March 2020 EFO, the Government told us that all of these provisions transferred into UK law on 31 January 2020 under the terms of the EU Withdrawal Act. In this box we considered the effect of this change on the UK public finances.

The Government announced significant increases in departmental expenditure limits for capital spending. In this box we compared previous capital spending plans with outturn and our own capital underspend assumptions.
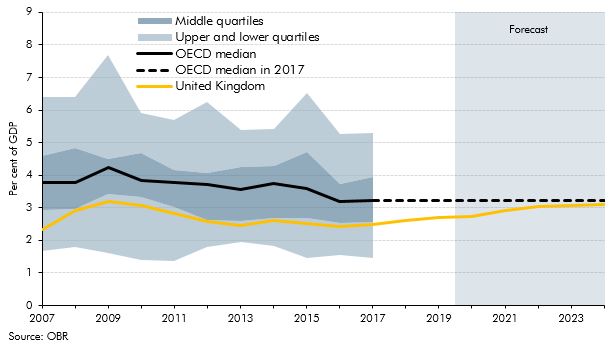
The Government committed to a significant boost to the path of capital spending. This box explored how UK government investment as a share of GDP has compared to other OECD countries and how our March 2020 forecast affects this picture.
The transition to universal credit (UC) from legacy systems is a key component of our welfare spending forecast, as UC spending will represent 27% of total welfare spending by 2024-25. As detailed in our 2018 Welfare Trends report (WTR), we construct UC spending by forecasting the legacy system as though UC did not exist and then incorporate an estimate of the marginal cost of UC. This allows us to base as much of the forecast on as much administrative data as possible, but it does not directly reflect the real-world change in spending on legacy benefits as spending on UC rises. This approach is unavoidable at present but generates inevitable difficulties for our forecast. This box explored the challenges associated with this approach.
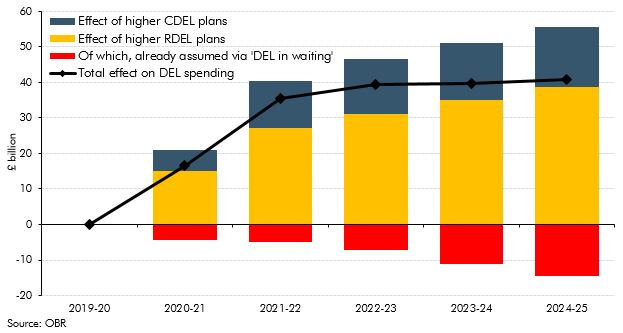
The UK’s exit from the EU presented fiscal savings to the Government in the form of transfers to EU institutions that featured in spending and retained customs duties. We assumed these would be fully recycled into substitute UK spending in previous forecasts. This box explained how we treated these flows as ‘DEL in waiting’ and how this related to the large increases in departmental spending.
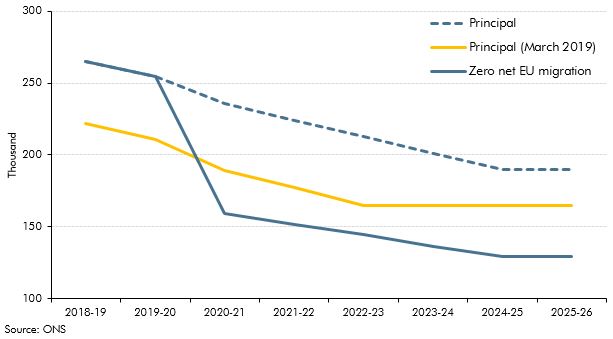
In February 2020, the Government announced its intention to introduce a ‘points-based’ migration system from January 2021 that will align migration policy for EU and non-EU migrants. In this box we looked at the effect of the new migration regime on our borrowing forecast.

The Government used new fiscal rules to guide the policy decisions at this Budget. This box discussed the composition of two of these rules which had not previously been used in the UK.
Between our 2017 FRR and our 2019 FRR the Government undertook a number of initiatives to deepen its risk management. This box summarised these changes.
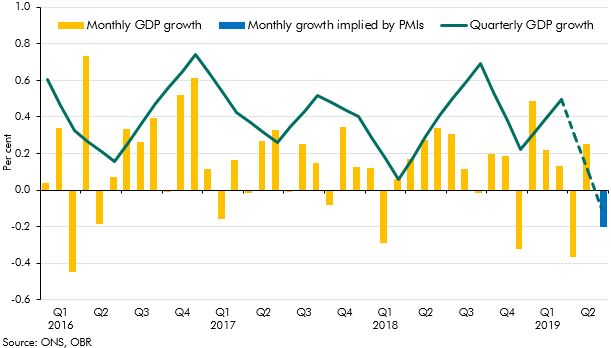
Monthly output data and the PMIs weakened in the second quarter of 2019, leading some commentators to suggest GDP would fall. This box considered what was behind the weaker data and whether it would persist into the third quarter, leading to a technical recession.
In June 2019 the BBC announced its decision to begin means-testing eligibility for Free TV licences for those aged 75 and over, based on households containing someone aged 75 or over and also claiming pension credit. This box explores the impact the BBC’s policy could have on pension credit take-up and welfare spending.
In recent years, local authorities have increased their 'prudential' borrowing to take advantage of the low interest rates offered by the Public Loans Work Board. In this box we discussed the example of Spelthorne Borough Council, looking at some of its riskier investments in commercial property and how those may pose a risk to the public finances in the event of an economic downturn.
Where the Government uses off-balance sheet financing to deliver public services this results in a 'fiscal illusion', where the recorded measures of debt and deficit do not reflect economic reality. In this box we looked at the case of housing associations (HAs). These came onto the balance sheet after the Government was given significant controls over them. The Government then legislated just enough to move HAs off-balance sheet. Neither movement made any fundamental change to fiscal sustainability.
The accounting treatment for student loans changed dramatically in 2019 adding more than £10 billion to the deficit. This box summarised the history of this change and a review into the design of post-18 education financing.
By issuing gilts linked to the Retail Prices Index (RPI) the Government exposes itself to inflation risks on interest payments. In this box, we looked at how changes to the formula for calculating RPI would affect our forecast.
The 2008 Climate Change Act requires the Government to assess the risks from climate change every five years. In this box, we looked at the most recent assessment published in 2017 and linked the six priority risk areas to how they are fiscal risks.
In 2016, the Office of Management and Budget and President Obama’s Council of Economic Advisors produced a preliminary assessment of some of the fiscal risks associated with climate change. In this box, we describe the estimated potential costs of these fiscal risks, which could affect both expenditure and revenue.
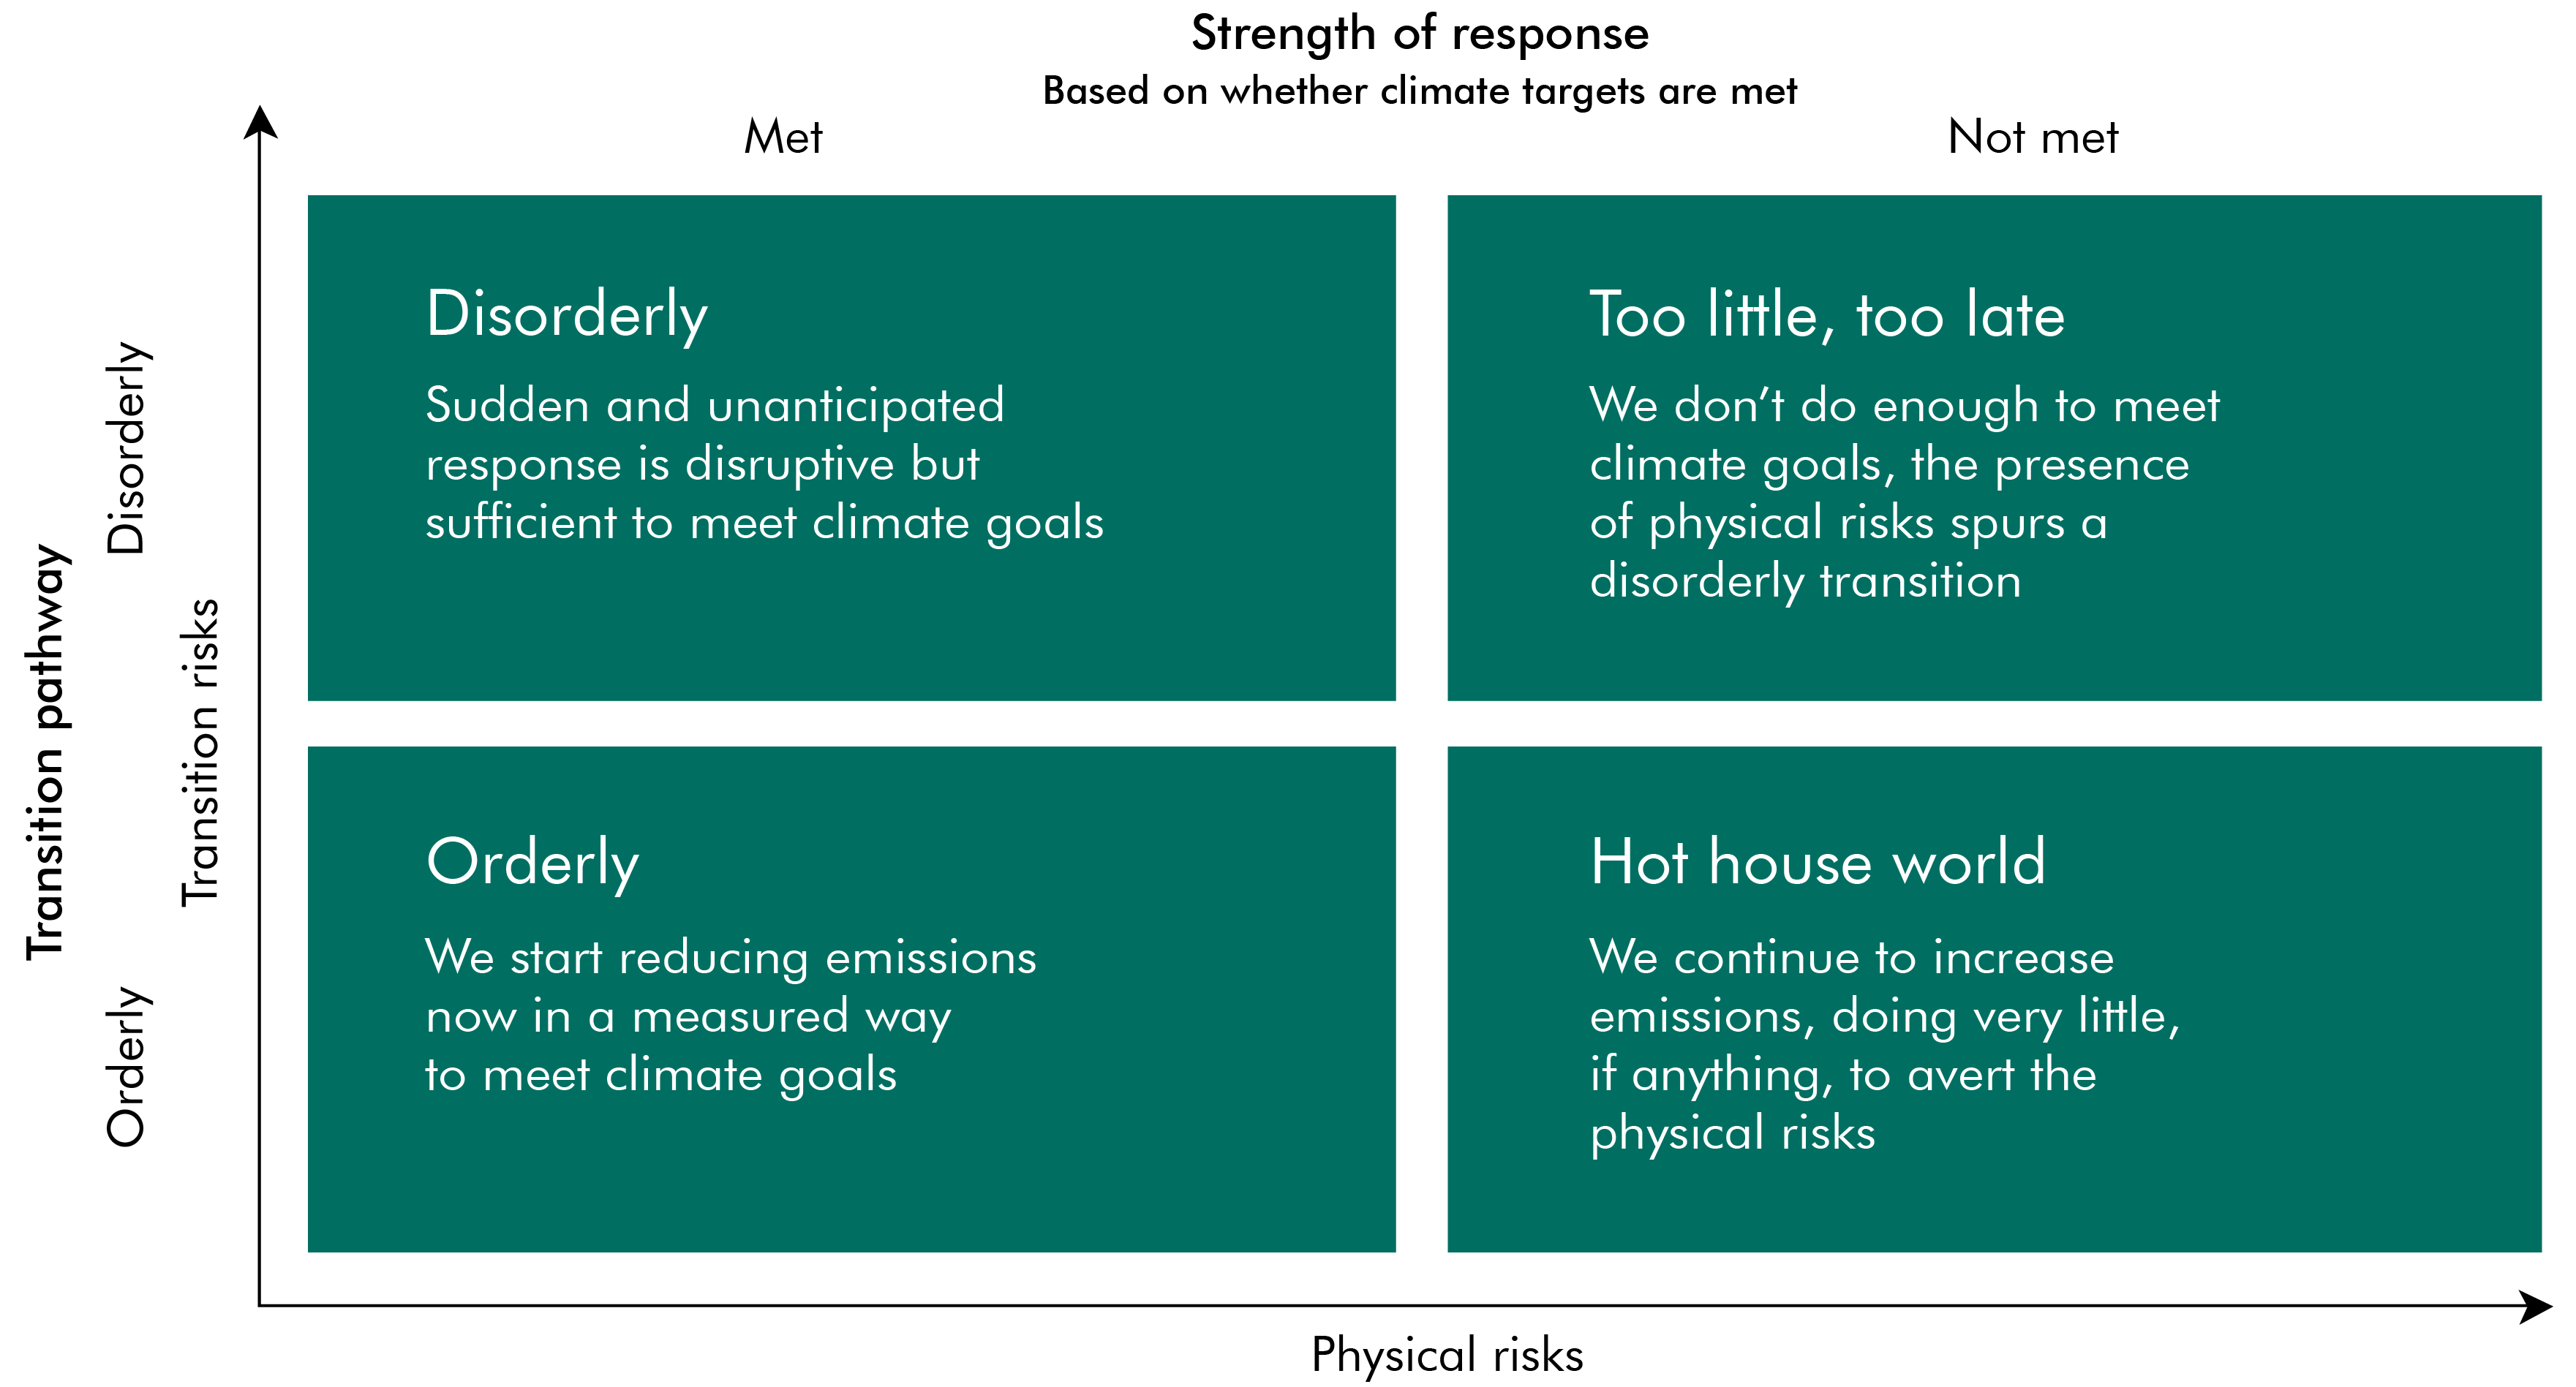
In April 2019, the Network for Greening the Financial System (NGFS) issued a ‘call for action’ that sets out the next steps for assessing climate-related risks to financial stability. In this box, we looked at the scenario framework used by the NGFS, and the Green Finance Strategy – in which the UK Government set out how it will ensure the management of climate-related financial risks.
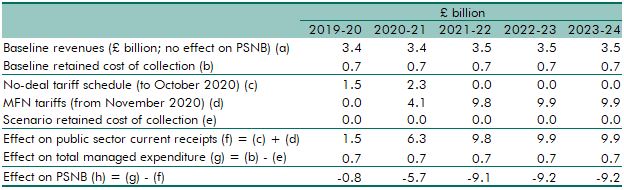
In the event of a 'no-deal' Brexit, the UK would be able to apply its own external tariff to goods imported. In this box, we explored the impacts of customs duties on borrowing, what a preliminary estimate of potential revenues would be and what else we would need to consider if this were to be our central forecast.
Survey evidence suggested that firms were building inventories ahead of the UK's exit from the EU. In this box we considered prospects for stockbuilding and the implications for GDP growth.
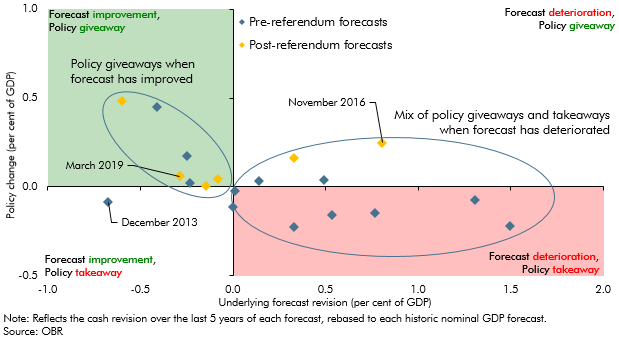
Presented with an improvement in the outlook for the public finances, the Government decided to loosen discretionary fiscal policy at this event. In this box we considered how Governments have responded to past pre-measures fiscal forecast changes.
Measures of reported disability prevalence are often subject to great variability and this can make drawing precise conclusions from them difficult. In this box, we considered two examples where measures varied. The first related to differences between Labour Force Survey and General Health Survey measures of working-age disability prevalence and the second to large changes in the former. We discussed differences in methodology and changes in attitudes as possible drivers.
Public financial support for disabled people extends beyond the extra-costs disability benefits and includes several other welfare payments. This box gave an overview of some of the most important interactions between disability and other benefits that provide support for disabled people.
Our ability to forecast accurately is heavily dependent on the quality of the data we can use. In this box we explained how statistical and expenditure data could be distorted by problems in delivery of the benefit, and the difficulties this creates in identifying emerging trends in the data.
There are several possible approaches to forecasting benefit spending. In this box we outlined the key issues the modelling of disability benefits needed to address, the three approaches we used to forecast spending, and the strengths and limitations of each, concluding that a combination of approaches was better than reliance on any single one.
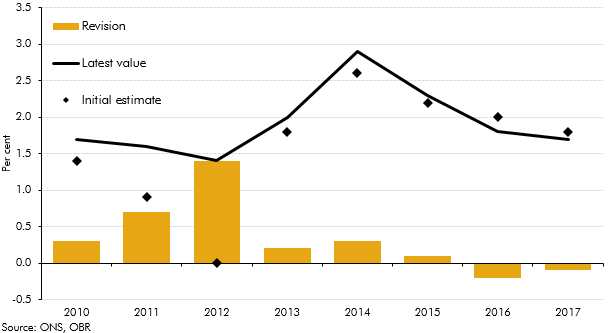
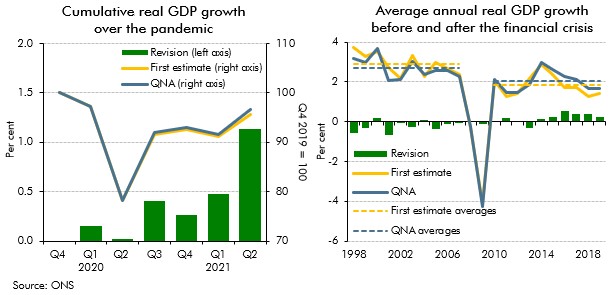
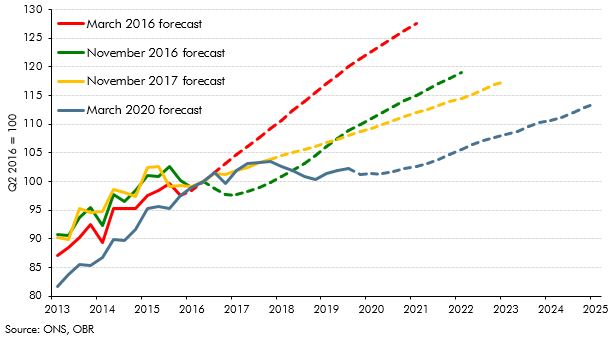
Revisions to National Accounts data are a normal part of the Blue Book process, which reconciles the different measures of GDP and incorporates information from annual data sources. This box explored how the estimated path of real GDP growth since 2010 has evolved over time, focusing in particular on revisions to GDP growth in 2012.
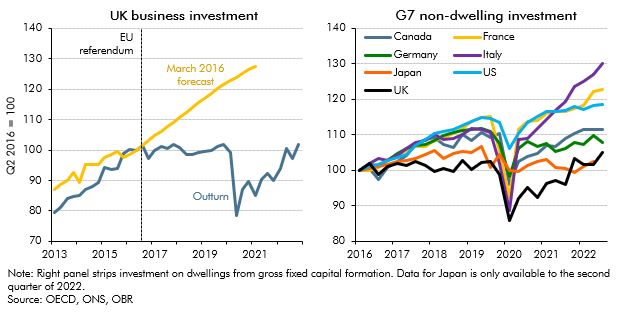
The vote to leave the EU had caused in a a slowdown in real GDP growth in the UK, with the main driver being weak investment growth. This box compared UK growth and investment since the referendum to that in the other major advanced countries in the G7.

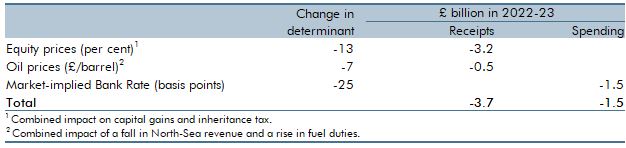
One unforeseen economic development affecting our March 2016 forecast was the upside surprise in inflation in 2017-18 as a result of the fall in the exchange rate. This box described the effect of that surprise on receipts, spending and borrowing.
In recent years, onshore corporation tax receipts have repeatedly surprised on the upside. This box described the drivers behind that strength, in particular the contribution from a rising effective tax rate despite cuts to the headline rates.
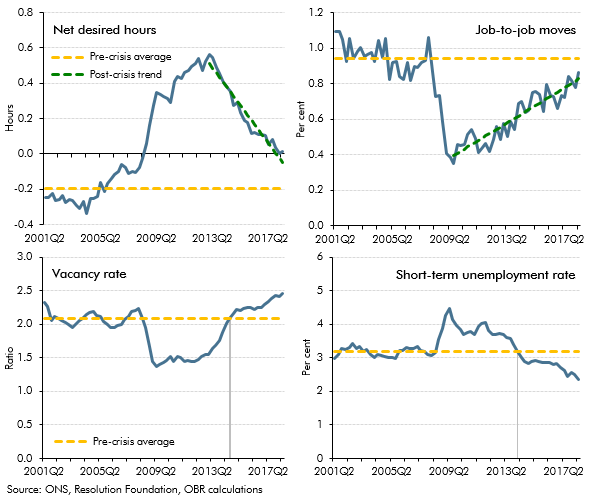
In the 2018 Economic and fiscal outlook we discussed how the unemployment rate – which had fallen to its lowest level since 1975 – may not necessarily give a complete picture of the extent of labour market slack. This box therefore looked at some other measures, some of which suggested there could be more spare capacity than was captured by the unemployment rate at that time and some of which could be used to argue that there was less.
In each Economic and fiscal outlook we publish a box that summarises the effects of the Government’s new policy measures on our economy forecast. These include the overall effect of the package of measures and any specific effects of individual measures that we deem to be sufficiently material to have wider indirect effects on the economy. In our October 2018 Economic and fiscal outlook, economy forecast adjustments included the effects of looser fiscal policy on GDP and inflation, the effects of capital allowances on business investment, the effects of tax policy changes on inflation and the effects of the extension of the Help to Buy scheme on the housing market.
Alongside the October 2018 Economic and fiscal outlook (EFO) the Government expressed its aspiration to end low pay, noting the definition used by the OECD, which corresponds to two-thirds of median earnings. This policy was not firm enough for us to incorporate into our central forecast. Nevertheless, in this box we drew on previous analysis from our July 2015 EFO – when the National Living Wage was first introduced – to illustrate the potential effect on the economy and public finances.
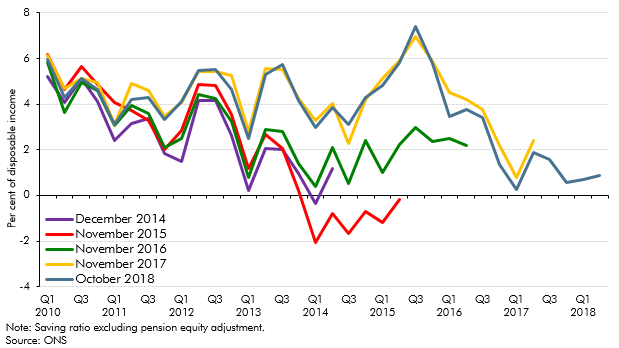
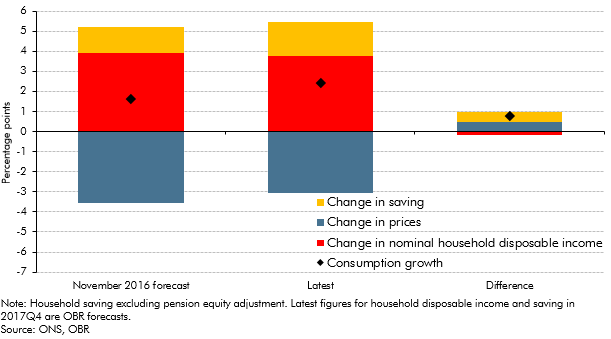
In our October 2018 forecast, the saving ratio – excluding pension contributions - was expected to turn negative, while unsecured debt was expected to rise steadily as a share of household income. In this box, we set out why this did not mean our growth forecast was dependent on a large and unsustainable increase in consumption, nor a significant expansion in consumer credit. Estimates of the saving ratio are subject to frequent revision, while only just over a third of unsecured debt relates to consumer credit, with a small and growing share made up by student loan debt. We also expect total interest payments on debt to remain subdued over the forecast period.
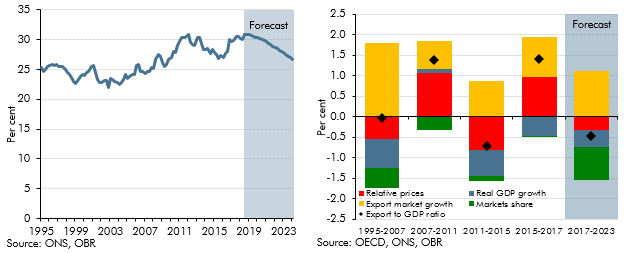
In August 2018 the Government announced an ambition to increase the UK's exports to 35 per cent of GDP. In this box we explored the drivers of previous changes in the exports-to-GDP ratio and how we expect it to change in our October 2018 forecast.
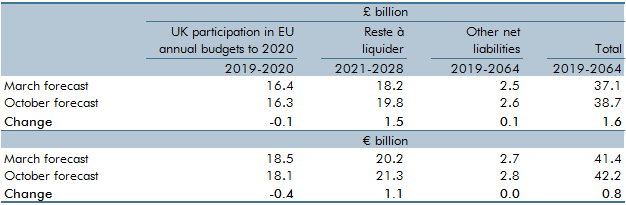
In the March 2018 Economic and fiscal outlook (EFO) we set out in detail how we calculated the cost of the Government’s financial settlement with the EU. This box from our October 2018 EFO updated our estimate of the financial settlement’s cost and the reasons for the changes since March.
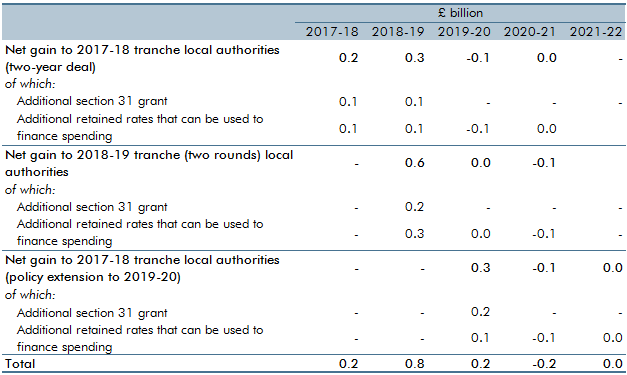
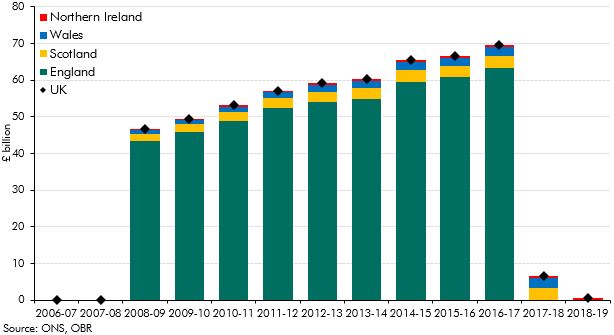
The Government has been piloting full business rates retention since 2017-18. These pilots featured in our forecasts from March 2017. This box reconsidered and re-estimated the fiscal effects of the 100 per cent local retention pilots scheme.
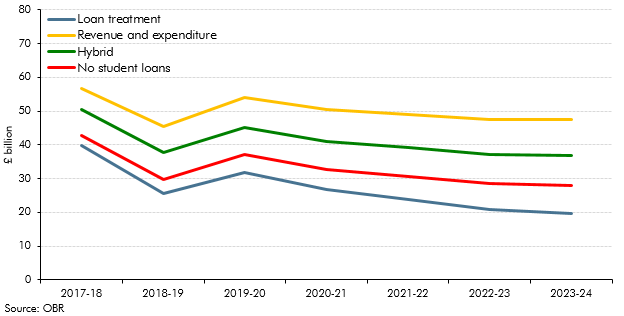
The accounting treatment applied to the burgeoning stock of student loans has been the subject of much interest over the past year, with reports from the House of Lords Economic Affairs Committee, the House of Commons Treasury Select Committee and the Office for National Statistics. In July, we published our own contribution in Working Paper No. 12: Student loans and fiscal illusions. In this box we analysed the possible impacts of different accounting treatments on our estimate of the deficit.
We incorporate sales of financial assets in our forecasts when firm details are available that allow the effects to be quantified with reasonable accuracy and allocated to a specific year. In the case of the sale of student loans the government also considers whether a sale offers value for money. This box looked at the way in which the Government uses discount rates to evaluate value for money, how this does not mean the sales strengthen the public finances and whether future sales are likely to proceed.
Public sector net financial liabilities (PSNFL) is a wider measure of the balance sheet than public sector net debt (PSND) and includes all financial assets and liabilities recognised in the National Accounts. In this box we examined some of these differences and presented a projection of the components of PSNFL.
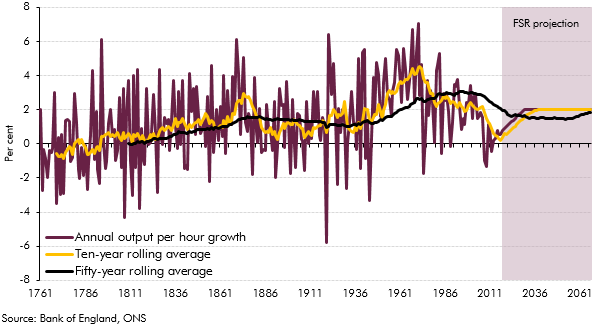
In our November 2017 EFO, we revised down our forecast for trend productivity growth so that it reached 1.2 per cent a year at the end of the medium-term horizon. For the purposes of the long-term projections in our 2018 FSR, we assumed that productivity growth would rise beyond the medium term to reach 2.0 per cent a year from 2030-31 onwards. In this box we provided context for our long-term assumption by exploring the rises and falls in UK productivity growth over the past two-and-a-half centuries.
The Government commissioned two reports published in 2017 to inform its review of the State Pension age (SPA): an independent review by John Cridland and a report by the Government Actuary’s Department (GAD). This box summarised the key findings from these two reports.
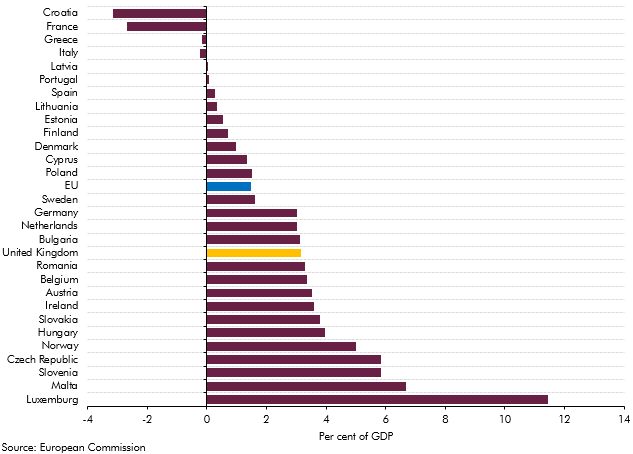
Our 2018 long-term fiscal projections suggested that, if left unaddressed, the public sector finances would come under increasing pressure over the next 50 years. This box compared our long-term age related spending projections over the period from 2025 to 2065 with those presented in the European Commission's 2018 Ageing Report.
The population projections used to produce our long-term fiscal projections are underpinned by projections for age-specific fertility and mortality rates. In this box we considered two different ways of summarising trends in these rates - period and cohort metrics - and discussed their relative advantages.
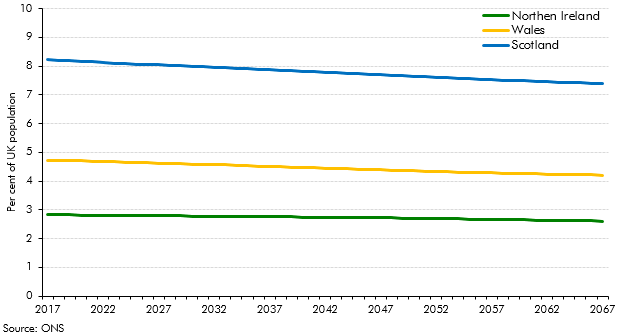
This box looked at differences in the Office for National Statistics’ population projections for the four constituent nations of the UK. It discussed the nations’ relative size and ageing, and possible implications for fiscal sustainability.
In the November 2016 EFO we made a number of judgements about how the vote to leave the EU would effect the economy in the near-term. This box from our March 2018 EFO compared these judgements against the outturn data that we had received since then, finding that most of these judgements were broadly on track.
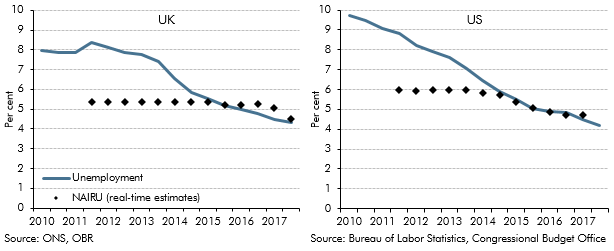
We revised down our estimate of the sustainable unemployment rate three times between 2015 and 2017, with unemployment falling faster than we had expected over that period but little evidence of rising wage pressure. This box from our March 2018 EFO compared the revisions we had made with those of the Congressional Budget Office in the US, which had faced similar issues when forecasting US unemployment.
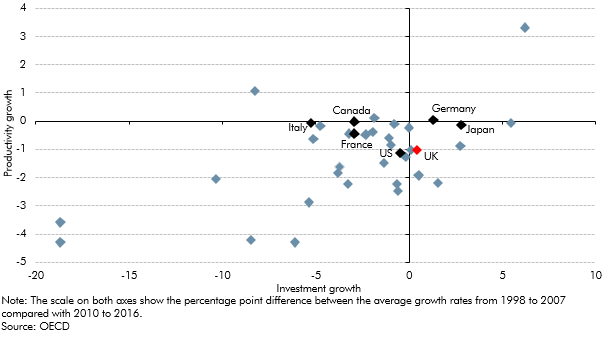
The outlook for productivity growth is one of the most important and yet uncertain areas of our economy forecast. In this box from our March 2018 EFO we looked at how actual productivity growth can be broken down into contributions from capital deepening and total factor productivity (TFP) growth and how differences in investment across countries could be related to post-crisis productivity performance.
Our first post-EU referendum forecast in November 2016 assumed that leaving the EU would result in a less open economy and lower productivity, but we did not incorporate an explicit link between the two over our medium-term forecast horizon. This box from our March 2018 EFO discusses why we did not include this link and what other forecasters have assumed.
The Pension Protection Fund is a significant part of the public sector, but as of March 2018 it did not appear in either outturn public finances data or in our forecasts. This box from our March 2018 EFO explained why that was the case, and why recent announcements from the Office for National Statistics meant that it represented a significant classification risk to our forecast.
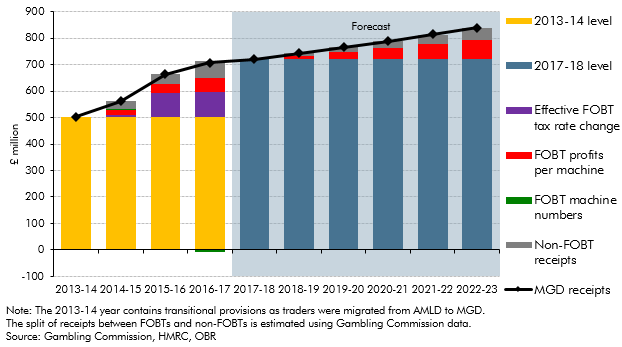
In 2017, the Government announced plans to reduce maximum permitted stakes on fixed-odds betting terminals (FOBTs) from £100 to between £50 and £2. This box from our March 2018 EFO explored recent trends in machine games duty (MGD) receipts and the contribution of FOBTs to them, illustrating the scale of receipts that might be affected by the planned policy change.
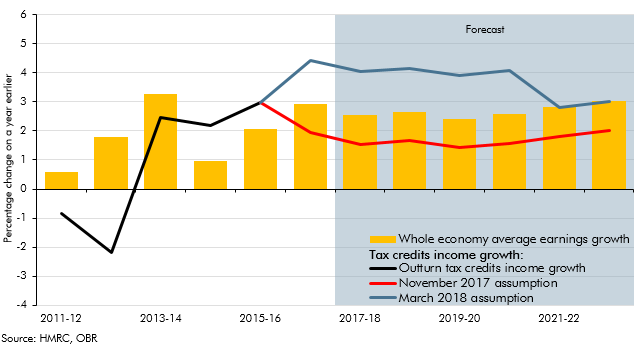
Spending on tax credits came in consistently lower than our forecasts from 2014-15 onwards. In our March 2018 EFO we increased our assumption for the growth in incomes of tax credits families relative to headline earnings growth, significantly lowering our tax spending forecast. This box set out the analysis that underpinned this change in forecasting assumption.
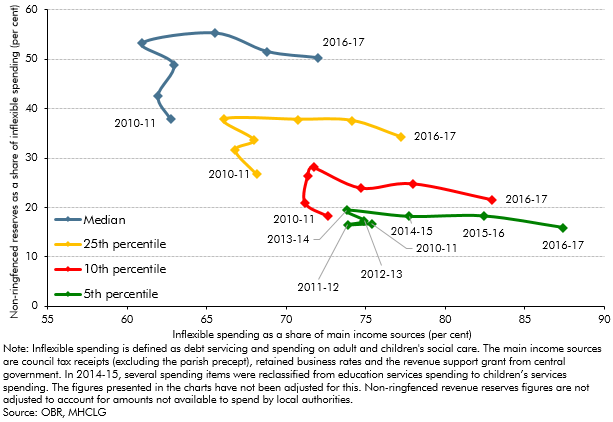
Local authorities’ net use of reserves (the amount they add to or drawdown from their stock of reserves) is a key judgement in our fiscal forecasts. This box from our March 2018 EFO examined two indicators of the general financial health of English local authorities over the period 2010-11 to 2016-17, assessing how these metrics might be used to inform our forecast judgements.
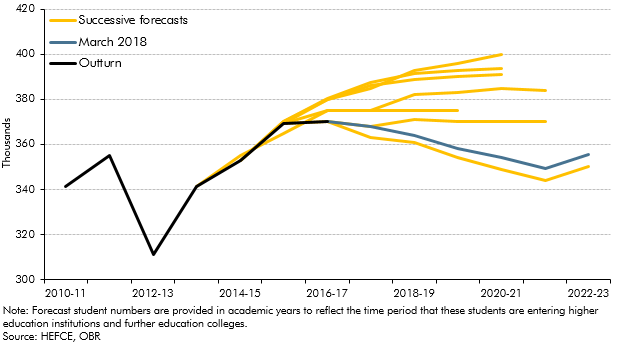
Student loans are the largest component of our financial transactions forecast, and even small changes to information about student numbers can have a significant impact on our public sector net debt forecast. This box from our March 2018 EFO discussed our previous and current student numbers forecasts and the factors that we take into account when producing them.
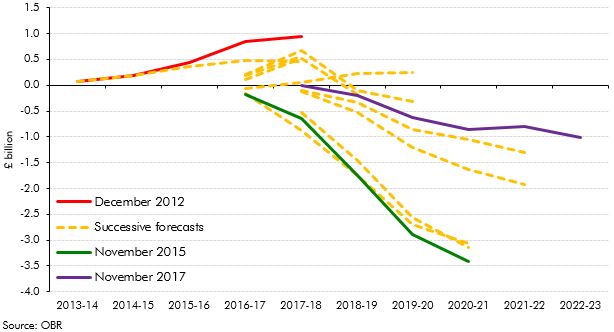
In our 2018 Welfare trends report, Chapter 3 looked at the design of universal credit, including how the 'work allowances' within it have been changed since the policy was first factored into our forecasts. This box looked at how our estimates of the net cost or saving from UC relative to the legacy benefits have evolved over time, and the important part played by Government decisions to reduce the UC work allowances.
In our 2018 Welfare trends report, Chapter 3 looked at the design of universal credit, including the role to be played by UC work coaches setting conditions and applying sanctions to encourage claimants to seek and progress in work. This box outlined the role, responsibilities and renumeration of work coaches, as set out in DWP's candidate information pack for applicants for the role.
In our 2018 Welfare trends report, Chapter 4 described how we model the effects of universal credit on spending. This draws heavily on two models owned and operated by DWP - the Policy simulation model (PSM) and the Integrated forecasting model (INFORM). PSM is a static micro-simulation model that uses Family Resources Survey (FRS) data to analyse policy changes. This box detailed how the FRS is used in PSM and some of the issues that raises for our UC forecast.
In our 2018 Welfare trends report, Chapter 4 described how we model the effects of universal credit on spending. This draws heavily on two models owned and operated by DWP - the Policy simulation model (PSM) and the Integrated forecasting model (INFORM). INFORM is a dynamic micro-simulation model that uses DWP administrative data to forecast the caseloads for different benefits. This box described how INFORM is used in our UC forecast and some of its limitations.
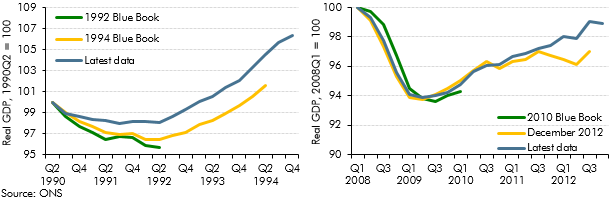
Revisions to National Accounts data are a normal part of the Blue Book process, which reconciles the different measures of GDP and incorporates information from annual data sources. This box explored how the estimated path of the 1990-92 and 2008-09 recessions and subsequent recoveries evolved over time, focusing in particular on revisions to GDP growth in 2011 and 2012.
In each Economic and fiscal outlook we publish a box that summarises the effects of the Government’s new policy measures on our economy forecast. These include the overall effect of the package of measures and any specific effects of individual measures that we deem to be sufficiently material to have wider indirect effects on the economy. In our November 2017 Economic and fiscal outlook, economy forecast adjustments included the effects of looser fiscal policy on GDP, the effects of tax policy changes on inflation and the effects of stamp duty relief for first-time-buyers on house prices.
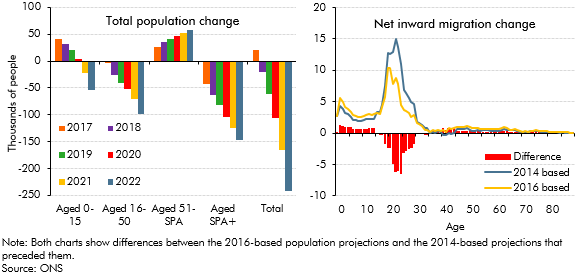
The Office for National Statistics (ONS) published new UK population projections in October 2017, based on 2016 population estimates and updated assumptions for fertility, mortality and net migration. This box compared the latest projections with the previous 2014-based principal projections that underpinned our March 2017 forecast and summarised their effects on our November 2017 fiscal forecast.
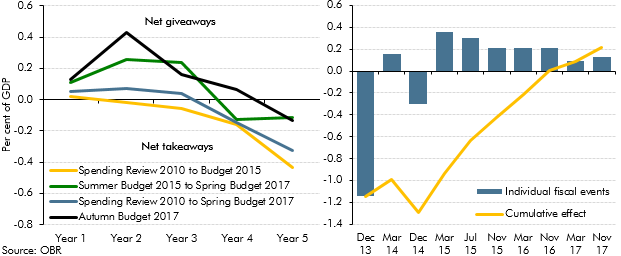
In each Economic and fiscal outlook we incorporate the impact of the policy decisions announced in the Chancellor’s Budget or other fiscal statement (the ‘fiscal event’). This box looked at how measures announced at the previous 16 fiscal events had tended to announce near-term giveaways but with the promise of takeaways in the later years. The Autumn Budget saw this pattern repeated.
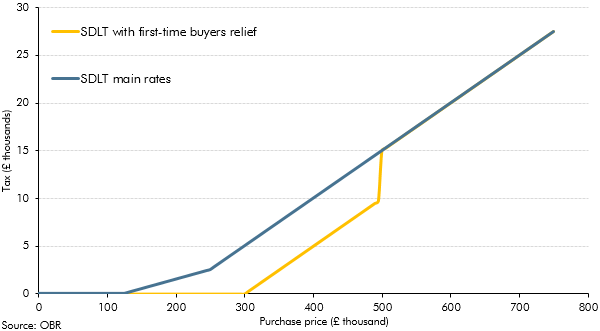
In Autumn Budget 2017, the Government announced the introduction of a permanent stamp duty land tax (SDLT) relief for first-time buyers. This box considered the effects of a previous temporary relief for first-time buyers and how the new permanent relief was expected to affect tax receipts and house prices.
Local authorities’ net use of reserves (the amount they add to or drawdown from their stock) is a key judgement in our local authority current spending forecasts as it directly affects borrowing. This box outlined recent trends in use of current reserves, split by English authorities with and without upper-tier responsibilities (such as education and social care), which underpinned our November 2017 forecast judgements.
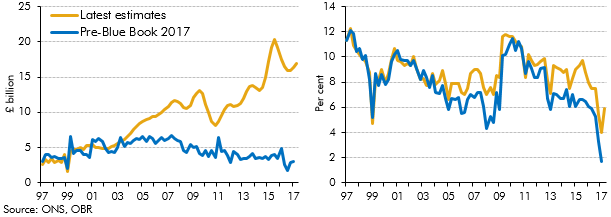
In recent years there has been a significant increase in the number of people setting themselves up as single-director companies (‘incorporations’), implying an increase in the share of household income received as dividends. ONS estimates of households dividend income were revised significantly as part of Blue Book 2017, and better capture this rise in incorporations. This box discussed the implications of these revisions, which implied a much higher level of household disposable income and household saving than previous estimates.
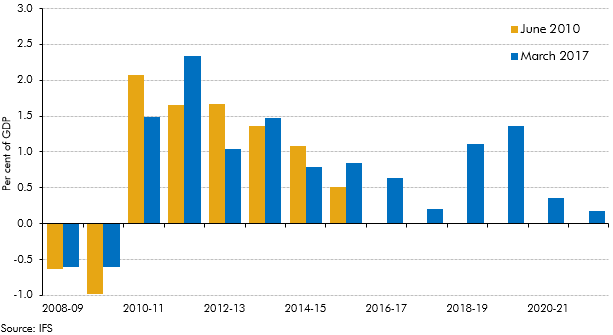
Over the past six years there has been a large discretionary fiscal tightening in the UK. This box set out estimates of the effect of fiscal policy changes on GDP growth, based on estimates of the consolidation produced by the Institute for Fiscal Studies (IFS) together with estimates of fiscal multipliers, which are drawn from the available empirical literature. The box also considered how changes in discretionary fiscal policy compared with our forecast errors for GDP growth.
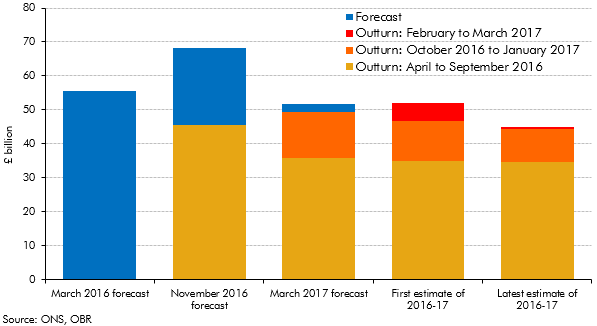
Initial estimates of the deficit can be revised significantly over subsequent months as more reliable data become available. This box set out how our forecasts during 2016 and 2017 evolved and how the outturns for 2016-17 were revised over time.
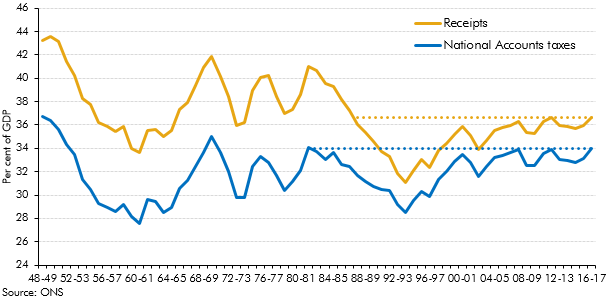
Strong overall receipts growth in 2016-17 took receipts as a share of GDP to their highest since 1986-87. This box explored how the composition of the public sector’s income has changed over the three decades since receipts were last at the latest share of GDP.
When discussing the potential impact of fiscal risks on the public sector balance sheet in our 2017 Fiscal risks report, we focused on the Government’s target measure of public sector net debt and its broader, but less-well-known counterpart, public sector net financial liabilities. In this box we considered some of the pros and cons of three even broader measures of the public sector balance sheet.
Our 2017 Fiscal risks report noted the historical and international evidence that financial crises have been a major source of risk to the public finances. Since the crisis of the late 2000s, the UK Government has reformed its regulation of the financial system. In this box we outlined key elements of those reforms, which aim to ensure that should a bank fail it can be managed in a way that protects the wider economy and financial system.
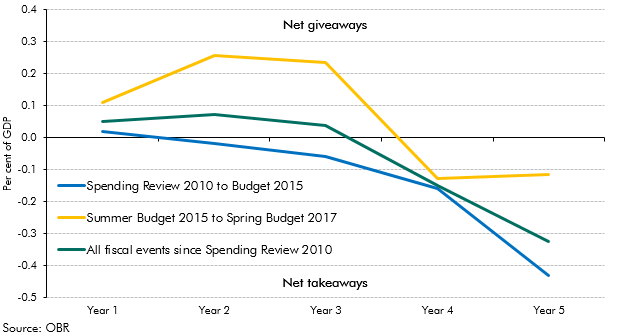
In each Budget or Autumn Statement, there are typically lots of policy giveaways (tax cuts or spending rises) and takeaways (tax rises or spending cuts). The net effect of these will be to raise or reduce borrowing in specific years and on average over the five years of the forecast – in other words to loosen or tighten fiscal policy. In this box from our 2017 Fiscal risks report we considered the pattern of those policy changes since 2010, noting that near-term giveaways are often financed by the promise of medium-term takeaways.
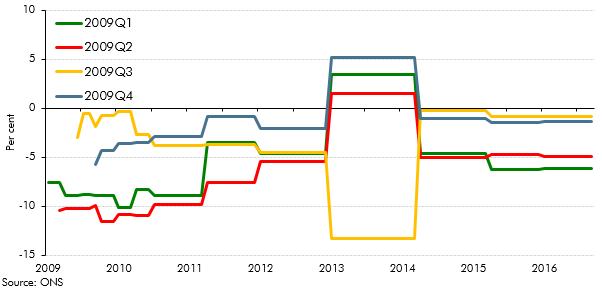
All elements of GDP data are subject to revision, which creates one source of uncertainty in our forecasts. Business investment data are particularly prone to revision. In this box from our March 2017 Economic and fiscal outlook we looked at past revisions in business investment data and compared the volatility and average revision of UK data with those produced by other countries.
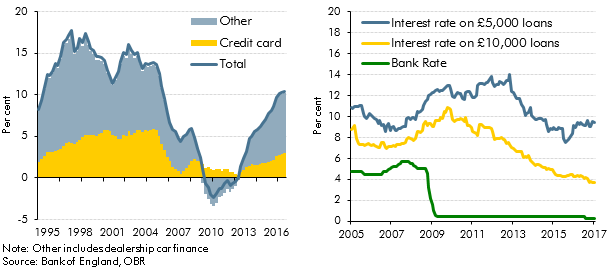
Strong growth in consumer credit in the run-up to our March 2017 Economic and fiscal outlook had prompted concerns among some commentators about its sustainability. In this box we considered the drivers of consumer credit growth, including the role of dealership car finance, and the extent to which it may have supported household consumption growth.
In each Economic and fiscal outlook we publish a box that summarises the effects of the Government’s new policy measures on our economy forecast. These include the overall effect of the package of measures and any specific effects of individual measures that we deem to be sufficiently material to have wider indirect effects on the economy. In our March 2017 Economic and Fiscal Outlook, we adjusted our economy forecast for the effects of reducing the ‘personal injury discount rate’.
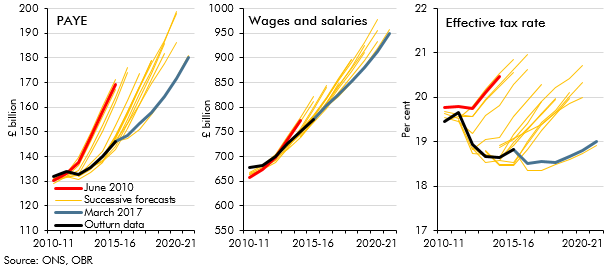
PAYE income tax is the Government’s single most important source of revenue, and one where our forecasts since 2010 have tended to be revised down over time. In this box from our March 2017 Economic and fiscal outlook, we explored the role that changes in the distribution of earnings might have played in explaining the shortfalls in income tax receipts.
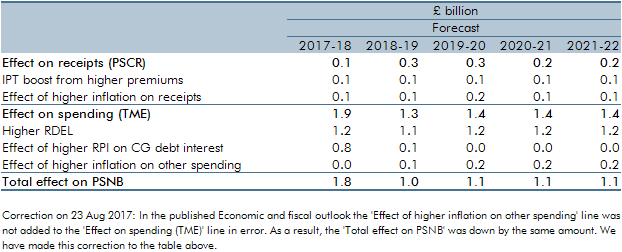
In February 2017, just ahead of the Spring Budget and our March Economic and fiscal outlook, the Ministry of Justice announced that the ‘personal injury discount rate’ would be reduced from 2.5 to minus 0.75 per cent (in inflation-adjusted real terms). This box explained the direct and indirect effects of this change on our receipts and public spending forecasts.
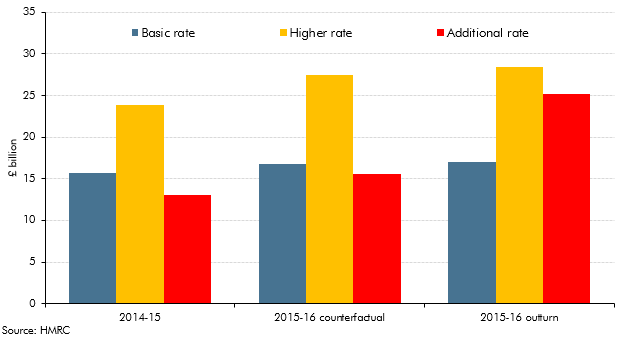
Ahead of our March 2017 Economic and fiscal outlook, self-assessment tax receipts indicated that the Summer Budget 2015 reforms to the taxation of individual dividend income had prompted even greater income shifting than we had expected. The reforms raised the basic, higher and additional rates by 7.5 percentage points from April 2016 and introduced a tax-free allowance on the first £5,000 of taxable annual dividend income. They were pre-announced, giving taxpayers around eight months to bring forward dividend income into 2015-16 so that it was taxed at the lower rate. This box considered the amount of income brought forward and the effect of that on tax receipts.
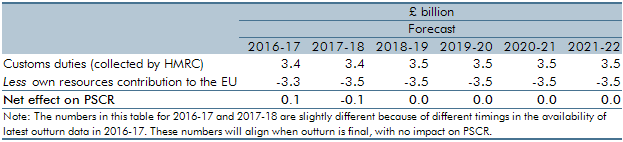
Our post-EU referendum publications noted many direct or indirect Brexit-related uncertainties across our economy and fiscal forecasts. One area that will be directly affected after Brexit is customs duties. In our March 2017 Economic and fiscal outlook, this box outlined the how customs duty was currently treated in the public finances data and the fiscally neutral approach that we had used in our forecast pending further information on post-Brexit policy settings.
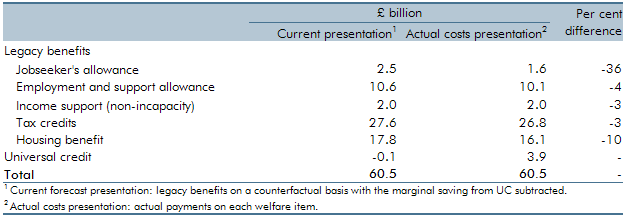
A key issue in our welfare spending forecast is the transition to universal credit (UC) from the existing ‘legacy’ benefits and tax credits systems. In our March 2017 Economic and fiscal outlook, our central forecast was constructed by forecasting the ‘legacy’ system as though UC did not exist, then subtracting from it an estimate of the marginal saving associated with rolling out UC. This box presented estimates for actual gross spending in 2017-18 on UC and the legacy benefits and tax credits that it is replacing.
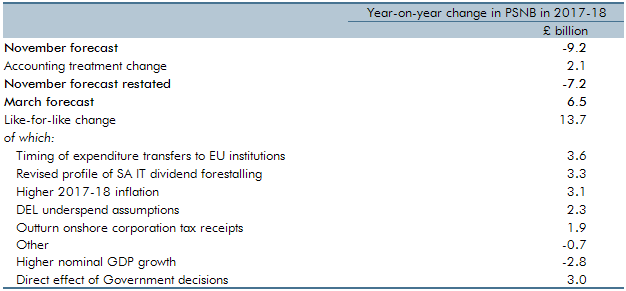
For the first time in any Economic and fiscal outlook, our March 2017 forecast showed post-measures borrowing rising year-on-year in one year of the forecast – 2017-18. This box explored the factors that explained why borrowing was expected to rise in that year, when our November 2016 forecast had assumed it would continue to fall.
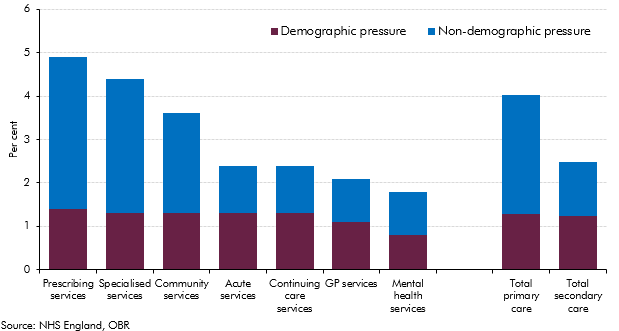
Over the past four decades, health spending in the UK rose faster than GDP (on average in real terms) and it increased steadily in real per capita terms. Demographic change alone could have not explained these rising trends, with other factors expected to provide further upward pressures on health spending. This box summarised the key findings of our WP No. 9 that reviewed the latest evidence on demographic and non-demographic determinants of health spending in the UK and its implications for our long-term health spending projections.
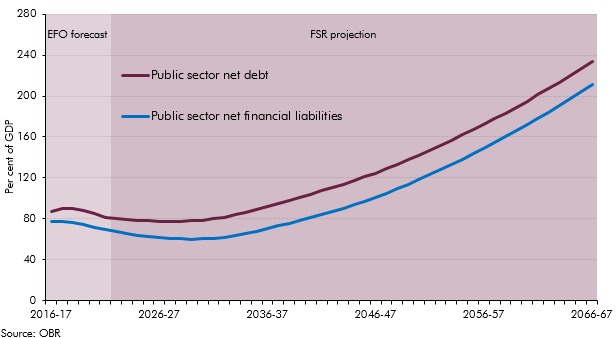
At Autumn Statement 2016 the Government asked us to forecast two new balance sheet metrics: PSND excluding the Bank of England and public sector net financial liabilities (PSNFL), a broader measure covering all the public sector’s financial assets and liabilities recorded in the National Accounts. This box presented our long-term projections for these two new balance sheet metrics with particular focus on PSNFL as PSND with and without the Bank of England tended to converge in our medium-term forecast and were expected to continue to do so over the long-term.
In our November 2016 forecast, our first following the June 2016 referendum, we revised down our potential growth forecast, primarily reflecting the effect of weaker business investment on productivity growth. To give some context to our central forecast judgements, this box outlined a number of channels through which the decision to leave the EU could affect potential output and the uncertainty associated with estimating these effects.
In each Economic and fiscal outlook we publish a box that summarises the effects of the Government’s new policy measures on our economy forecast. These include the overall effect of the package of measures and any specific effects of individual measures that we deem to be sufficiently material to have wider indirect effects on the economy. In our November 2016 Economic and Fiscal Outlook, economy forecast adjustments included the effects of looser fiscal policy on GDP and the effects of tax policy changes on inflation.
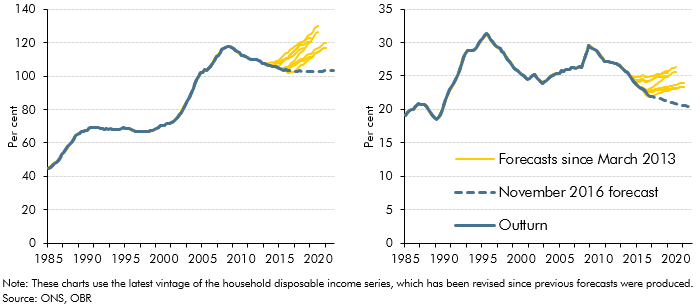
Before November 2016, our forecasts for mortgage debt (secured debt) were based on forecasts for mortgage demand and supply, as the determined by relationships in our house price model. In light of systematic forecast errors, this box outlined changes to our methodology for forecasting mortgage debt, which moved to an approach based on an accumulation identity.
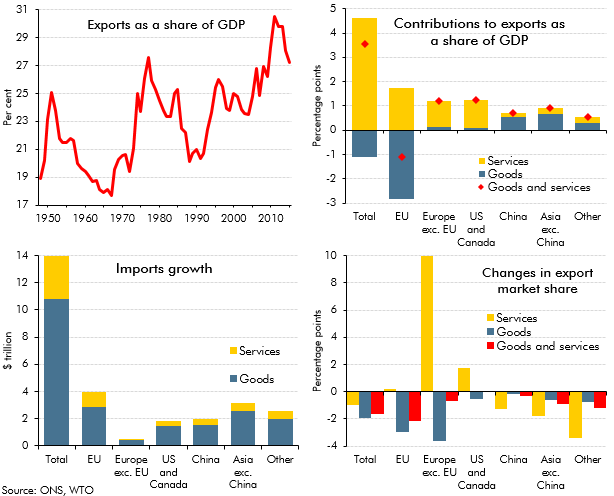
Following the June 2016 referendum result, we made a number of broad assumptions about the likely impact on trade, based on the average effects estimated in external studies. Given the importance of these assumptions, we looked at some past trends in this area, including the geographic composition and the relative importance of goods and services trade. We also set out some of the drivers of changes in exports as a share of GDP since 1999 and discussed the possible effects of trade on UK businesses and households.
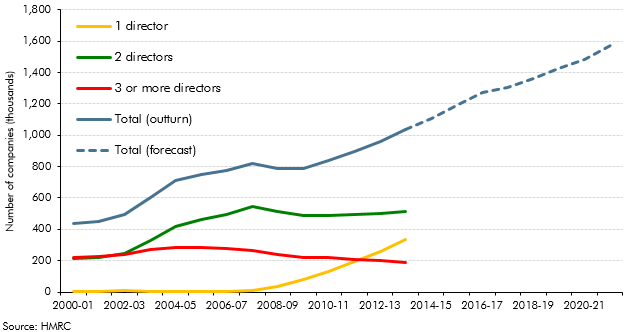
Our PAYE, SA, NICs and corporation tax (CT) forecasts are affected by our assumption that incorporations will continue their rising trend. This box covered historical estimates, the modelling of the receipts effects from incorporations and the implications for the forecast.
The ONS announced that it would implement a new accruals methodology for corporation tax (CT) early in 2017. This box outlined in detail the changes to the ONS methodology.
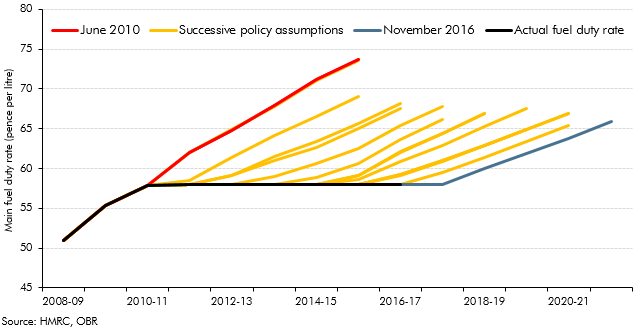
Our fuel duty receipts forecast combines our underlying forecast assumptions about the amount of fuel that will be purchased and the Government’s stated policies on the fuel duty rates that will be levied on those purchases. This box outlined the changes in fuel duty and policy assumptions since 2010.
The UK currently makes a substantial net financial contribution to the activities of the European Union. This box outlined the historical liabilities and other commitments entered into that officials, institutions and MEPs were said to be arguing that the UK should pay a share of, in light of Brexit. The box also listed government policy commitments to fund spending in certain areas where EU funding would be withdrawn.
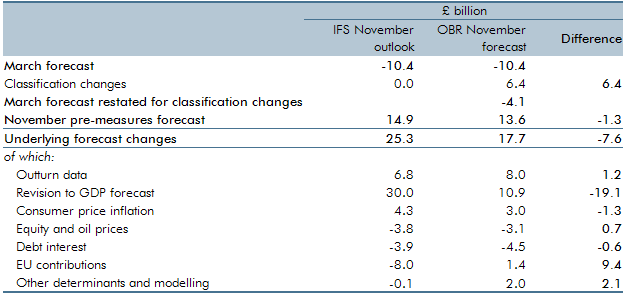
Ahead of the Chancellor’s Autumn Statement and our November 2016 Economic and fiscal outlook, the Institute for Fiscal Studies published an assessment of the outlook for the public finances. In this box, we described the differences between our new pre-measures forecast and that assessment.
Stamp duty land tax (SDLT) is one of the more volatile sources of receipts. In our 2016 Forecast evaluation report, this box identified a number of reasons why forecasting SDLT receipts is challenging, including the concentration of receipts in a small proportion of expensive properties and the effects of significant policy changes.
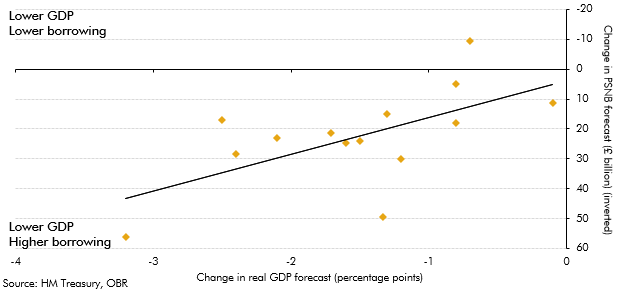
Our 2016 Forecast evaluation report was published around four months after the EU referendum was held. Over that period forecasters had revised their real GDP growth and borrowing forecasts. This box summarised those revisions and the relationship between them. It illustrated the uncertainty that forecasters faced in trying to predict the impact of the referendum result and Brexit on the economy and public finances.
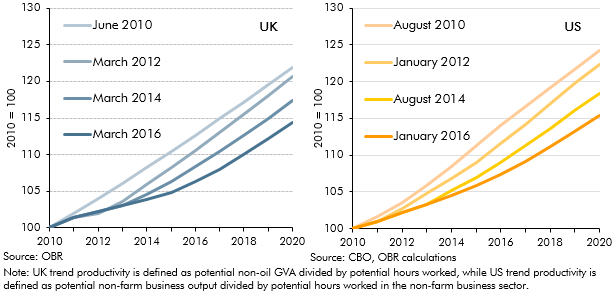
The path of productivity growth is a key driver of GDP growth in our forecast and is also one of the most uncertain judgements. In March 2016, given persistent weakness in outturn data, we revised down our forecast for productivity growth. But this issue was not specific to the UK, with productivity having disappointed in many other major advanced economies. This box compared different vintages of UK and US productivity and potential output forecasts since 2010 to illustrate this point.
In each Economic and fiscal outlook we publish a box that summarises the effects of the Government’s new policy measures on our economy forecast. These include the overall effect of the package of measures and any specific effects of individual measures that we deem to be sufficiently material to have wider indirect effects on the economy. In our March 2016 Economic and Fiscal Outlook, we made a number of economy forecast adjustments to GDP, business investment, wage growth, inflation and the housing market.
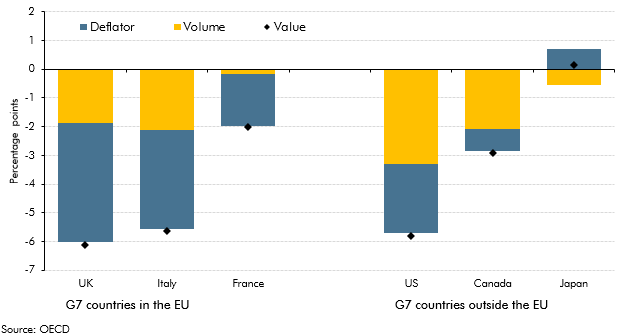
The government consumption deflator measures the implied price of government services. International comparisons show that different methodologies for deriving the government consumption deflator affect the extent to which nominal changes are interpreted as driven by changes in prices as opposed to volumes. This box outlined how these methodologies affected government consumption compared to pre-recession averages for six leading industrial countries.
Our forecasts must be prepared on the basis of current government policy. Before the EU referendum, that policy was to remain in the EU, so that was the basis for our March 2016 forecast. While we made no assessment at that stage as to what the economic and fiscal impacts of Brexit might be, in every forecast we highlight particular risks and uncertainties around our central projections. This box discussed Brexit as a particular source of uncertainty, by highlighting some pieces of external analysis which showed a wide range of views as to the possible impacts on trade, productivity and GDP growth.
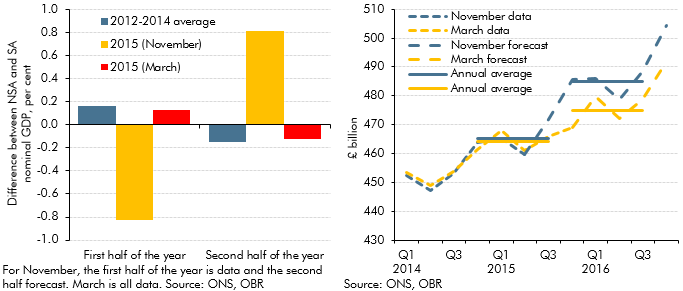
Our March 2016 Economic and fiscal outlook forecast was affected by an unusual quarterly profile of GDP growth on the non-seasonally adjusted measure that the Office for National Statistics uses as the denominator in fiscal measures. This box outlined that unusual pattern, how we had factored it into our forecast and the effects it had had on the profile of the debt-to-GDP ratio.
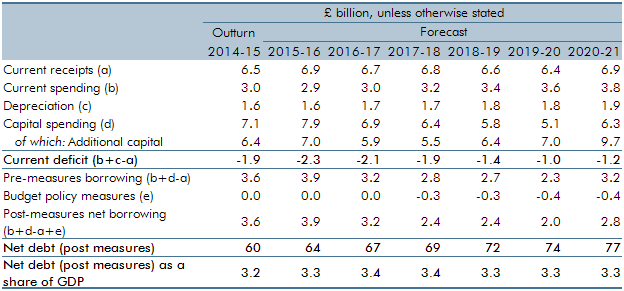
In our November 2015 forecast, we anticipated the effect on the public finances of the ONS decision to reclassify private registered providers of social housing in England. This box outlined the policy measures which affect our forecast, the effect on the public finances and changes in these forecasts since November.
Business rates are a major source of locally-raised finance used to fund locally-administered spending. The Government announced in Autumn Statement 2015 that it would let English local authorities retain 100 per cent of business rates by the end of the Parliament. This box outlined the change in local government financing arrangements and the responsibilities that might be devolved, as well as how these changes would affect our forecast.
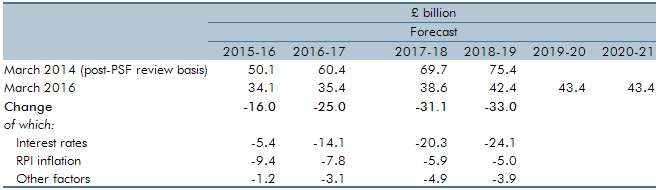
Since our March 2014 Economic and fiscal outlook, our debt interest spending forecast was revised down significantly as market expectations of the interest rates at which the Government can borrow and service its debt moved progressively lower and as inflation fell. This box explained some possible factors that could have caused market expectations of interest rates to rise and the effect on the fiscal position of a sudden increase in interest rates.
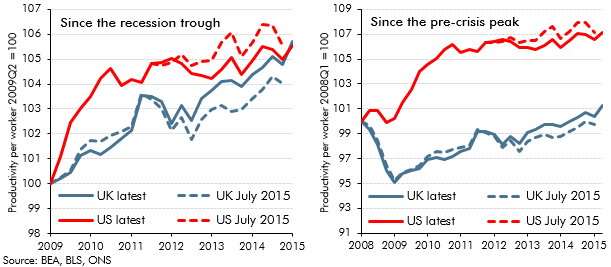
Recent estimates of UK GDP growth represent an early draft of economic history that will be revised, often substantially, over time. OECD found that initial estimates of UK GDP growth have tended to be revised up over time. This box also highlights revisions to estimates of US and UK productivity growth between July and November 2015, and the substantial productivity shortfall relative to the US and relative to the pre-crisis trend in the UK.
In each Economic and fiscal outlook we publish a box that summarises the effects of the Government’s new policy measures on our economy forecast. These include the overall effect of the package of measures and any specific effects of individual measures that we deem to be sufficiently material to have wider indirect effects on the economy. In the 2015 Autumn Statement and Spending Review, we made a number of adjustments to real and nominal GDP, the labour market, inflation, and the housing market.
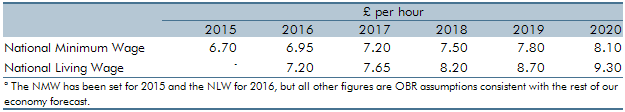
In July 2015, the Government announced the ‘National Living Wage’ (NLW) for workers aged 25 and above. This box from our November 2015 Economic and fiscal outlook outlined how revisions to the wider economy forecast affected our NLW forecast and also explored some of the potential labour market and employer responses to the NLW.
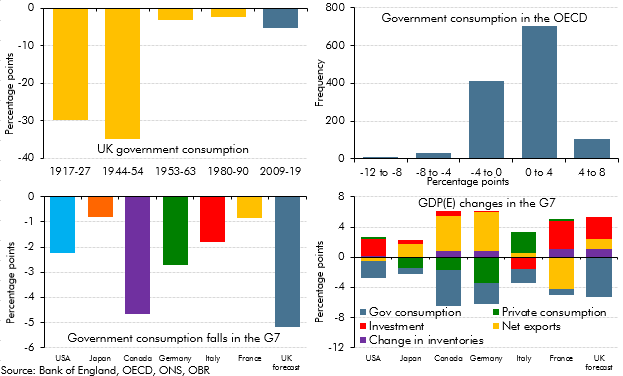
In our November 2015 Economic and fiscal outlook, government consumption was forecast to fall by 5.2 per cent of GDP between its peak in 2009 and 2019. This box looked at historical and international comparisons to give some context for this fall, as well as considering the possible impact on the composition of nominal GDP.
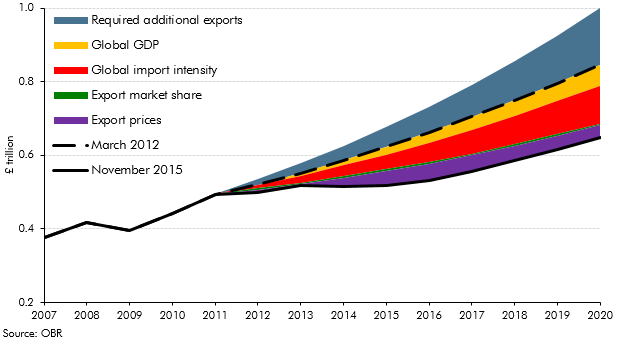
At Budget 2012, the Government stated its aspiration to increase the value of UK exports to £1 trillion by 2020. This box outlined the main drivers of export growth in our November 2015 Economic and fiscal outlook and the implications for our forecast relative to the Government's aspiration.
We always try to forecast the public finances consistent with how the ONS will measure them once it has implemented its classification decisions, so that our forecasts will be consistent with that eventual treatment. This box outlined the items included in our November 2015 forecast which the ONS had announced, but had yet to implement.
Modelling changes were made to the deductions element of the VAT model and to introduce a new model for NICs. The box outlined the modelling changes and the likely effect on receipts.
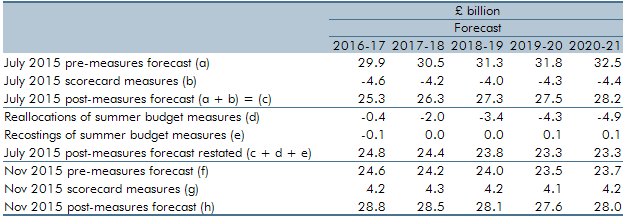
The July 2015 Budget included a large number of complex welfare measures that cut across multiple benefits with many interactions. At Autumn Statement 2015, we identified a number of measures where interaction effects had not been correctly estimated or classified. In this box of our November 2015 EFO, we discussed the re-estimation and reclassification of the interaction effects of a number of welfare measures. This included the reclassification of three tax credits measures and the measure extending the `lone parent obligation’ to ensure that these costings were consistent with our marginal universal credit (UC) forecast. The impact of cuts to tax credits on housing benefit entitlement were also re-estimated and reallocated to the housing benefit forecast from the tax credits forecast as the effect had previously been incorrectly allocated to tax credits.
We use a large number of fiscal forecasting models to generate our bottom-up forecasts of the public finances. This box outlined why models are essential forecasting tools, the various types of model used and how their performance is assessed.
As part of our economic forecast, we produce forecasts for total employment and GDP per capita based on ONS population projections. Relative to our June 2010 forecast, employment in 2015 was 1 million higher than expected and GDP per capita over the period increased by 4.5 per cent lower. This box from our July 2015 Economic and fiscal outlook examined the reasons for these forecast errors.
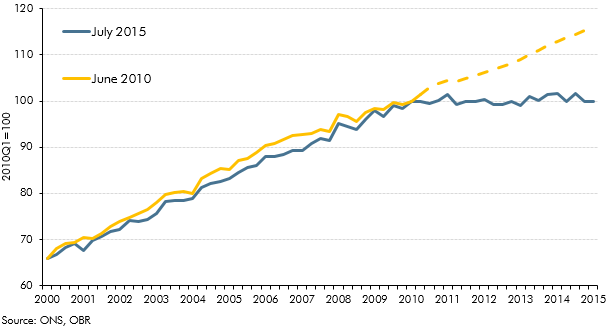
In the run up to the July 2015 Budget, fiscal policy had been tightened every year since 2010-11. This box, published in our July 2015 Economic and fiscal outlook, set out the fiscal multiplier framework used to estimate the overall effect of changes in fiscal policy on the economy. This box also outlined two ways in which this framework changed with regards to the tapering of multiplier effects across time and the assumed differences in multiplier effects on real and nominal GDP.
In each Economic and fiscal outlook we publish a box that summarises the effects of the Government’s new policy measures on our economy forecast. These include the overall effect of the package of measures and any specific effects of individual measures that we deem to be sufficiently material to have wider indirect effects on the economy. In the July 2015 Economic and fiscal outlook, we made a number of adjustments to real and nominal GDP, the labour market, inflation, business and residential investment, and the housing market.
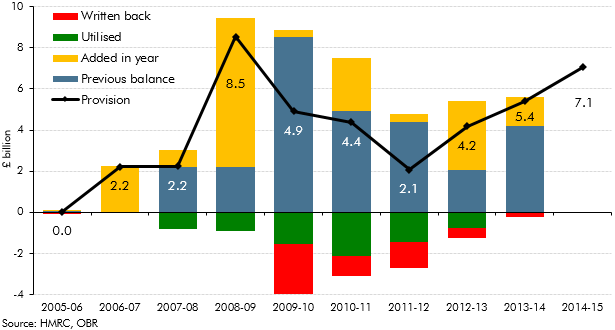
HMRC includes provisions in its accounts to cover risks from litigation cases where the tax at risk is greater than £100 million. This box highlighted the relationship between HMRC provisions, the amounts actually utilised and how this related to the July 2015 OBR forecast for likely tax litigation costs.
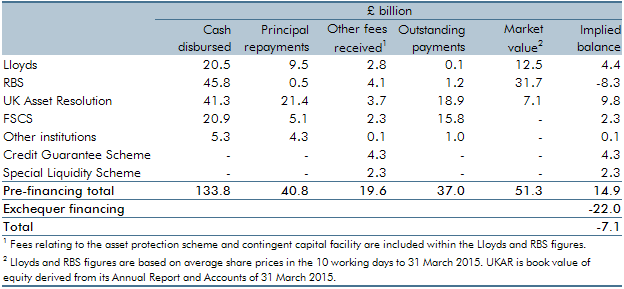
The Government undertook a number of interventions in the financial sector in response to the financial crisis and subsequent recession of the late 2000s. This box provided an update of the estimated net effect of them on the public finances as of July 2015.
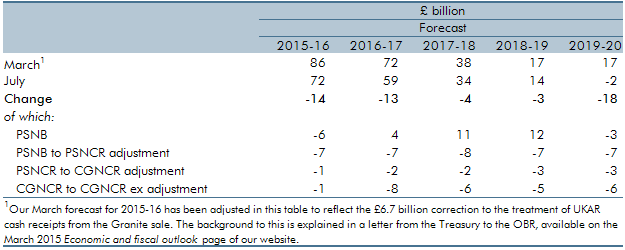
Our March 2015 Economic and fiscal outlook forecast highlighted that CGNCR ex outturn were significantly lower than what implied by our fiscal forecast. This box decomposed the revisions to CGNCR ex since our March 2015 forecast and it explained the factors that contributed to the divergence between our CGNCR ex forecast and the outturn.
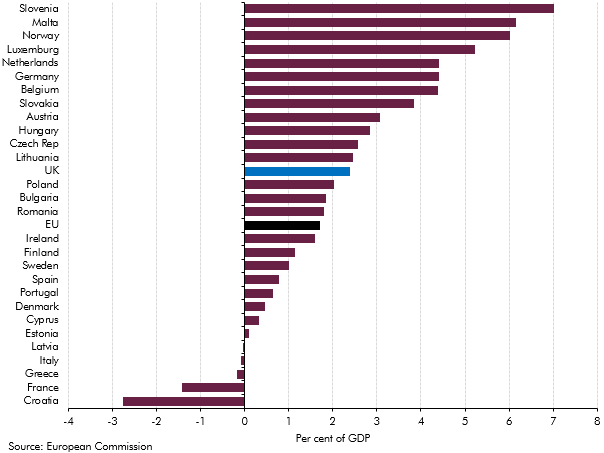
Our 2015 long-term fiscal projections suggested that, if left unaddressed, the public sector finances would have come under increasing pressure over the next 50 years due to rising age-related expenditure. This box compared our long-term age related spending projections with projections from the Ageing Working Group (2015) for the EU countries between 2020 and 2060.

In our 2015 Fiscal sustainability report, we assumed that GDP grows in line with its historical trend. This in effect implied 47 years of uninterrupted trend economic growth in our central projections. This box considered the alternative paths for debt as a share of GDP under an symmetric and asymmetric cycle, highlighting the sensitivity of the net debt projections to economic cycles.
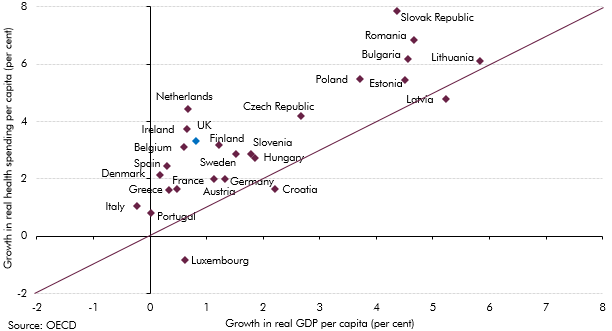
Health spending rose faster than GDP in almost all European countries over the past decade. This box investigated most notable long-term drivers of real spending on health care: demographic effects, income effects and other cost pressures.
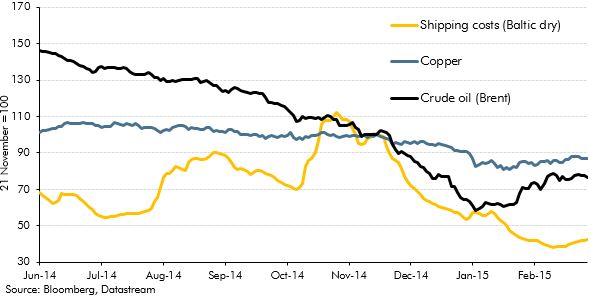
An important economic development in the run-up to our March 2015 Economic and fiscal outlook was the sharp drop in oil prices, which had fallen to less than half the $115-a-barrel peak that they had reached in June 2014. In this box we considered the relative importance of demand- and supply-side factors in explaining lower oil prices. (See also Box 3.1 from that EFO for a discussion of the effects of those lower prices on the UK economy.)
An important economic development in the run-up to our March 2015 Economic and fiscal outlook was the sharp drop in oil prices, which had fallen to less than half the $115-a-barrel peak that they had reached in June 2014. In this box we considered the channels along which those lower oil prices were likely to affect the UK economy. (See also Box 2.1 from that EFO for a discussion of the demand- and supply-side factors contributing to lower oil prices.)
In each Economic and fiscal outlook we publish a box that summarises the effects of the Government’s new policy measures on our economy forecast. These include the overall effect of the package of measures and any specific effects of individual measures that we deem to be sufficiently material to have wider indirect effects on the economy. In our March 2015 Economic and Fiscal Outlook, we made adjustments to nominal GDP, inflation and North sea production.
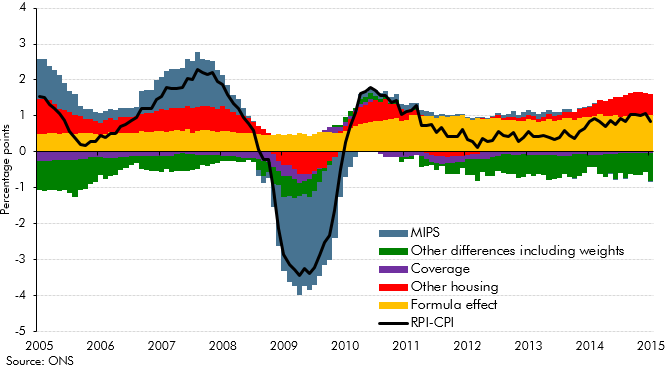
RPI inflation differs from CPI inflation for a number of reasons. Collectively the difference between the two measures is refered to as the 'wedge'. In light of more evidence this box, from our March 2015 Economic and fiscal outlook, re-examined historical contributions to the 'wedge' and set out our latest assumptions for the long-run difference between the two measures.
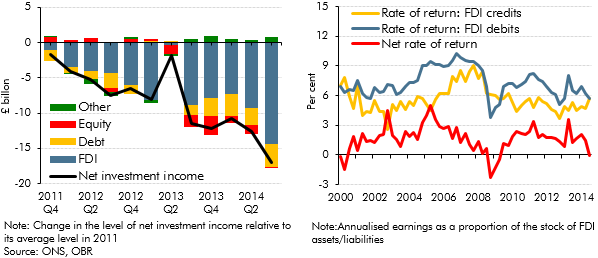
The data available at the time of our March 2015 Economic and fiscal outlook showed the current account deficit had worsened to around 6 per cent of GDP in the third quarter of 2014, one of the largest quarterly deficits on record. Much of the recent deterioration was down to the income balance moving into deficit, the drivers of which were discussed in this box.
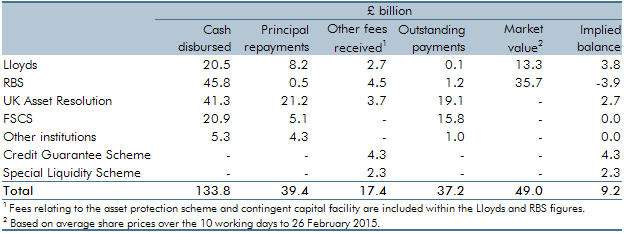
The Government undertook a number of interventions in the financial sector in response to the financial crisis and subsequent recession of the late 2000s. This box provided an update of the estimated net effect of them on the public finances as of March 2015.
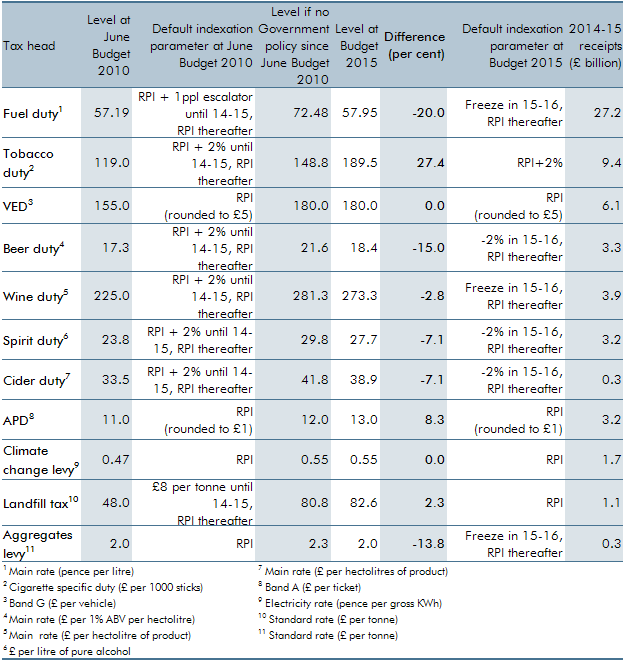
Our forecasts for excise and environmental duties assume that rates are indexed in line with default parameters. These parameters are set by the Government and are detailed at each Budget in the Treasury’s Policy costings document. The assumptions represent a source of economy and
policy-related uncertainty in our forecast. In this box, we looked back at how a selection of duty rates moved over the Parliament relative to the default uprating assumptions assumed in the OBR’s first forecast in June 2010.
policy-related uncertainty in our forecast. In this box, we looked back at how a selection of duty rates moved over the Parliament relative to the default uprating assumptions assumed in the OBR’s first forecast in June 2010.

In this forecast, there were two policy switches that shifted spending between RDEL and AME, which applied from 2015-16 onwards. This box outlined these changes and examined the subsequent impact these would have on our forecast.
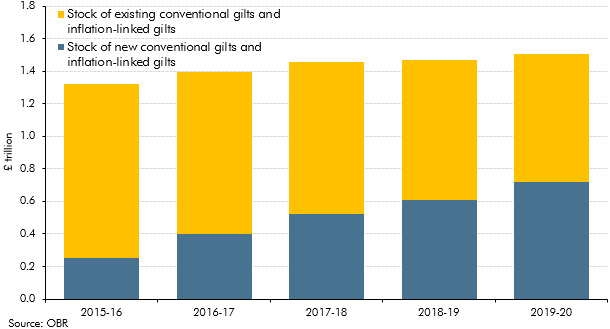
Our March 2015 Economic and fiscal outlook forecast highlighted large changes in our debt interest forecast since previous fiscal events and the added complexity that debt interest was expressed net of the effect of gilts held by the Bank of England Asset Purchase Facility (APF) associated with past quantitative easing. This box described how we produced the debt interest forecast and illustrated some of the sensitivities to which it was subject.
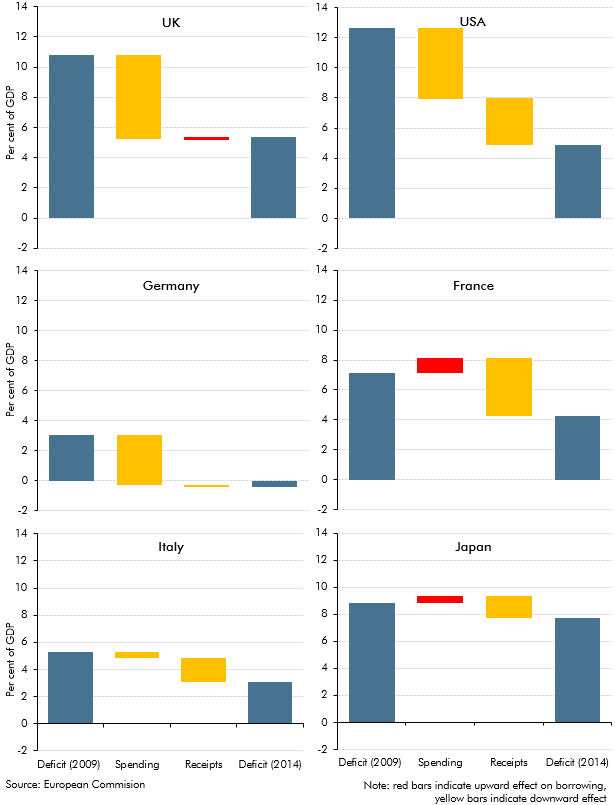
The UK budget deficit increased to a post-war high after the financial crisis and recession of the late 2000s. This box explored how the path and composition of deficit reduction in the UK over the subsequent 5 years compared to five other major economies.
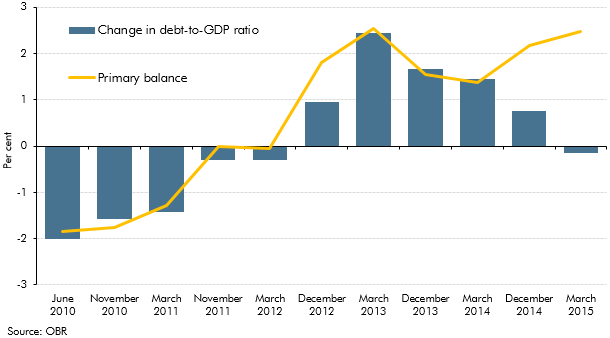
In our first June 2010 EFO, the debt-to-GDP ratio was forecast to fall by 2 per cent in 2015-16. This box explored how our debt-to-GDP forecast for 2015-16 evolved over time. It highlighted the contribution of the primary balance and the impact of other factors (including asset sales and the growth-interest differential) on the debt-to-GDP ratio forecast.
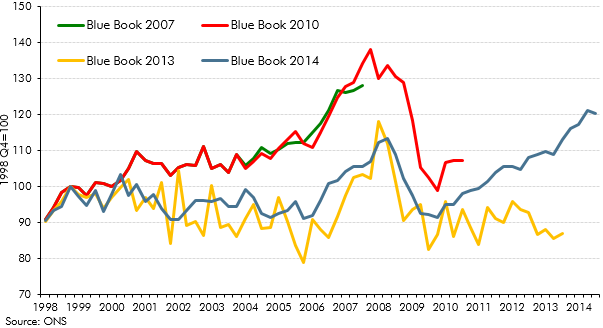
In recent years, historical path of business investment has been subject to significant revisions. This box discussed the revisions made to business investment estimates between 2007 and 2014. In Box 3.6 of our March 2014 Economic and fiscal outlook, we considered this issue from an international perspective.
Between 2012 and 2014, growth in the UK picked up, outpacing all other members of the G7. This box provided wider context for this strength in UK growth, comparing GDP, employment and productivity growth across G7 countries since 2008.
In each Economic and fiscal outlook we publish a box that summarises the effects of the Government’s new policy measures on our economy forecast. These include the overall effect of the package of measures and any specific effects of individual measures that we deem to be sufficiently material to have wider indirect effects on the economy. In our December 2014 Economic and Fiscal Outlook, we made adjustments to property transactions and residential investment in light of reforms to stamp duty land tax
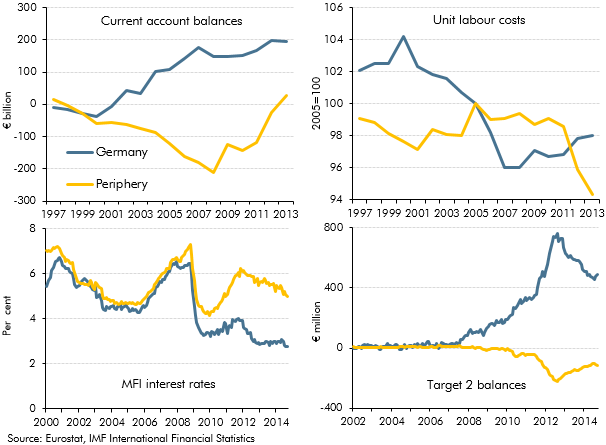
In the December 2014 Economic and fiscal outlook, we identified the adjustment in the euro area as a risk to our forecast. This box highlighted some of the key indicators that commentators were using to measure the progress of that rebalancing.
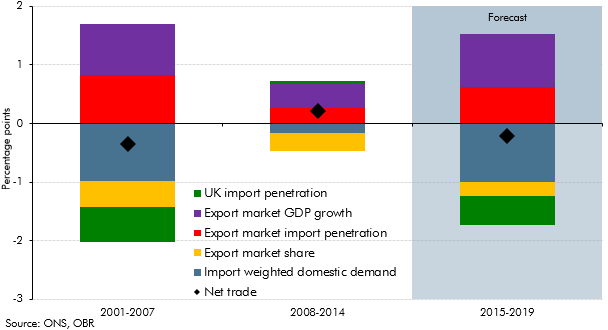
This box decomposed the net trade contribution to GDP growth into its various drivers, to illustrate the sources of the negative contribution in the seven years before the late-2000s recession, the positive contribution in the seven years after the recession and the negative contribution in the December 2014 forecast.
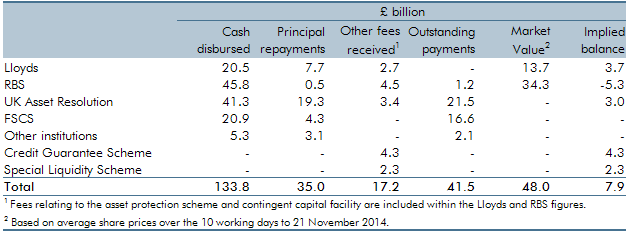
The Government undertook a number of interventions in the financial sector in response to the financial crisis and subsequent recession of the late 2000s. This box provided an update of the estimated net effect of them on the public finances as of December 2014.
This box evaluated anti-avoidance measures implemented between 2011-12 and 2013-14. The exercise confirmed that while these costings were subject to significant uncertainty, there was no evidence of systematic bias.
Public finances data are subject to regular classification and methodological changes. This box outlined the classification changes associated with the implementation of the new 2010 European System of Accounts (ESA10). Annex B of our March 2014 EFO explained these changes in more detail.
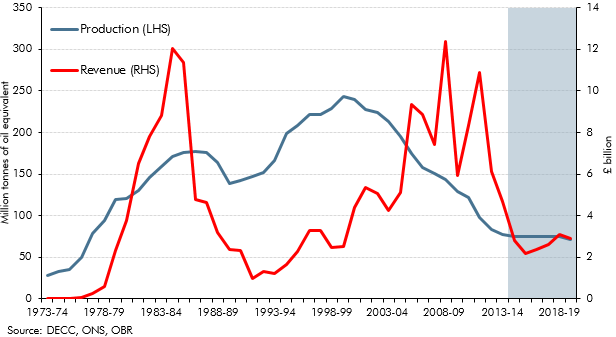
North sea oil and gas revenues have historically been volatile. This box showed how movements in revenues between the peaks and troughs since the early 1970s can be explained by drivers of taxable profits - the volume and price of production (which together provide a proxy for sales), the implied profit margin on those sales and the effective tax rate paid on those profits.
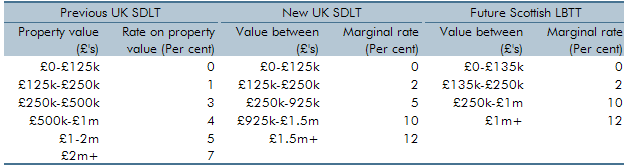
The Government announced substantial reforms to the residential stamp duty land tax (SDLT) system at Autumn Statement 2014. This box explored how the tax system changed and how these reforms were costed.
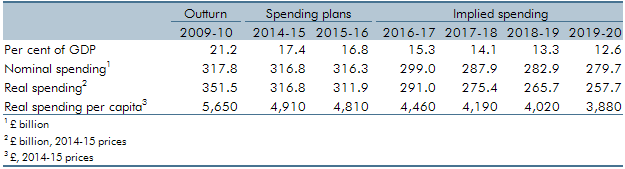
We were asked by our stakeholders whether we considered the implications for current spending on public services (RDEL) in our forecasts to be central, as we are tasked with producing a central forecast. This box outlined RDEL implied spending from 2016-17 to 2019-20 (years in which firm spending plans did not exist and RDEL levels were set by a government policy assumption). The box also examined the implied breakdown of RDEL by some of the main spending areas in 2019-20, in particular examining the implications of then-current government RDEL assumptions for public services spending that was not protected in some way.
In Chapter 4 of our December 2014 EFO, we discussed the fiscal outlook for 2014-15 to 2018-19. In this box, we discussed revisions we made to the forecast in light of reforms to incapacity and disability benefits. Spending on incapacity benefits was revised up by £0.7 billion a year on average between 2014-15 and 2018-19, largely reflecting a lower-than-expected number of Work Capability Assessments carried out by the Department for Work and Pension’s private contractors. On the basis of the latest evidence, spending on disability benefits was also revised up by £0.7 billion a year on average between 2014-15 and 2018-19. This was largely due to higher than expected success rates for new claims to the personal independence payment.
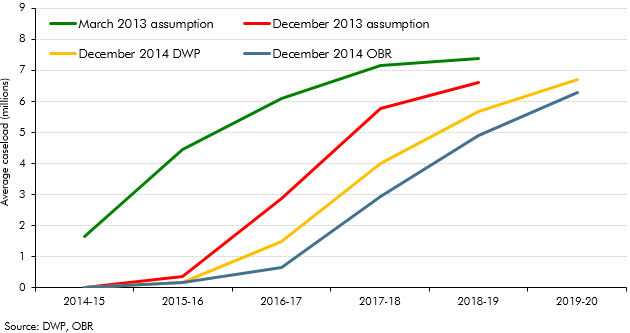
In Chapter 4 of our December 2014 EFO, we discussed the fiscal outlook for 2014-15 to 2018-19. In this box, we discussed the latest universal credit rollout plan following the 2014 universal credit business case. Whilst we agreed that the plan to fully rollout universal credit for jobseeker’s allowance cases by March 2016 was central, we decided that the migration plan for claimants of other legacy benefits was still highly uncertain and so implemented a six month delay to the plans for our forecast. This had the effect of reducing the volume of migrations in all years of the forecast but did not substantially alter the universal forecast given that it marginal to the legacy benefits.
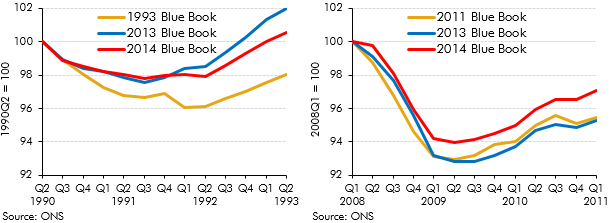
Revisions to National Accounts data are a normal part of the Blue Book process, which reconciles the different measures of GDP and incorporates information from annual data sources. The 2014 Blue Book contained particularly large changes because it was the first time that the National Accounts were published on an ESA10 accounting basis. This box set out some of the key changes in Blue Book 2014 and their impact on some of the key economy variables.
‘Computable general equilibrium’ (CGE) modelling is a tool for assessing the potential medium and long-term economic impact of policy changes. This box explored recent Government CGE studies of cuts to corporation tax and fuel duties alongside the potential impact of other recent tax rises and spending cuts.
This box explored the implications of the new 2010 European System of Accounts (ESA10) on our public finances forecast, ahead of its incorporation in our December 2014 EFO. Annex B of our March 2014 EFO explained these changes in more detail.
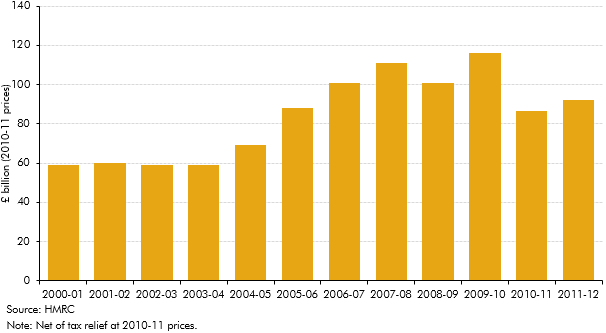
An additional rate of income tax of 50p for incomes over £150,000 was introduced in April 2010. Budget 2012 announced that this rate would be reduced to 45p from April 2013. This box explored how the incomes of those affected by this change evolved over this period - in particular the significance of forestalling and income shifting.
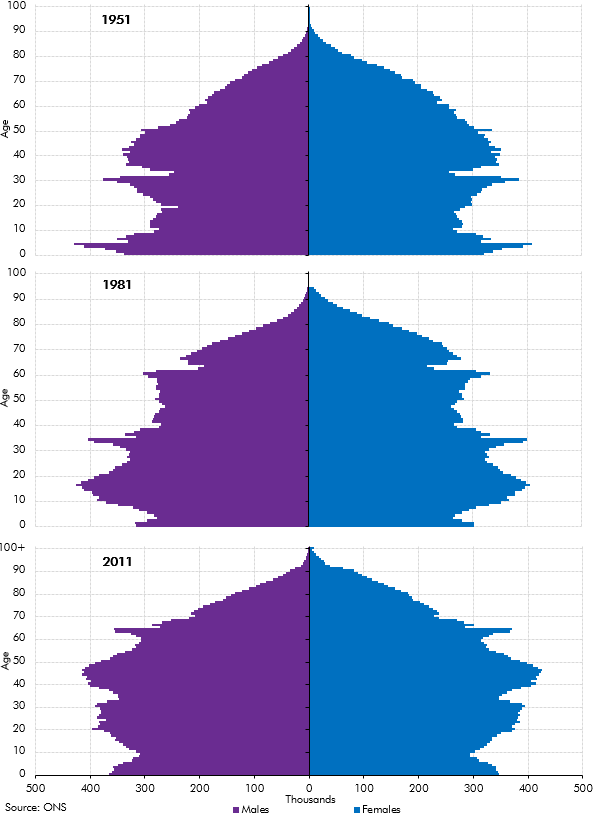
In our 2014 Welfare trends report, Chapter 3 reviewed the drivers of welfare spending. In this box we showed how the age structure of the population in England and Wales had evolved between the census years of 1951, 1981 and 2011. The post-war and 1960s baby-boom generations affect the dependency ratio in different ways over time, as these larger cohorts move from childhood to working adulthood and into retirement.
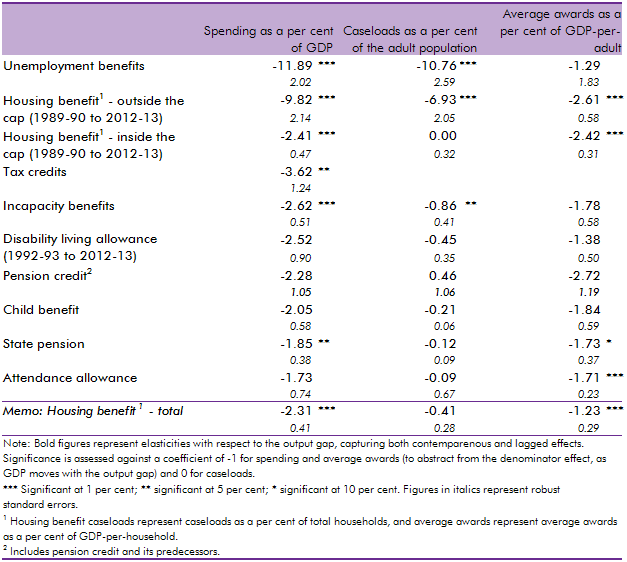
In our 2014 Welfare trends report, Chapter 4 reviewed the overall trends in welfare spending. In this box, we considered how responsive welfare spending is to the economic cycle by estimating the elasticity of benefits and tax credits spending as a share of GDP with respect to changes in the output gap (the difference between actual GDP and an estimate of its potential or underlying level). We found that the most counter-cyclical benefits have caseloads closely associated with the economic cycle whereas mildly counter-cyclical benefits are likely to only exhibit cyclicality due to spending varying less than GDP, thereby producing a denominator effect.
In our 2014 Welfare trends report, Chapter 4 reviewed the overall trends in welfare spending. In this box we discussed the latest Universal Credit (UC) forecast at the time of writing. This forecast assumed UC would roll-out slowly during 2014-15 and 2015-16 before accelerating in 2016-17 and 2017-18, by which time 5.8 million people were expected to be receiving the benefit. We highlighted that the roll out of UC had already been subject to previous delays and that the decision to produce a top-down UC forecast helped mitigate the uncertainties caused by delivery challenges. We then decomposed the marginal UC forecast into its constituent gross savings and gross costs forecasts.
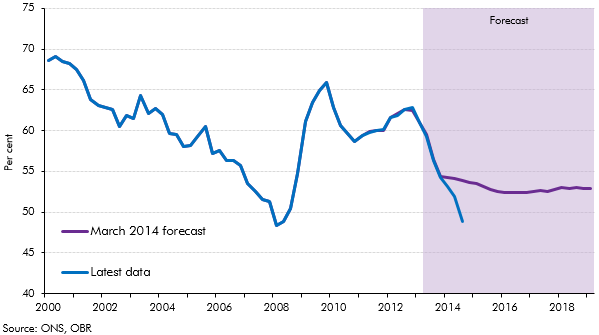
In our 2014 Welfare trends report, Chapter 8 considered spending on unemployed people. This box compared outturn data on unemployment and claimants of unemployment benefits to the levels implied by our March 2014 forecast. As the economy performed better than anticipated in our March 2014 forecast, the ratio of claimants of unemployed benefits to the Labour Force Survey (LFS) measure of unemployment deviated from our projections. This was largely due to a drop in the rate of inflows into unemployment benefits and a rise in the rate of outflows from unemployment benefits, though an increase in the number of people looking for jobs but not claiming unemployment benefits may have increased LFS unemployment and so been a contributing factor.
The European System of National and Regional Accounts (ESA 10) changed the arrangements for funded defined benefit pension schemes. The new approach required that the net liabilities of these schemes for the future costs incurred from past activities were calculated using commercial accounting concepts. This box provided a summary of the effects that the new treatment would have, as well as its relevance to the Whole of Government Accounts (WGA).
At Budget 2014, the Government announced a number of tax measures that increase the flexibility with which individuals can access their defined contribution (DC) pension assets. This box considered the effect of two possible sensitivities. First, the possibility that there would be more money flowing into the housing market, and second, that people could spend their pension pots relatively early in retirement, leading to greater reliance on income-related benefits.
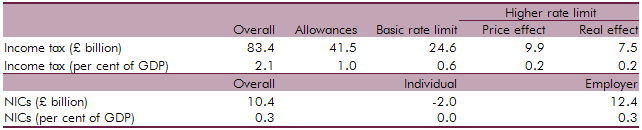
We updated our July 2013 analysis of fiscal drag on income tax and NICs to reflect new data, our latest assumptions and the effect of measures announced over the past year. This box outlined how fiscal drag effects income tax and NICs receipts and the long-term assumptions used.
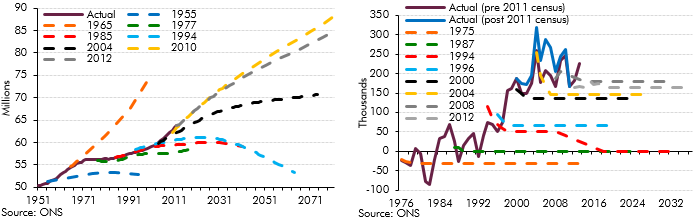
Population projections are subject to significant uncertainty, particularly over very long time horizons. This box outlined the error in successive population projections and the sources of error.
In Annex A of our 2013 Fiscal sustainability report, we reviewed the assumptions that we make about the fiscal effects of net migration. In this box from our 2014 Fiscal sustainability report we summarised the migration-related issues that we consider explicitly in our long-term projections, those that are implicit in the material we use to produce them, and, importantly, those issues we do not consider – either because of our modelling techniques or because they fall outside the remit that Parliament has set the OBR.
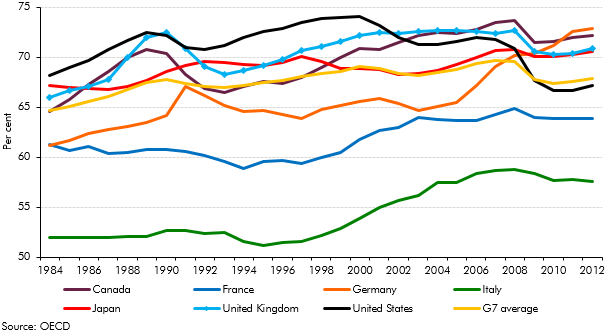
Earlier in the year, the Chancellor expressed an ambition “to have more people working than any of the other countries in the G7 group". This box compared countries employment rates and demonstrated the scope for labour market outcomes to differ substantially.
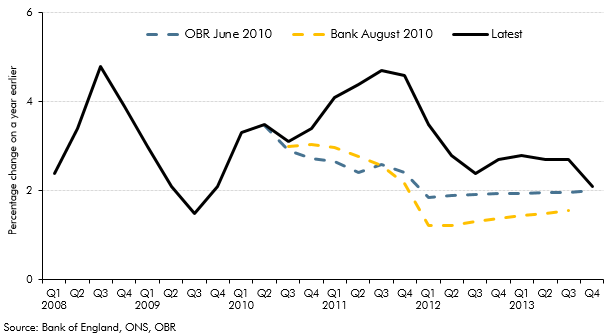
Each autumn, we publish our Forecast evaluation report (FER), a detailed examination of the performance of past economic and fiscal forecasts relative to the latest outturn data. This box discussed the OECD's and Bank of England's forecast errors, their explanations for these errors, and the lessons forecasters have learnt from the errors.
In the February 2014 Inflation Report the Bank of England published more information about its assessment of spare capacity. This box compared that assessment with our own output gap estimate at the time, highlighting some conceptual differences between the two.
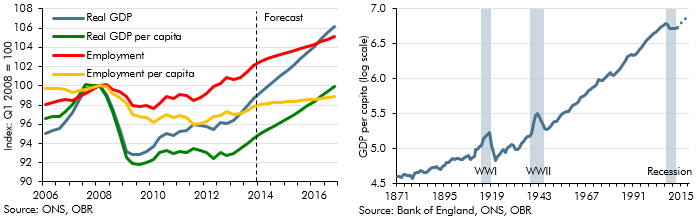
This box showed how growth in some of the key economy variables between 2010 and 2013 was lower when measured on a per capita basis. We also discussed our forecast for productivity growth at that time, given its importance in determining GDP per capita growth in the medium term.
In each Economic and fiscal outlook we publish a box that summarises the effects of the Government’s new policy measures on our economy forecast. These include the overall effect of the package of measures and any specific effects of individual measures that we deem to be sufficiently material to have wider indirect effects on the economy. In our March 2014 Economic and Fiscal Outlook, we made adjustments to inflation and business investment.
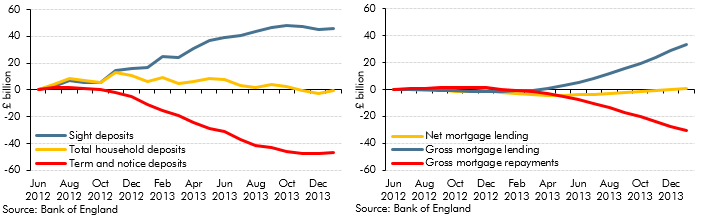
In 2013, households’ balances in ‘time deposit’ accounts (savings with fixed maturity) fell by £36 billion. This box outlined possible reasons for this by exploring the wider household savings behaviour. The cumulative change in annual deposit flows showed rapid increases in 'sight deposits'. This was possibly explained by narrowing spreads between 'time' and 'sight' deposit interest rates or normalisation of household investment behaviour. Changes in annual mortgage flows also suggested that revival of housing market activity could have been responsible for switching between deposit types. The ability of households to shift very large deposit balances over relatively short timeframes was one reason why the impact of savings and pensions measures discussed in Box 3.3 of the same EFO was subject to considerable uncertainty.
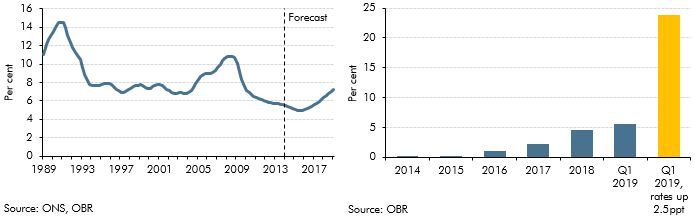
We expected debt servicing costs as a share of disposable income, or ‘income leverage’, to rise as our forecasts for house price inflation outstripped income growth and Bank Rate gradually increased. This box discussed the extent to which mortgage servicing costs were likely to increase over the forecast period and the implications of this for household behaviour, using information from the Bank of England/NMG survey.
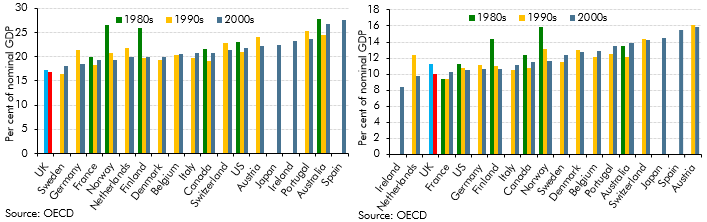
In the late-2000s recession, total investment in the UK fell by more than in other similarly-developed economies, but in the March 2014 forecast we expected it to pick up strongly. This box considered possible reasons for the previous weakness and compared the investment-to-GDP ratio in our forecast against OECD averages.
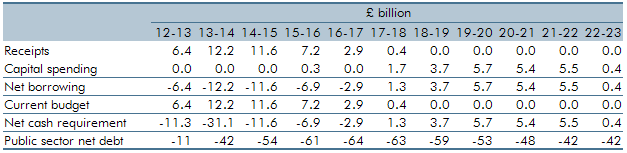
The Bank of England’s purchases of gilts under its quantitative easing (QE) programme are undertaken by its subsidiary, the Asset Purchase Facility (APF). Since late 2012-13, the Exchequer received excess cash held in the APF on an ongoing basis. This box summarised the approach used to estimate the fiscal impact of projected APF flows and the changes in these projections since our December 2013 Economic and fiscal outlook forecast. It also highlighted the large uncertainty about the timing and pace of quantitative easing (QE) unwinding.
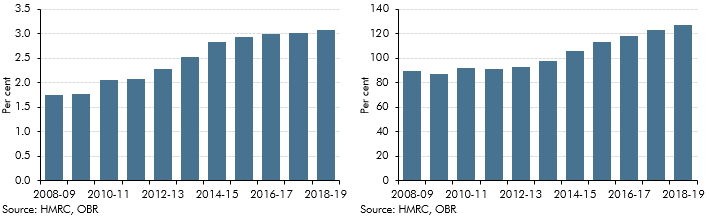
Receipts from capital gains tax (CGT), inheritance tax (IHT) and stamp duty land tax (SDLT) were expected to rise sharply over our March 2014 forecast. This box set out the drivers behind that rise, in particular the impact of rising effective tax rates.
The Government undertook a number of interventions in the financial sector in response to the financial crisis and subsequent recession of the late 2000s. This box provided an update of the estimated net effect of them on the public finances as of March 2014.
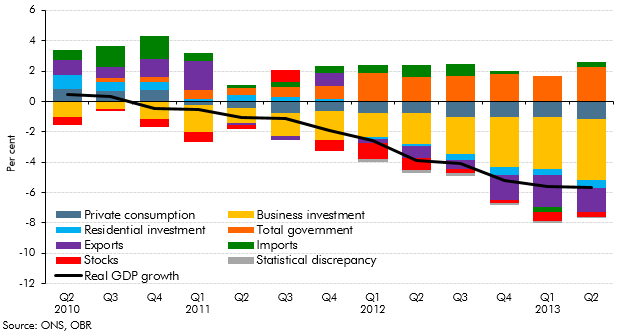
Each autumn, we publish our Forecast evaluation report (FER), a detailed examination of the performance of past economic and fiscal forecasts relative to the latest outturn data. This box discussed cumulative errors in our June 2010 real and nominal GDP forecasts in light of the significant revisions made by the ONS to real GDP growth between mid-2010 and mid-2012, and the implications this has had for the performance of our June 2010 public sector borrowing forecast
On 7 August 2013, the Bank of England announced that it would not consider raising Bank Rate, then at 0.5 per cent, until the unemployment rate had fallen to 7.0 per cent. However, the Bank also detailed certain conditions, which if breached, would make it consider tightening monetary policy sooner. This box, from our December 2013 Economic and fiscal outlook, examined where our forecast stood in relation to these conditions.
In each Economic and fiscal outlook we publish a box that summarises the effects of the Government’s new policy measures on our economy forecast. These include the overall effect of the package of measures and any specific effects of individual measures that we deem to be sufficiently material to have wider indirect effects on the economy. In our December 2013 Economic and Fiscal Outlook, we adjusted our inflation forecast to reflect changes in fuel duty.
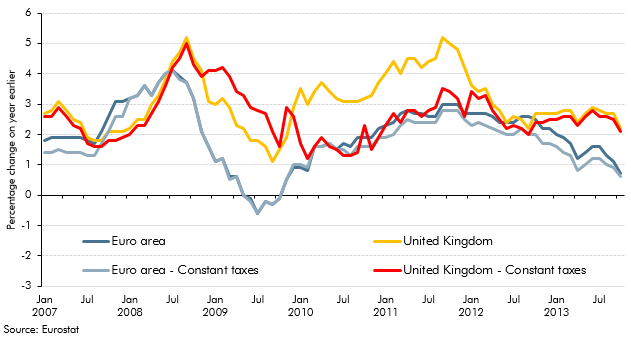
From late-2008 to 2013, the rate of CPI inflation in the UK had been consistently higher than the euro area equivalent measure. This box, published in our December 2013 Economic and fiscal outlook, outlined a number of factors which had contributed to the divergence including exchange rate movements, changes in VAT and utility prices.
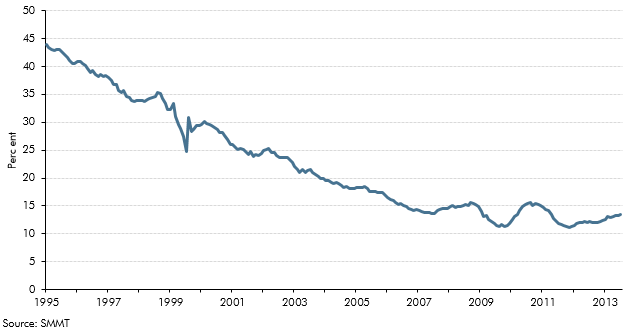
Spending on cars in the UK has grown strongly, accounting for nearly a third of household consumption growth since the third quarter of 2011. This growth was facilitated by car finance, which contributed to strong growth in unsecured credit. This box showed trends in domestic share of car production and contribution of domestic and imported cars to household consumption growth over time. Together, they showed that while domestic car consumption was a good indicator of consumer confidence, and car trade in isolation helped reduce the UK's trade deficit, the overall effect on the economy was less positive.
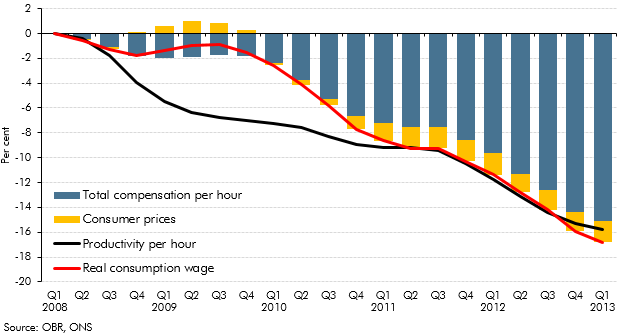
In the years following the late-2000s recession, productivity growth remained subdued, which would be expected to lead to lower wages. This box showed that while the real product wage grew more strongly than productivity growth since 2008, real consumption wage growth was weaker.
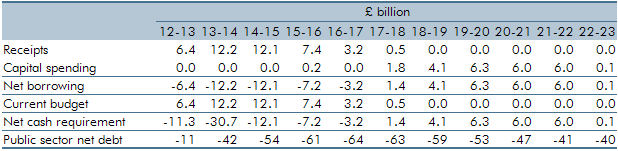
In 2012-13, excess cash held in the Bank of England’s Asset Purchase Facility (APF) has been transferred to the Exchequer on an ongoing basis requiring us to forecast future flows. This box outlined the forecasted APF flows and the changes in these estimates since March.
Public finances data are subject to regular classification and methodological changes. This box outlined potential classification changes ahead of the PSF review. Annex B of our March 2014 EFO explained these changes in more detail.
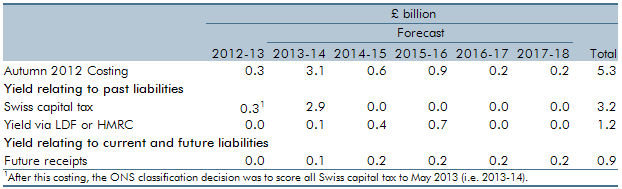
In recent years, the UK has entered into tax agreements with a number of offshore centres. This box evaluated the Autumn 2012 costing for the UK-Swiss tax agreement. More information can be found in Working paper No.8: Anti-avoidance costings: an evaluation
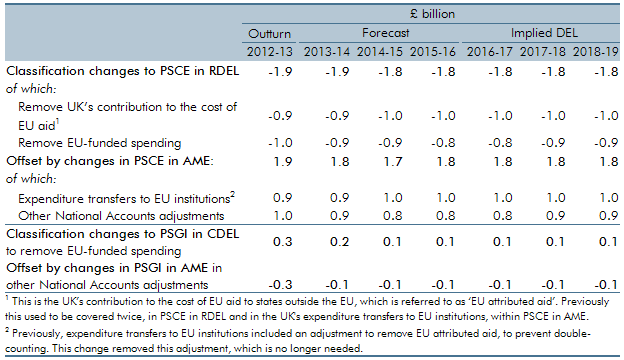
In this forecast, we switched to using spending data from a new source, which was the Treasury’s new public spending database known as OSCAR (short for their ‘Online System for Central Accounting and Reporting’). This led to some switches between DEL and AME, which we treated as classification changes, because they affected our presentation of DEL and AME for all years, including outturn and forecasts. This box explained those changes.
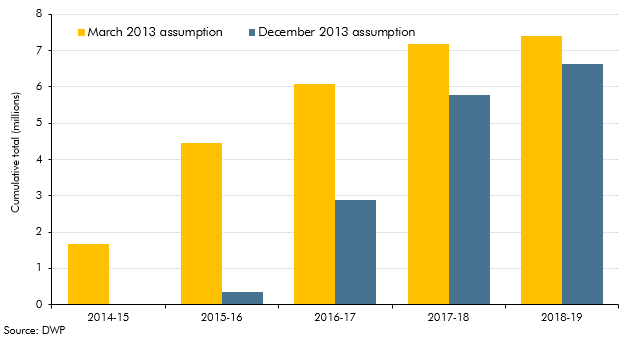
In Chapter 4 of our December 2013 EFO, we discussed the fiscal outlook for 2013-14 to 2017-18. In this box, we discussed the delays to the Government’s universal credit rollout plan. Compared to the March 2013 rollout plan, large increases in the universal credit caseload were assumed to start later than previously planned in 2016 and 2017. Fewer people were also expected to be on universal credit at the end of the forecast horizon, with 700,000 fewer claimants assumed to have migrated by the end of 2017-18 compared to the March 2013 rollout plan. We explained that the changes to the rollout schedule was a key source of change in the profile of our forecast relative to March 2013, with lower spending up to 2015-16.
The Government undertook a number of interventions in the financial sector in response to the financial crisis and subsequent recession of the late 2000s. This box provided an update of the estimated net effect of them on the public finances as of December 2013.
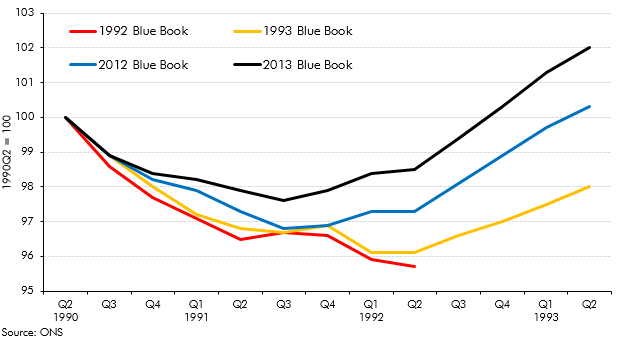
Revisions to National Accounts data are a normal part of the Blue Book process, which reconciles the different measures of GDP and incorporates information from annual data sources. This box explored how the estimated path of the 1990s recession and recovery evolved from estimates made in the 1992 Blue Book to estimates made in the 2013 Blue Book.
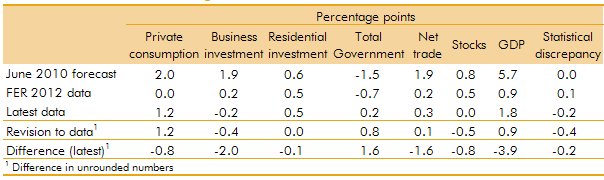
In our 2012 Forecast Evaluation Report, we noted that nominal GDP had held up closer to our June 2010 forecast than real GDP, helping to explain why our fiscal forecasts out to 2011-12 had remained broadly on track. This box in our 2013 Forecast Evaluation Report discussed how this assessment changed in light of revisions to GDP data. While nominal GDP now appeared to be weaker than forecast, the relatively tax-rich components - such as nominal consumption and wages and salaries - held up relatively well.
To estimate the impact of a measure or package on the economy, we use a set of fiscal multipliers. This box outlines some recent research on the size of multipliers, how the multiplier varies during the economic cycle and how multipliers 'taper' over time.
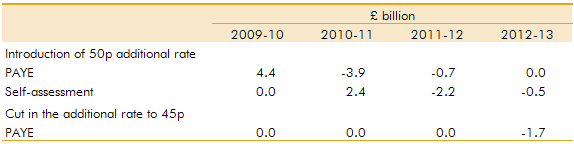
An additional rate of income tax of 50p for incomes over £150,000 was introduced in April 2010. Budget 2012 announced that this rate would be reduced to 45p from April 2013. This box explored how incomes were shifted (forestalled) in response to these policy changes
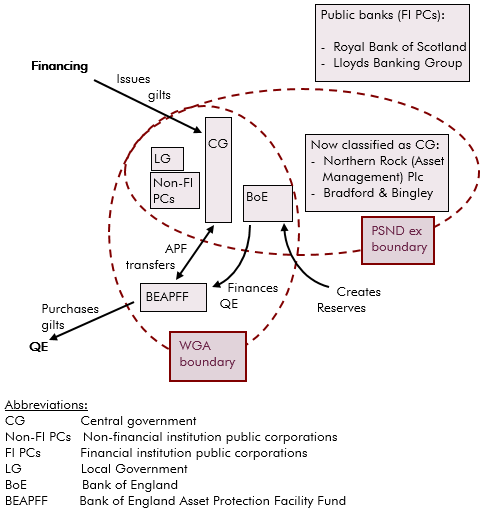
In 2013 the National Accounts measure of PSNB and PSND widened to include Bradford and Bingley and Northern Rock (Asset Management), and also included the APF transfers from the BEAPFF to central government. This box explained how the QE and APF transactions are treated in WGA and in the National Accounts, and the differences between them.
The ONS updates its population projections every two years based on mid‑year population estimates but every ten years it can draw on the latest census results. Census 2011 suggested that there were around half a million more people in the UK in 2011 than assumed in the population projections at the time, among other compositional changes. This box outlined some of the key findings from the census data and the impact this might have on our future projections.
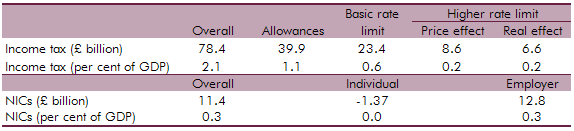
We updated our 2012 analysis of fiscal drag on income tax and NICs to reflect new data, our latest assumptions and the effect of measures announced over the past year. This box outlined how fiscal drag effects income tax and NICs receipts and the long-term assumptions used.
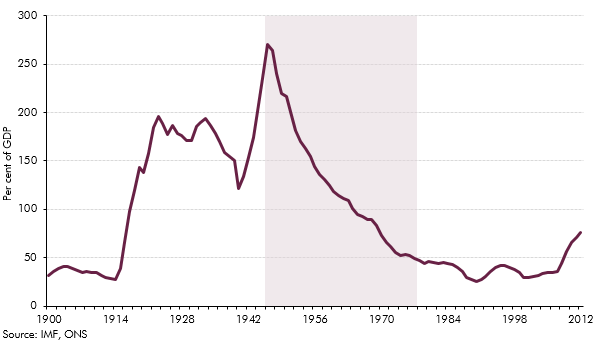
In assessing indicators of sustainability we examined the role of the gap between the real interest rate on government debt and the long-run growth rate of the economy. This box outlined the reasons behind Post-World War II debt reduction.
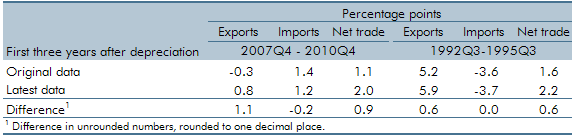
In each Economic and fiscal outlook we publish a box that summarises the effects of the Government’s new policy measures on our economy forecast. These include the overall effect of the package of measures and any specific effects of individual measures that we deem to be sufficiently material to have wider indirect effects on the economy. In our March 2013 Economic and Fiscal Outlook, we made adjustments to our forecasts of real GDP, business investment and inflation
In early OBR forecasts we estimated a significant negative output gap following the late-2000s recession, which we did not expect to have closed by the end of the forecast horizon. Our March 2013 forecast implied that potential output would be 14.6 per cent below an extrapolation of its pre-crisis trend after five years, with actual output a further 2.3 per cent below that. This box examined the implications of that forecast, as well as the fiscal implications of some possible alternative assumptions.
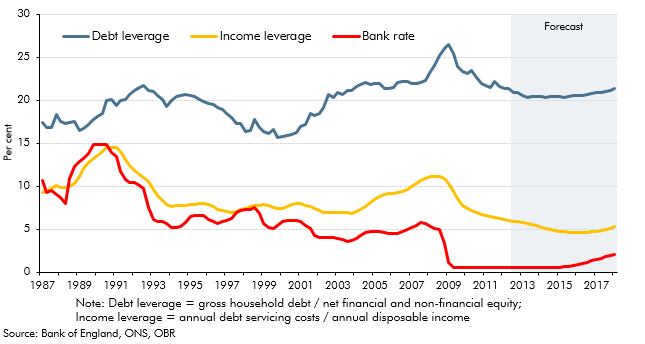
The household saving ratio continued to rise in 2012. This box explored the possible reasons for this, considering evidence from the latest available NMG household survey. The box also discussed the implications for household balance sheets, noting that in aggregate households appeared to have used higher saving to finance accumulation of more financial assets, rather than paying down debt.
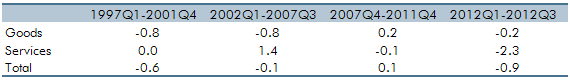
Exports fell during 2012, partly reflecting lower growth in UK export markets and a rise in sterling, although part of that fall was unexplained. This box looked at some past trends in the composition of exports to offer some explanation for that weakness, highlighting in particular the fall in financial services exports, and compared this against trends seen in the US.
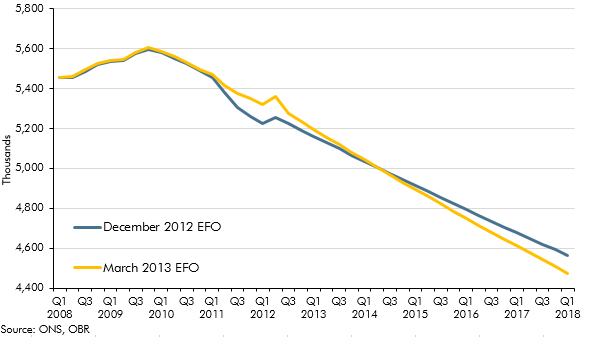
Our general government employment (GGE) forecast is based on projections of the growth of the total government paybill and paybill per head, which is in turn based on the Government's latest spending plans. In this box we compared our GGE forecast against the outturn data since the start of the 2010 Spending Review period. This allowed some assessment of how public sector employers were progressing with their intended workforce reduction and how much adjustment would still be required.
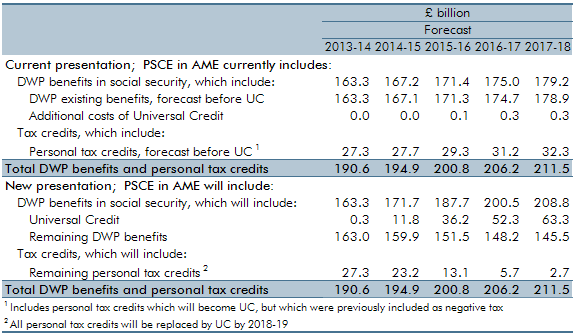
In Chapter 4 of our March 2013 EFO, we discussed the fiscal outlook for 2013-14 to 2017-18. In this box, we introduced a new marginal cost presentation of the universal credit forecast and also outlined contributing factors to changes in the forecast. These factors included policies announced at the 2012 Autumn Statement and changes to a number of the universal credit policy parameters as well as refinements to the methodology and assumptions used to forecast universal credit. The analysis in this box has since been superseded by developments in the universal credit forecast.
The Government undertook a number of interventions in the financial sector in response to the financial crisis and subsequent recession of the late 2000s. This box provided an update of the estimated net effect of them on the public finances as of March 2013.
The Whole of Government Accounts (WGA) contains information on future fiscal liabilities that are relevant for our forecast. This box explained how we ensured that those future liabilities reported in the WGA were fully reflected in our forecasts, where those liabilities were expected to affect the public finances.
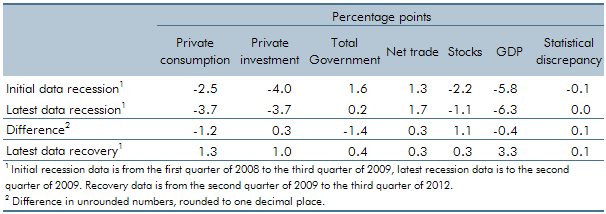
Revisions to National Accounts data are a normal part of the Blue Book process, which reconciles the different measures of GDP and incorporates information from annual data sources. This box explored the different picture of the late 2000s recession and recovery in light of the 2012 Blue Book.
In October 2011, we published our first Forecast evaluation report (FER). This box summarised the key findings, including a discussion of weaker than expected GDP growth and why, despite this, public sector borrowing has fallen broadly as we expected it would.
Our latest estimates of the output gap - which extended up to the third quarter of 2012 - implied a narrowing of the output gap since our previous forecast, despite actual output having remained broadly flat. Given the strength in the labour market over the period suggested a sharp fall in trend total factor productivity (TFP). This box set out the methodology behind that assessment, based on a production function approach that allowed us to separate out productivity growth into contributions from capital deepening and TFP.
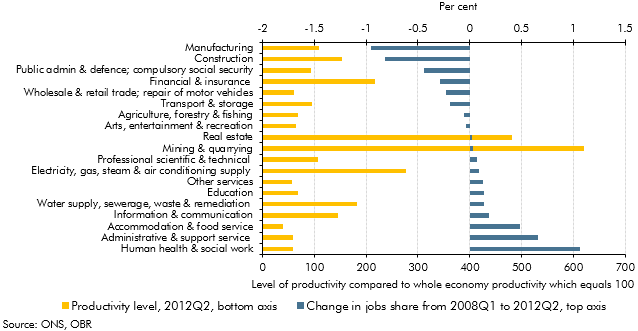
Productivity growth since the late-2000s recession has been relatively weak. This box set out some proposed explanations for that weakness, including measurement issues, lower investment, compositional effects, labour market factors and impaired financial markets. Most commentators believed that some combination of these factors was likely to be responsible. The relative importance of these factors also has implications for the extent to which the shortfall was believed to be demand or supply-related.
In each Economic and fiscal outlook we publish a box that summarises the effects of the Government’s new policy measures on our economy forecast. These include the overall effect of the package of measures and any specific effects of individual measures that we deem to be sufficiently material to have wider indirect effects on the economy. In our December 2012 Economic and Fiscal Outlook, we made adjustments to our forecasts of real GDP, inflation and property transactions
The Funding for Lending Scheme (FLS) was launched by the Bank of England and the Government in July 2012 to encourage banks and building societies to expand their lending by providing funds at lower rates than prevailing market rates. This box discussed the uncertainties associated with the transmission mechanism of this scheme and the possible impact on real GDP.
The Financial Policy Committee (FPC) was set up after the financial crisis to oversee the stability of the financial system. This box discussed the specific macro-prudential tools the FPC can apply and their potential implications for the economy and our forecasts.
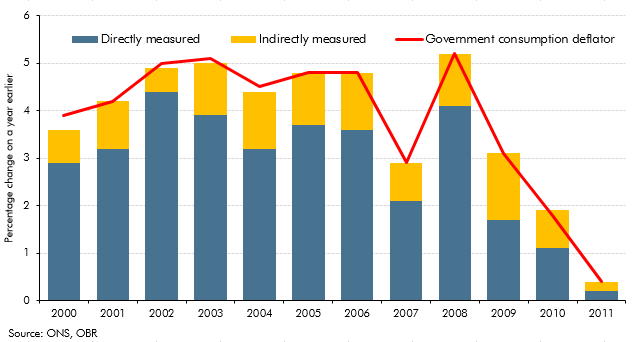
In the two years before our December 2012 forecast, real government consumption held up more than we had expected, with reductions in nominal government consumption affecting prices to a greater extent than we forecast. This box set out how these outturns would have been affected by the way the Office for National Statistics measures real government consumption, a large part of which is based on 'direct' measures of government activity.
In 2012 the ONS carried out a range of methodological development work relating to consumer prices indices. This box summarised some of the key elements, including work addressing the 'formula effect' which had made an increasing contribution to the CPI-RPI 'wedge' in 2010 and 2011. This box also discussed ONS analysis and recommendations from Consumer Prices Advisory Committee on the appropriate measurement of owner occupiers’ housing (OOH) costs and their inclusion in a new index of consumer prices.
In recent years, the government consumption deflator had been weaker than we expected. This box set out our assumption that the weakness of the government consumption deflator was likely to persist over the forecast period. The box also reviewed the outlook for the household consumption deflator and explained our assumption that this would be broadly equal to CPI inflation in the long run. Taken together with our assumptions for other deflators, these assumptions implied a medium-term GDP deflator growth assumption of 2 per cent, revised down from a previous assumption of 2.5 per cent
Our general government employment (GGE) forecast is based on projections of the growth of the total government paybill and paybill per head, which is in turn based on the Government's latest spending plans. In this box we compared our GGE forecast against the outturn data since the start of the 2010 Spending Review period. This allowed some assessment of how public sector employers were progressing with their intended workforce reduction and how much adjustment would still be required.
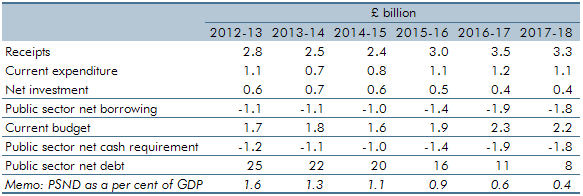
During the financial crisis, both Bradford & Bingley (B&B) and Northern Rock (Asset Management) (NRAM) were transferred to public ownership. The ONS has announced that it will reclassify both bodies into the central government sector. This box outlined the impact of the reclassification on our fiscal forecast.
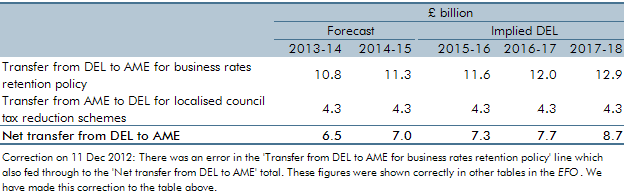
In this forecast there were two policy switches that shifted spending between RDEL and AME, which applied from 2013-14 onwards. These policies were for the 50 per cent retention of business rates for local authorities in England, and for localised council tax reduction schemes. This box outlined these changes and examined the subsequent impact these would have on our forecasts.
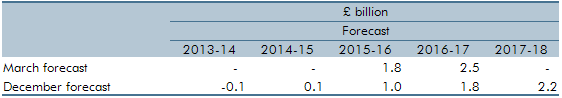
In Chapter 4 of our December 2012 EFO, we discussed the fiscal outlook for 2012-13 to 2016-17. In this box, we discussed changes to the provisional universal credit forecast that was included in our March 2012 EFO. Changes to the forecast were due to a number of factors, including policies announced at Budget 2012 and finalisation of policy parameters in universal credit as well as .refinements to the methodology and assumptions used to forecast universal credit. We also discussed the main uncertainties in the forecast, which largely related to the unpredictability given the scale of the policy. The analysis in this box has since been superseded by developments in the universal credit forecast, though many of the key uncertainties remain.
The Government undertook a number of interventions in the financial sector in response to the financial crisis and subsequent recession of the late 2000s. This box provided an update of the estimated net effect of them on the public finances as of December 2012.
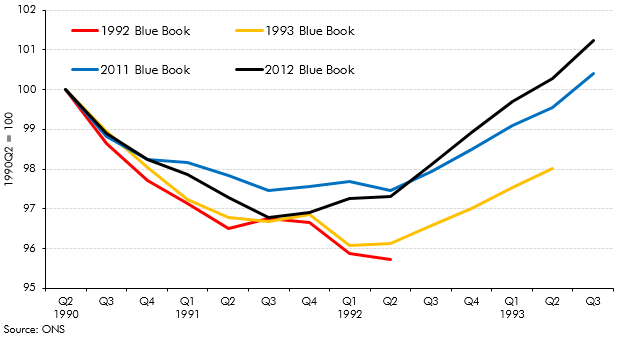
Each year, the ONS publishes the National Accounts ‘Blue Book’. The revisions it contains are often a source of revisions to our subsequent forecasts. In this box, we illustrated the scope for history to be rewritten by exploring how the reported pattern of the recession and recovery of the early 1990s had evolved between the Blue Books published shortly after the recession and the most recent Blue Books available at the time.
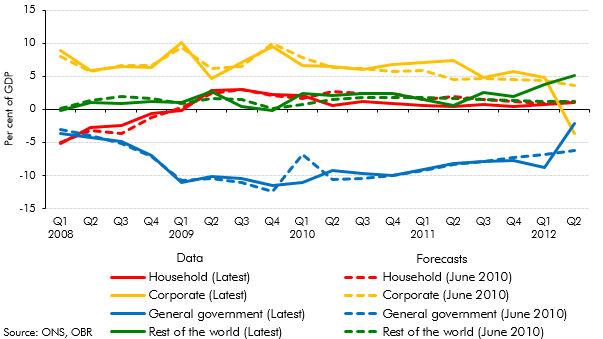
An alternative way to view the sectoral decomposition of the economy is to look at the financial balances of households, firms, government and the rest of the world. This box explored net lending by sector from 2008 to 2012, and how this compared with our June 2010 forecast
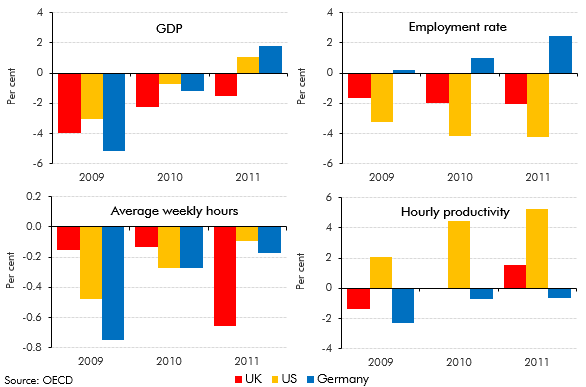
The UK, the US and Germany all saw broadly similar falls in GDP over 2009, but their labour markets responded differently. This box discussed these differences and compared the behaviour of employment, hours and productivity over this period.
To estimate the impact of a measure or package on the economy, we use a set of fiscal multipliers. This box outlined some recent research on the size of multipliers and how the multiplier varies during the economic cycle.
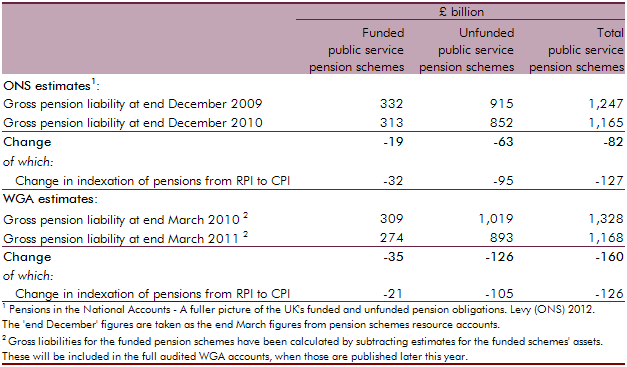
In April 2012, the Office for National Statistics (ONS) published the first set of new statistics on the total gross liabilities of UK pension providers, including the UK government. This box explored how the ONS’ pension liability estimates were calculated for public service pensions and state pensions, and compared the public service estimate to the Whole of Government Accounts (WGA) methodology.
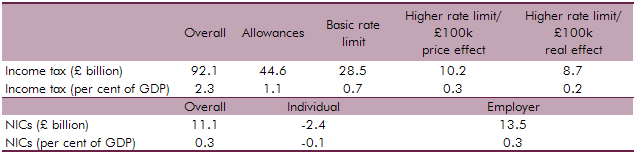
We updated our 2011 analysis of fiscal drag on income tax and NICs to reflect new data, our latest assumptions and the effect of measures announced over the past year. This box outlined how fiscal drag effects income tax and NICs receipts and the long-term assumptions used.
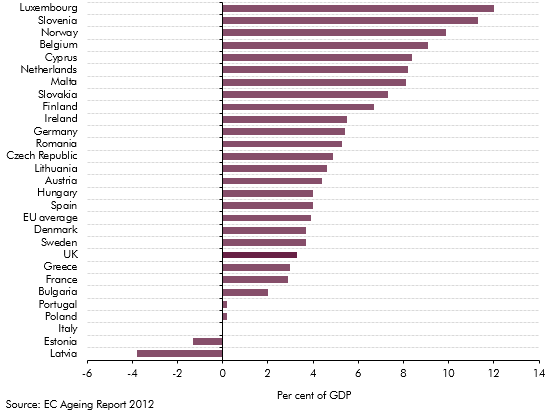
The European Commission (EC) produces its own analysis of ageing pressures for member states every three years. This box contrasted the forecast made by the EC and the OBR for UK age related spending such as pensions, health care and long-term care.
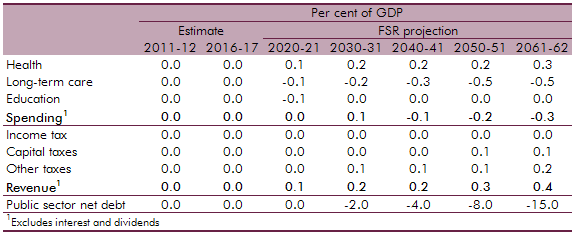
The National Institute of Economic and Social Research (NIESR) produce generational accounts estimates for the UK. The OBR produces its own long-term projections by using profiles that break down spending by year of age. This box compared the differences in public finance forecasts between the OBR and the NIESR with the latter implying a lower level of net debt by 2061‑62.
Some researchers argue that the fiscal position is unsustainable if future generations are left to make a larger net contribution to the government’s finances than today’s generation. Generational accounts such as those produced by the National Institute of Economic and Social Research (NIESR) consider intergenerational equity. This box analysed this as a measure of assessing fiscal sustainability.
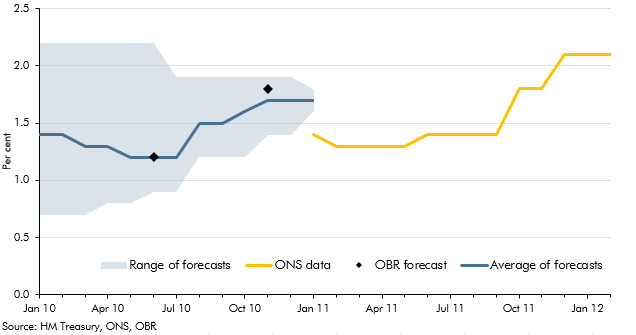
Both forecasts and National Accounts data are subject to revision. This box discussed how outside forecasts for growth in 2010 evolved through that year and compared these forecasts with ONS outturns, from the ONS' first estimate made in January 2011 through to their latest available estimate in February 2012.
In each Economic and fiscal outlook we publish a box that summarises the effects of the Government’s new policy measures on our economy forecast. These include the overall effect of the package of measures and any specific effects of individual measures that we deem to be sufficiently material to have wider indirect effects on the economy. In our March 2012 Economic and Fiscal Outlook, we made adjustments to our forecasts of real GDP, business investment and inflation.
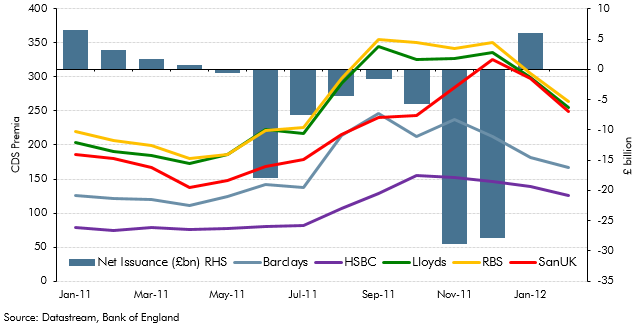
Central banks around the world launched two significant new market operations at the end of 2011. This included a program to provide liquidity support to the global financial system, as well as longer-term refinancing operations by the ECB. This box analysed the impact of these operations on the UK financial sector by looking at net capital issuance and five-year credit default swap (CDS) premia of UK banks. In light of these developments, we made adjustments to our forecast of CDS premia in our March 2012 forecast.
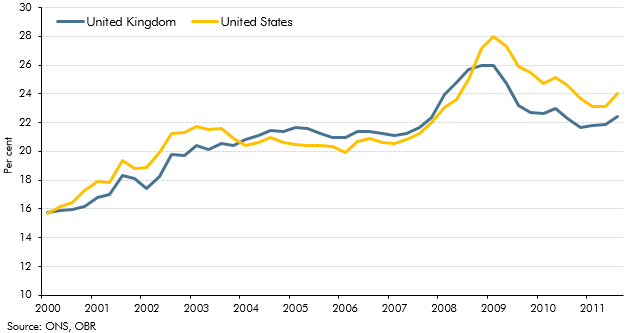
The path of the household debt-to income ratio since the crisis had led outside commentators to conclude that household deleveraging had further to run in the UK than the in the US. This box discussed some of the limitations of debt-to-income as a measure of leverage. An alternative measure is the debt to equity ratio - which takes into account both household assets and liabilities - which indicated that household leverage had fallen more slowly in the US than in the UK since the crisis.
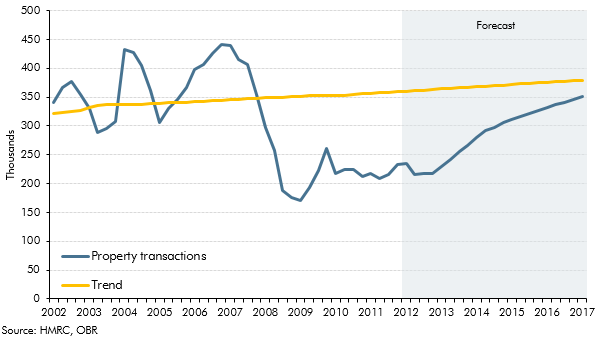
Residential property transactions fell sharply in 2008 as the availability of mortgage finance fell and stricter credit standards were introduced. This box explored recent trends in transactions and discussed our medium-term forecast, which is determined by our projection of average rate of turnover in the housing market. In our March 2012 forecast we expected the level of transactions to remain around 20 per cent below the pre-crisis peak by the end of the forecast period.
Our general government employment (GGE) forecast is based on projections of the growth of the total government paybill and paybill per head, which is in turn based on the Government's latest spending plans. In this box we compared our GGE forecast against the outturn data since the start of the 2010 Spending Review period. This allowed some assessment of how public sector employers were progressing with their intended workforce reduction and how much adjustment would still be required.
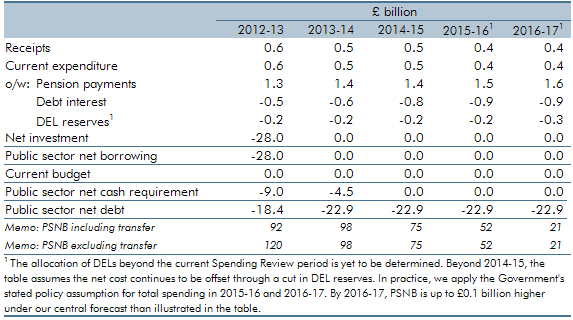
The Government announced that it intends to take on Royal Mail’s historic pension deficit with effect from April 2012. This box explored how the transfer of the relevant assets and liabilities will impact the public sector finances.
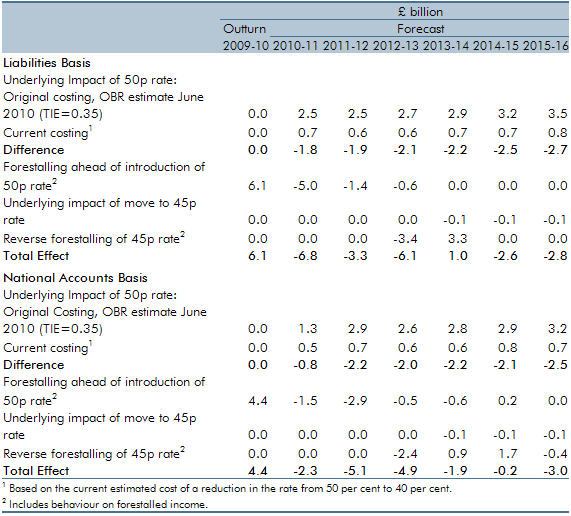
An additional rate of income tax of 50 per cent for incomes over £150,000 was introduced in April 2010. Budget 2012 announced that this rate would be reduced to 45 per cent from April 2013. This box set out how the Budget 2012 measure was costed, in particular the assumptions we made around behavioural responses and income shifting. Box 3.2 of our 2014 Forecast evaluation report reviewed this costing in detail.
The Government undertook a number of interventions in the financial sector in response to the financial crisis and subsequent recession of the late 2000s. This box provided an update of the estimated net effect of them on the public finances as of March 2012.
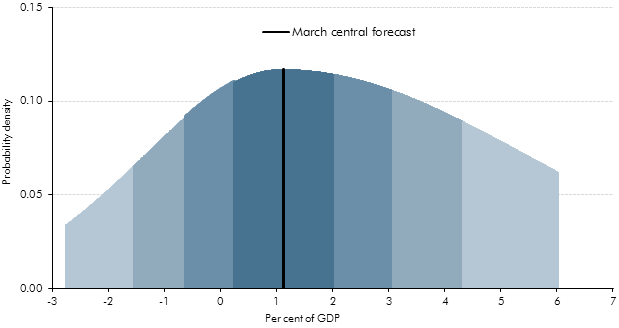
This box set out the methodology behind our PSNB fan charts. Briefing paper no.4: 'How we present uncertainty' sets out this methodology in more detail.
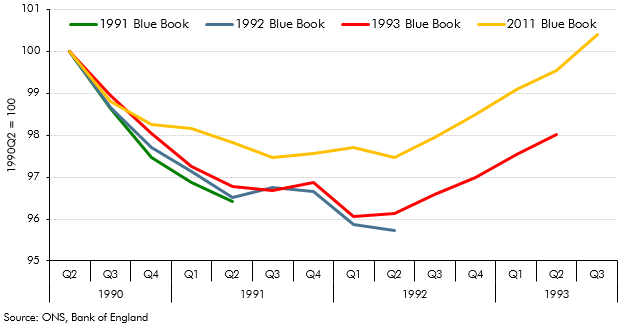
Revisions to National Accounts data are a normal part of the Blue Book process, which reconciles the different measures of GDP and incorporates information from annual data sources. This box explored how the estimated path of the 1990s recession and recovery evolved from estimates made in the 1992 Blue Book to estimates made in the 2011 Blue Book.
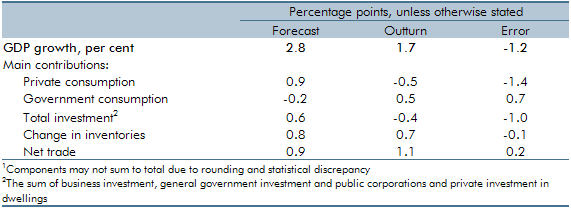
UK GDP had grown less quickly in 2010-11 than the OBR forecast in June 2010. This box decomposed the forecast error by expenditure component and discussed possible explanations, including the external inflation shock.
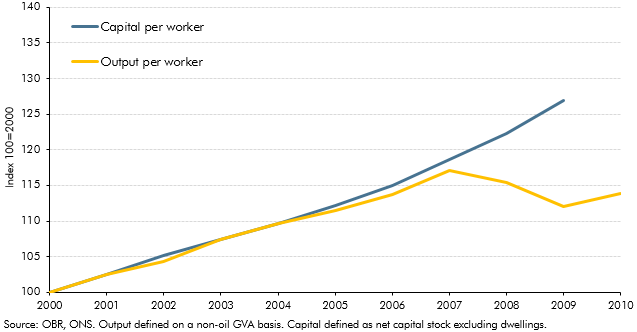
Potential output growth had been relatively weak in the period following the late-2000s recession. This box discussed some possible reasons, noting that indicators available at the time did not indicate a structural deterioration in the labour market.
In each Economic and fiscal outlook we publish a box that summarises the effects of the Government’s new policy measures on our economy forecast. These include the overall effect of the package of measures and any specific effects of individual measures that we deem to be sufficiently material to have wider indirect effects on the economy. In our November 2011 Economic and Fiscal Outlook, we made adjustments to our forecasts of inflation and property transactions.
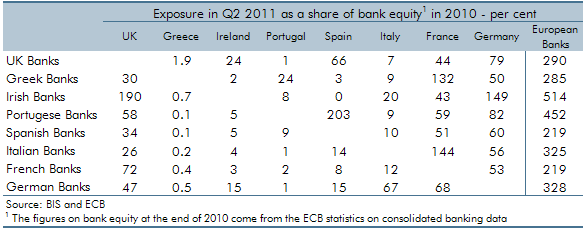
In the years following the financial crisis the euro area faced a sovereign debt crisis characterised by high government debt, poor confidence in sovereign solvency and rising risk premiums on government securities. This box considered the main channels through which an intensification of the crisis could affect the UK economy, including weaker trade, tighter credit conditions, higher domestic government borrowing costs and possible financial system impairment.
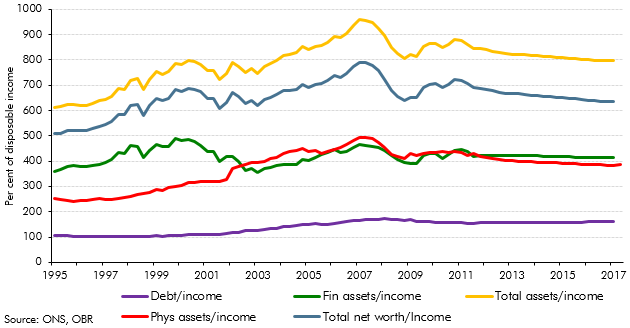
Our November 2011 forecast implied that households would take on around £480 billion of additional debt over the forecast period. This box discussed the implications of this for the household balance sheet, noting that a large part of the increase in household debt reflects borrowing for the purchase of assets. The box also discussed the downward revision in our household debt forecast since our previous EFO, which was largely accounted for by a combination of higher saving and a weaker housing market outlook.
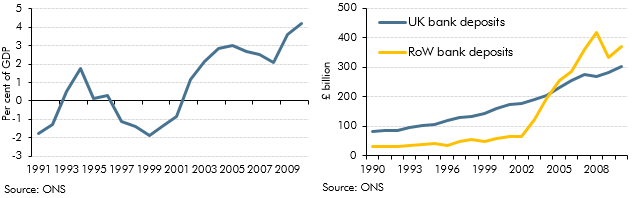
The corporate sector had run a significant surplus of profits over investment since 2003, and this surplus rose sharply following the crisis. This box explored some of the possible reasons for this, including the possibility that businesses may have used this to build up a buffer against future shocks. The box also discussed the uncertainties around the existing data, which may have overstated corporates' holdings of cash reserves.
Our general government employment (GGE) forecast is based on projections of the growth of the total government paybill and paybill per head, which is in turn based on the Government's latest spending plans. In this box we compared our GGE forecast against the outturn data since the start of the 2010 Spending Review period. This allowed some assessment of how public sector employers were progressing with their intended workforce reduction and how much adjustment would still be required.
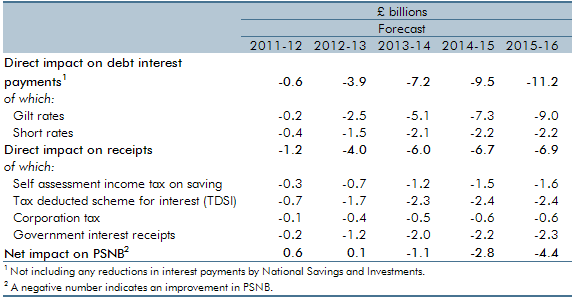
This box set out the impact of changes in interest rates on our public finances forecast, including debt interest spending and income tax receipts. Updated versions of our ready reckoners can be found on our website.
The Government announced in June 2011 that it intended to take on Royal Mail’s historic pension deficit with effect from April 2012. This box explored the provisional estimates of the impact this transfer had on the public finances.
The Government undertook a number of interventions in the financial sector in response to the financial crisis and subsequent recession of the late 2000s. This box provided an update of the estimated net effect of them on the public finances as of November 2011.
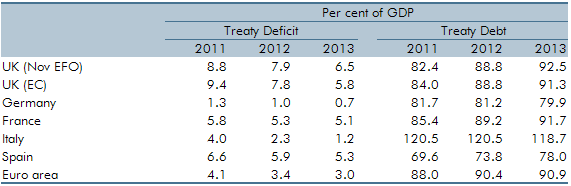
International organisations provide comparisons of deficit and debt levels. This box facilitated international comparisons by providing projections of Treaty debt and deficit on a calendar year basis.
Revisions to National Accounts data are a normal part of the Blue Book process, which reconciles the different measures of GDP and incorporates information from annual data sources. This box set out the key differences between the vintage of data used for the purposes of the October 2011 Forecast Evaluation Report and the data consistent with the 2011 Blue Book.
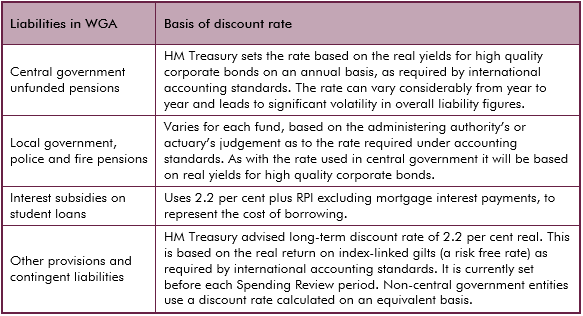
Discount rates are used to convert future cash flows into an equivalent one-off upfront sum or present value, allowing them to be presented alongside stock measures on a single balance sheet. But there is no single ‘correct’ discount rate and the use of discount rates presents some challenges in analysis of balance sheet movements over time. This box from our first Fiscal sustainability report in 2011 outlined the different discount rates used in the Treasury’s Whole of Government Accounts.
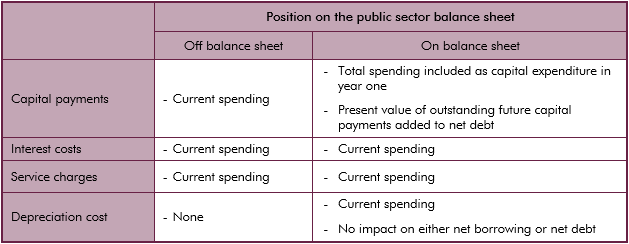
Depending on ONS classification assets relating to PFI contracts can be on the public sector or the private sector balance sheet. This box outlined the accounting of PFI contracts in the National Accounts and WGA.
We only include the impact of asset sales in our projections once sufficiently firm details are available for the effects to be quantified with reasonable accuracy. This box considered the risks that currently unquantifiable future asset sales may present to our projections.
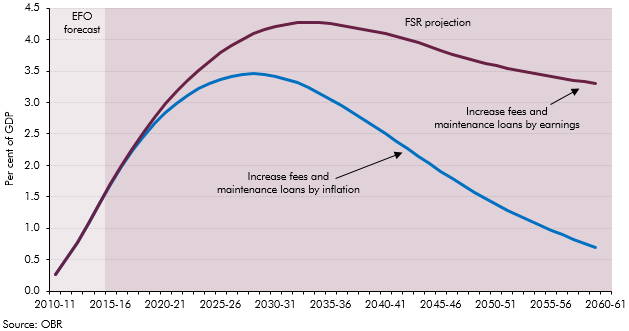
The Government carried out a number of reforms to the student finance support system, shifting funding from direct grants to loans to students. This box looked at the impact of student loans on public sector net debt.
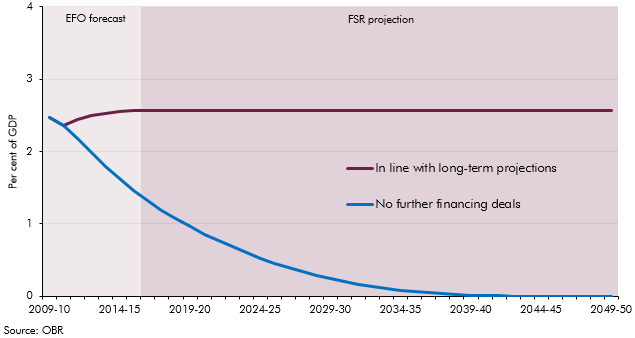
The majority of Private Finance Initiative (PFI) assets are held off the public sector balance sheet in the National Accounts. The running costs relating to existing PFI contracts are included within agreed departmental spending envelopes. This box explored the impact on our net debt projections if all capital liabilities relating to PFI contracts were included.
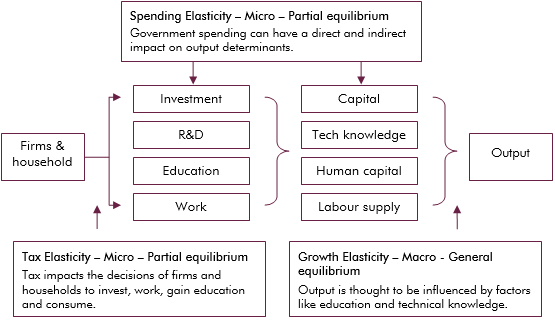
Economic theory suggests that tax and spending can impact output directly, such as expenditure on infrastructure, or indirectly, such as influencing the decisions of households and firms. This box explored the empirical evidence on whether tax and spending has a level (temporary) effect on output growth, or a growth (permanent) effect.
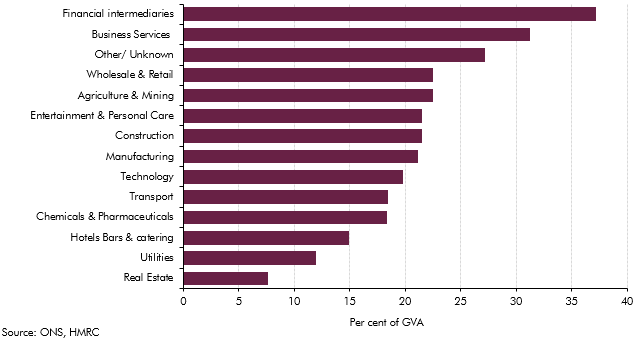
The sectoral landscape of the economy had changed markedly with the financial sector becoming increasing important. This box examined implications for tax revenue arising from the financial sector.
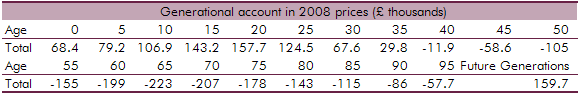
Solvency is not the only criterion that can be taken into account when assessing fiscal sustainability. This box outlined how generational accounts can be used to assess if future generations will be relatively worse off than current generations and the level of intergenerational fairness.
In each Economic and fiscal outlook we publish a box that summarises the effects of the Government’s new policy measures on our economy forecast. These include the overall effect of the package of measures and any specific effects of individual measures that we deem to be sufficiently material to have wider indirect effects on the economy. In our March 2011 Economic and Fiscal Outlook, we made adjustments to our forecast of inflation.
At the time of publication, oil prices had risen by £15 since the previous forecast. This box, from our March 2011 Economic and fiscal outlook, considered the potential economic implications, including the short-run effects on inflation and household consumption as well as possible longer-run effects on potential supply and the equilibrium capital stock.
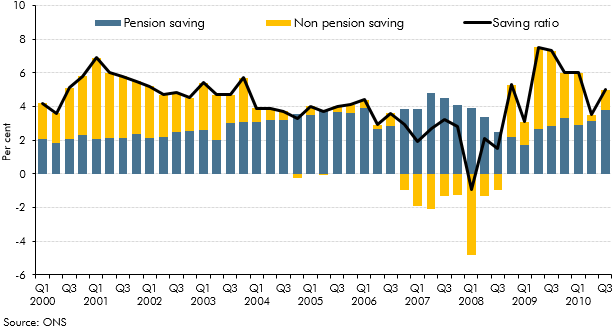
The household saving ratio captures both the disposable income that households do not spend on consumption, and changes in the equity households have in pension funds. This box described how the household saving ratio is calculated, and considered the relative contribution of pension and non-pension saving to the saving ratio over the preceding decade. The box also discussed possible factors behind recent movements in pension saving.
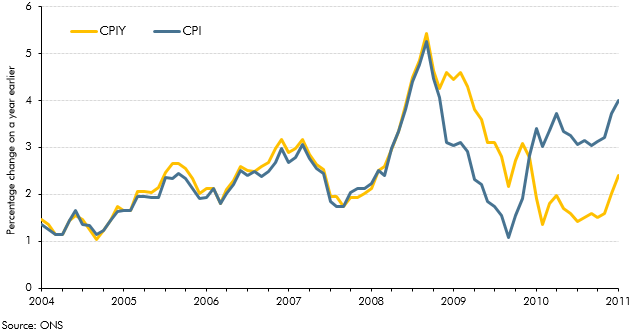
In the years prior to our March 2011 forecast there had been a number of changes to the rate of VAT, which affected CPI inflation. The Consumer Price Index excluding indirect taxes (CPIY) provides a measure of inflationary pressures excluding the effects that policy changes have on the CPI measure. This box considered how changes in VAT had contributed to the difference between CPIY and CPI at the time and what this meant for underlying inflationary pressures.
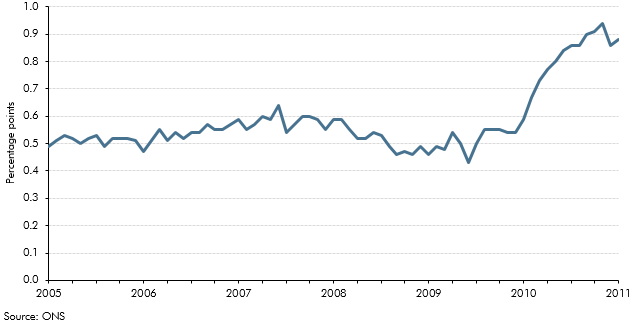
One of the key differences between the CPI and RPI inflation measures arises from the formulae used to construct the indices. In the year leading up to our March 2011 forecast, the contribution of this 'formula effect' to the divergence between CPI and RPI inflation had increased. This box explained the possible implications for our long-run assumption about the CPI-RPI wedge and our inflation forecast.
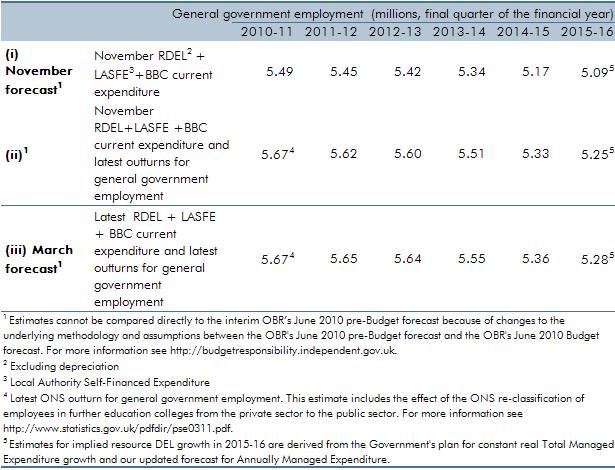
Our general government employment (GGE) forecast is based on projections of the growth of the total government paybill and paybill per head, which is in turn based on the Government's latest spending plans. Ahead of our March 2011 forecast, ONS estimates of general government employment were revised up, largely reflecting the reclassification of employees in further education colleges. In this box we set out the extent to which changes to our general government employment forecast were a result of our revised projections for paybill growth as opposed to data revisions.
In our central forecast, interest rates are assumed to evolve in line with financial market expectations. For alternative economic scenarios which involve different paths for the output gap and inflation, it is useful to specify rules for the way monetary policy is set and for how output and employment will respond. In this box, we set out the rules that governed those relationships in the scenarios we analysed in the March 2011 Economic and fiscal outlook: a persistent inflation scenario and a weak euro scenario.
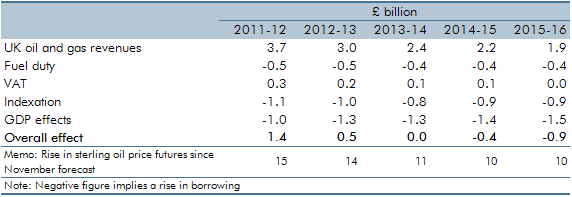
The world price of oil increased sharply in 2010, reflecting rising world demand and unrest in the Middle East and North Africa. This box explored the impact this had on our public finances forecast at the time, from higher North Sea oil and gas revenues to the second round effects stemming from higher inflation.
The Government undertook a number of interventions in the financial sector in response to the financial crisis and subsequent recession of the late 2000s. This box provided an update of the estimated net effect of them on the public finances as of March 2011.
This box set out the various impacts that higher inflation has on the public finances. These include direct effects (e.g. on income tax and debt interest spending), the impact on nominal tax bases (such as household consumption) and the impact on departmental spending.
The OBR provides independent scrutiny of policy costings and determines any resultant impact on the economic forecast. An estimate of the impact of a policy measure is included in the public finances forecast only when a firm policy has been announced and there is sufficient detail to quantify the effect of the policy. This box summarised the policies that were included in our November 2010 forecast.
Following the June 2010 Budget, the Government set out further details of the planned reductions in government expenditure in its 2010 Spending Review, including additional measures to reduce welfare spending. This box discussed the possible ways in which these measures could affect the economy's trend growth rate.
Net migration is an important source of growth in the working-age population. It therefore influences the economy’s trend growth rate by affecting potential labour supply growth. In this box in our first full Economic and fiscal outlook in November 2010, we considered how changes in migrant employment and productivity could affect whole economy employment and productivity.
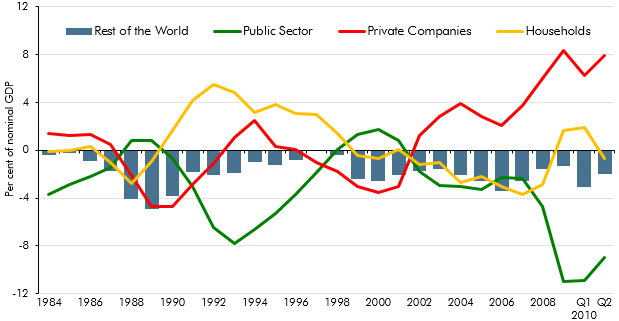
A rebalancing away from private consumption towards investment and net trade was a theme of our November 2010 forecast. This box set out the key features of domestic sector balances over the preceding two decades.
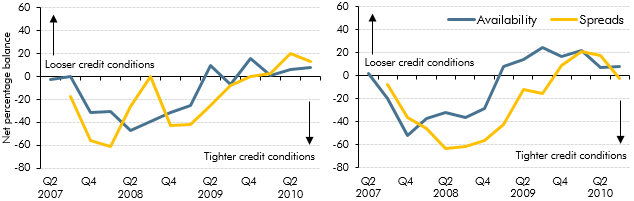
A commonly used metric of credit impairment is the price of interbank lending relative to the interest rate on short term government debt, although this does not indicate anything about the quantity of interbank lending, which fell significantly following the financial crisis. This box discussed qualitative survey evidence to assess changes to cost and availability of credit to household and firms. The Bank of England credit conditions survey suggested a modest loosening of credit conditions for both households and medium-sized firms over 2010, but the availability of credit remained constrained compared to their pre-crisis levels.
In 2010 Ireland’s sovereign debt markets had effectively closed and interest rates rose to record levels as it sought international financial assistance from the IMF and EU. This box considered the potential implications of this for our forecast, including reductions in trade, risks relating to the UK banking sector's exposure to Ireland, and higher UK interest rates resulting from widespread uncertainty in bond markets.
Data available at the time of our November 2010 Economic and fiscal outlook suggested that general government employment fell by 550,000 between 1992 and 1998. But some of this fall reflected the reclassification of further education colleges and sixth-form school employees from the public to the private sector in 1993. This box outlined a simple methodology which suggested that general government employment would have fallen by just over 400,000 over that period in the absence of this reclassification.
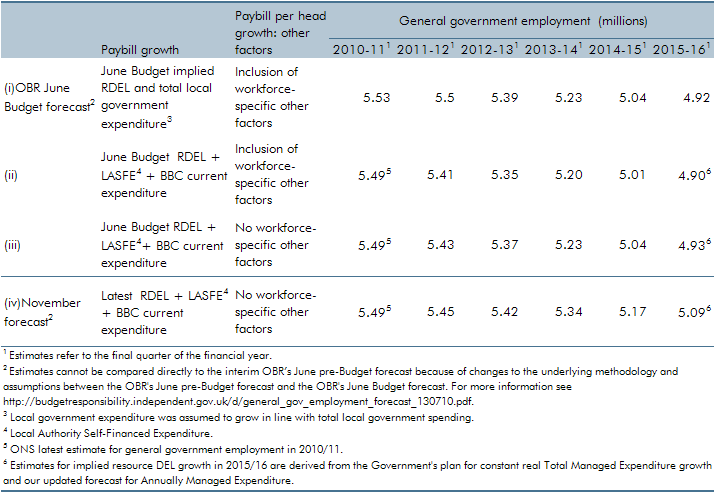
Our general government employment (GGE) forecast is based on projections of the growth of the total government paybill and paybill per head, which is in turn based on the Government's latest spending plans. Ahead of our November 2010 forecast, those plans were updated as part of the 2010 Spending Review. We also made a number of refinements to our forecasting approach. In this box we described revisions to our general government employment forecast and explain the extent to which these changes were the result of methodological changes as opposed to revised spending plans.
Our forecasts for tax receipts do not generally include any explicit assumptions about changes in the level of tax compliance. This box highlighted why our VAT forecast is the one exception.
The Government undertook a number of interventions in the financial sector in response to the financial crisis and subsequent recession of the late 2000s. This box provided an update of the estimated net effect of them on the public finances as of November 2010.
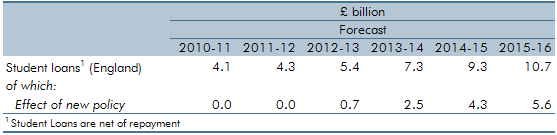
The Government set out proposals in England for a basic threshold of tuition fees of £6,000 per annum as well as an absolute limit of £9,000 in exceptional circumstances for undergraduate courses with effect from the 2012-13 academic year. This box outlined the effect of this student loan policy on the public finances.
Ahead of the June 2010 forecast, the OBR published a 'pre-measures' forecast, noting that the use of market expectations of interest in that forecast was potentially inconsistent, depending on markets' expectations of both fiscal tightening and the MPC's reaction to it. This box set out some illustrative calculations of the possible impact of the June 2010 Budget on long-term interest rates, and discussed the possible implications for comparisons between the pre-Budget and June Budget forecast
There are several technical indicators of fiscal sustainability that stem from a forward-looking approach. This box considered a number of these indicators.