
In recent years, onshore corporation tax receipts have repeatedly surprised on the upside. This box described the drivers behind that strength, in particular the contribution from a rising effective tax rate despite cuts to the headline rates.
This box is based on ONS and HMRC data from November 2018 and September 2018 respectively.
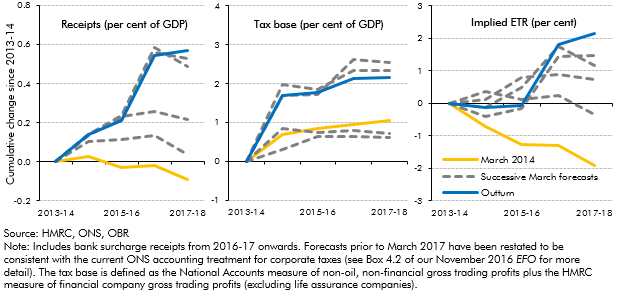
Onshore CT receipts have consistently outperformed our forecasts in recent years. Having grown by an average of 2.8 per cent a year over the four years to 2013-14, they have increased by a much stronger 10.1 per cent a year on average over the past four years (including the effect of the 8 percentage point surcharge on banking companies’ profits from 2016-17 onwards). Our forecasts consistently missed the pace of this growth, particularly in 2016-17.
Receipts increased by almost 0.6 per cent of GDP between 2013-14 and 2017-18 (left-hand panel of Chart A), rather than falling slightly as we anticipated in our March 2014 forecast. This is attributable to stronger growth in the tax base (middle panel) and, particularly in recent years, a rising effective tax rate (ETR) (right-hand panel), despite the headline CT rate being cut from 23 per cent to 19 per cent over the period.a
Chart B: Cumulative growth in onshore corporation tax since 2013-14
Why has the effective tax rate risen?
The effective tax rate (ETR) on total corporate income is much lower than the headline rate, because of the many deductions and reliefs firms can apply to their taxable income. From 2013-14 to 2017-18, a smaller proportion of income was offset through use of deductions and reliefs, causing the ETR to rise despite the four percentage point cut in the headline rate.
The largest driver of this change has been a smaller proportion of income offset by the use of loss reliefs – these allow firms to offset trading and other losses against their taxable income. (In some cases, losses can be offset against income in previous or future periods.) Group relief allows firms to share losses within a ‘qualifying group’ (e.g. across subsidiaries) in some circumstances. In 2013-14 around 33 per cent of gross taxable corporate income was offset for tax purposes via the use of loss reliefs – by 2016-17 this had fallen to 29 per cent.b
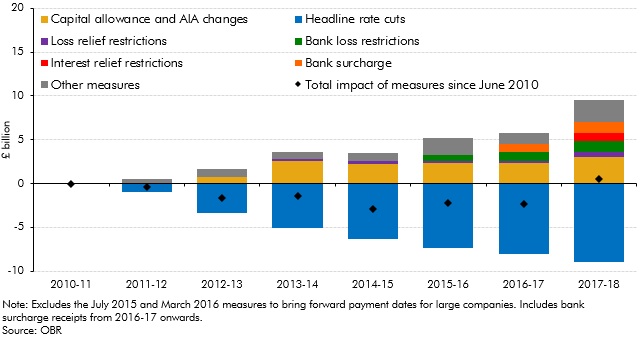
The declining use of deductions as a share of corporate income partly reflects the continued strength of profit growth over the past six years, which is likely to have limited the stock of losses available to offset against income while also boosting income itself. It also partly reflects policy measures announced since June 2010 that have restricted firms’ ability to claim reliefs and deductions. Chart B shows that since June 2010, the Government has chosen to offset the bulk of the effect of headline CT rate cuts by restricting the use of reliefs and deductions, and by introducing the 8 percentage point bank surcharge. These estimates reflect the costings that were estimated at the time and so have not been updated to reflect new information.c
Chart C: Cumulative impact of measures on onshore CT receipts since June 2010
Why has the tax base risen?
Growth in the tax base (gross taxable corporate income) has also boosted receipts. This partly reflects a roughly 30 per cent increase in the number of companies paying CT between 2013-14 and 2016-17. The vast majority of these new firms are paying between £1,000 and £50,000 in tax, which suggests that individuals incorporating (in many cases to reduce their personal tax liability) is a key driver – this boosts CT receipts at the expense of taxes on labour income.
Reductions in the marginal tax rate faced by firms can still be expected to be partially self-financing, thanks to firms’ behavioural response to them, even if the direct impact on the average tax rate is offset by lower exemptions. HMRC and HM Treasury analysis in 2013 suggested that 45 to 60 per cent of the static effect of CT rate cuts would be recovered in the long term through the dynamic response of the economy.d But this estimated response comes primarily from higher employment and wages, and therefore boosts income tax and NICs, rather than CT receipts directly. Our forecast does not account directly for these dynamic responses, in part because the effects are very long-run, and certainly beyond the horizon considered here.
This box was originally published in Forecast evaluation report – December 2018