
The cost of living has risen rapidly for households, with inflation reaching a 30-year high in January 2022 and the Russian invasion of Ukraine expected to increase inflation further. In this box we outlined our forecast for real household disposable incomes per person and explained that despite the Government's policy measures, 2022-23 is set to see the largest fall in living standards since ONS records began in 1956-57.
This box is based on ONS data from March 2022 .
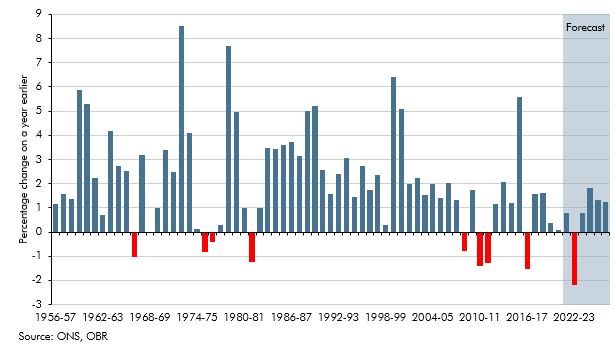
The rise in inflation to a 40-year high this year is expected to reduce real household disposable incomes (RHDI) on a per-person basis by 2.2 per cent in 2022-23, the biggest fall in living standards in any single financial year since ONS records began in 1956-57 (Chart F).a The underlying source of the reduction in disposable incomes comes from several sources. The failure of nominal earnings growth to keep pace with rising inflation is a key factor. Rising inflation, in turn, reflects increases in global prices of goods (including commodities) that preceded the Russian invasion and the further ratcheting up of energy prices that followed. These increases in global goods and energy prices are a negative terms of trade shock that, as a net importer of both, lowers UK standards of living. Net changes in personal taxes and benefits also reduce real disposable income in the coming financial year. 2022-23 would represent only the ninth occasion since the 1950s that RHDI per person has fallen on a financial year basis and the first time it has done so since 2016-17, as shown in Chart F.
This record fall comes despite the £17.6 billion of fiscal support for households announced in this Spring Statement via the energy support package, fuel duty cut and NICs primary threshold measures (as outlined in Box 2.3). Without these measures, RHDI per person would fall by around another 1 percentage point in 2022-23 meaning the Government has offset around a third of the fall in living standards that would otherwise have occurred. When the energy rebate measures were announced, the Government noted that the £350 would offset just over half of the £694 in annual energy bills that would take effect in April. Our forecast assumes a further rise in the price cap of around 40 per cent in October 2022, which would imply that average annual energy bills are around £1,100 higher between April 2022 and March 2023. The combined effect in that period of the initial rebates and NICs cuts announced in the Spring Statement is sufficient to offset just under half of this rise, broadly maintaining the degree to which households’ finances are cushioned from the blow of higher energy bills over the coming year. However, the prices of other (non-energy) goods and services in the economy are also rising faster than incomes, which means that total tax and benefit changes in this Spring Statement offset only about a third of the overall decline in real per-person disposable incomes.
Chart F: Change in real household disposable income per person since 1956-57
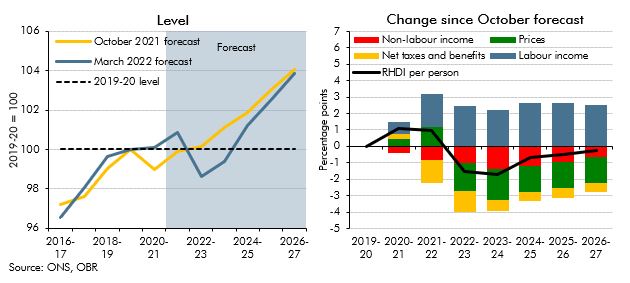
This substantial fall in 2022-23 means that RHDI per person sustainably returns to its pre-pandemic level later than we forecast in October (as shown in the left panel of Chart G). Real incomes have been stagnant since the start of 2019 and this is now expected to continue over the next few years, with RHDI per person only sustainably returning to its pre-pandemic level in 2024-25. This is two years later than we forecast in October and four years after the start of the pandemic. Over the forecast period the level of RHDI per person troughs in late 2022 before starting to recover in 2023 as energy prices fall and inflation starts to ease.
The right panel of Chart G decomposes the revision to cumulative growth in RHDI per person between 2019-20 and 2026-27 since our October forecast into contributions from labour and non-labour income, net tax and benefits, and prices. By 2026-27, cumulative growth in RHDI per person is 0.2 percentage points lower than in our October forecast.b
Chart G: Real household disposable income per person
This box was originally published in Economic and fiscal outlook – March 2022