
Box sets » Inflation
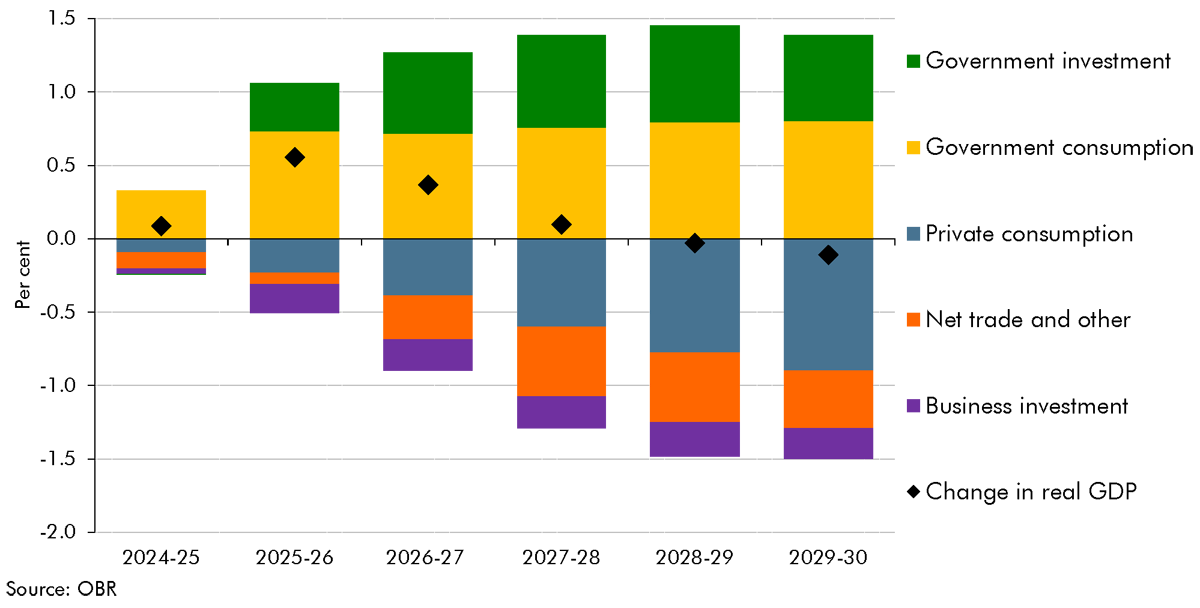
In each Economic and fiscal outlook we publish a box that summarises the effects of the Government’s new policy measures on our economy forecast. These include the overall effect of the package of measures and any specific effects of individual measures that we deem to be sufficiently material to have wider indirect effects on the economy. In our October 2024 Economic and fiscal outlook, we adjusted our forecast to account for fiscal loosening and considered the effects of changes to taxation and increases in public investment.
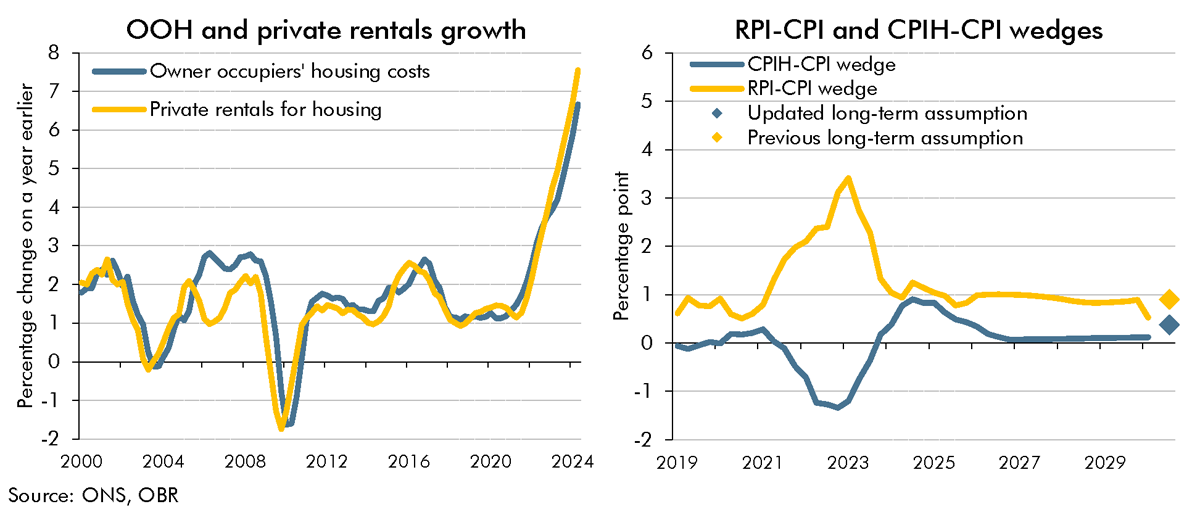
As as result of the shortcomings with the methodology for calculating the Retail Prices Index (RPI), the ONS's current plans are to address these by bringing the methods and data sources from the Consumer Prices Index including owner occupiers' housing costs (CPIH) into the RPI in February 2030. In this box, we explained how this change would impact our estimate of the long-run difference between RPI and CPI inflation.
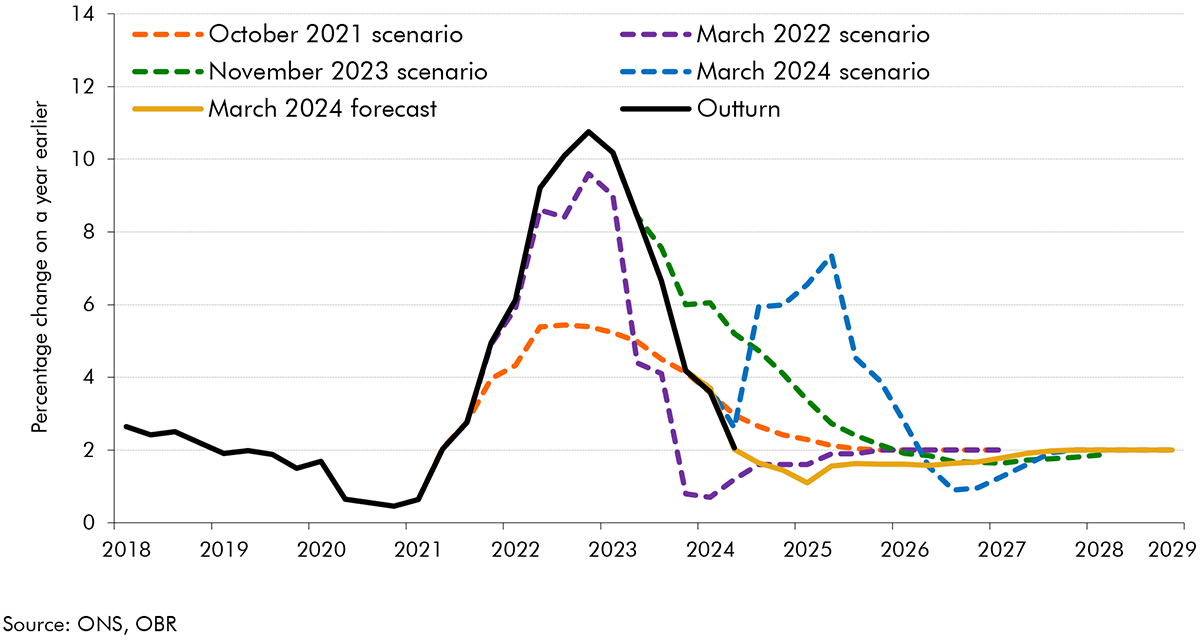
The outlook for inflation was highly uncertain at the time of our March 2023 forecast: the UK was experiencing the largest inflation shock since the 1980s, and the first significant shock in the era of independent inflation-targeting central banks. In this box, we reviewed the ways we have presented uncertainty in our successive EFOs, in particular our use of fan charts and scenarios.
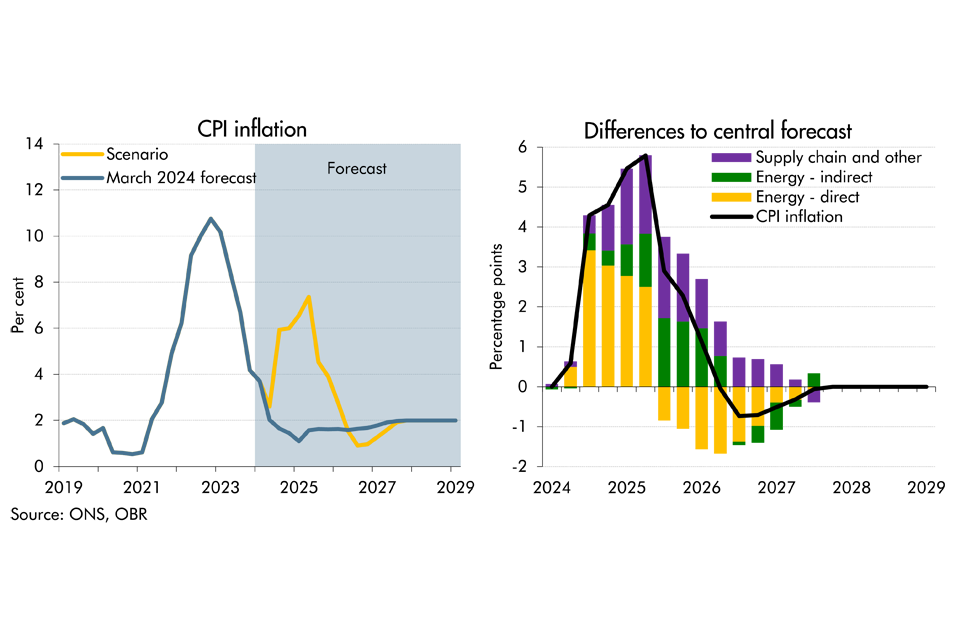
As tensions have risen in the Middle East, there has been increasing concern over the possibility of a wider escalation in the region and its implications on the UK economy. In this box we considered the economic growth and inflationary implications of an adverse scenario. In this scenario, supply chain disruption reaches levels not seen since the pandemic levels and energy costs rise sharply for a second time since the pandemic.
Our recent forecasts have significantly underestimated inflation outturns, with the March 2021 underestimation of inflation in 2022-23 being the largest difference between forecast and outturn since the OBR began forecasting in 2010. In this box we explored the reasons that might have driven these differences since our March 2022 forecast. In particular, we considered the extent to which the knock-on effects of higher energy prices on CPI inflation might have been higher than we originally assumed.
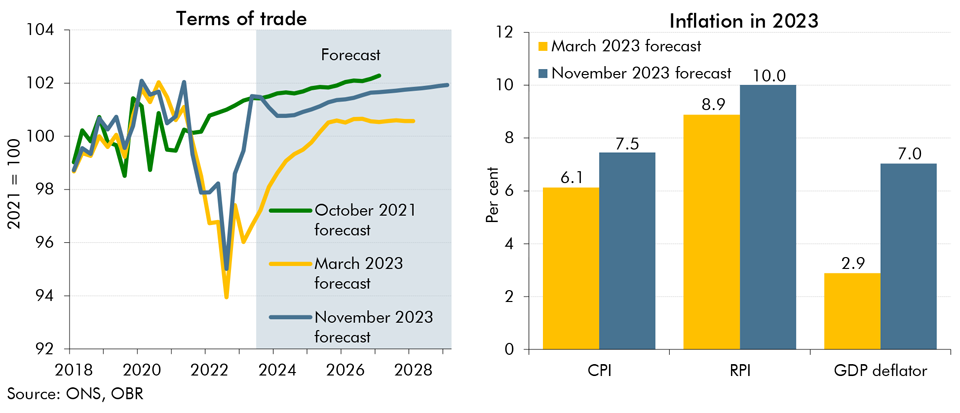
In our November 2023 forecast we expect inflation to be both more persistent and more domestically generated than in March. In this box we explored the reasons behind our assessment for inflation to be more domestically rather than externally driven and its implications for the public finances.
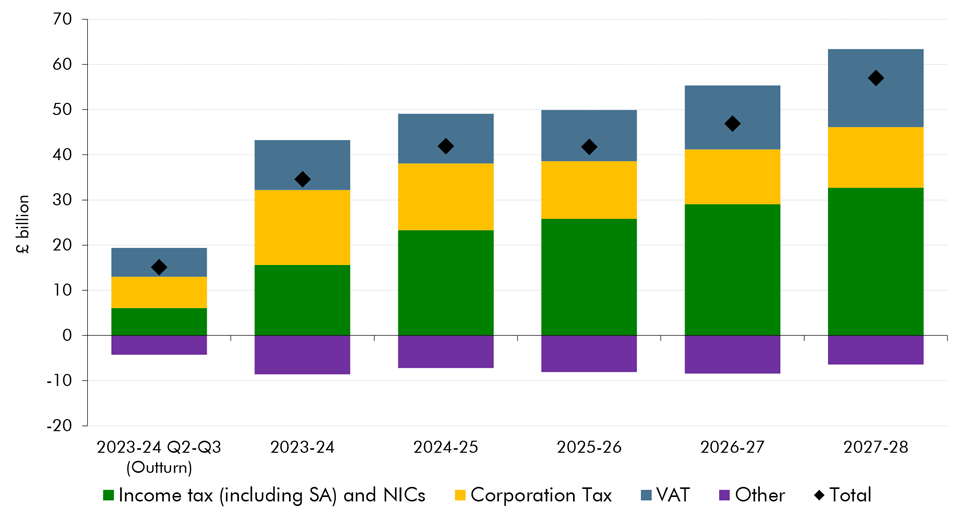
We have made a significant upward revision to our pre-measures receipts forecast. This box explored the drivers behind the revision, which taxes drive the revision and how much of this change is due to real GDP, inflation and the effective tax rate.
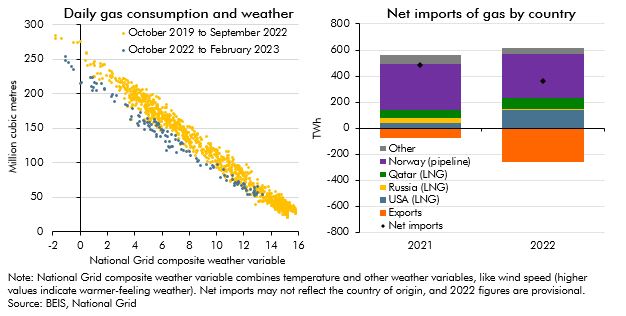
In response to the largest rise in energy prices in around 50 years, an immediate reduction in energy demand, and more gradual change in the composition of energy supply, might be expected. In this box we look at how the sharp rise in the household price of gas has changed households consumption of gas this winter as well as how the Russian invasion of Ukraine and the rise in wholesale gas prices has changed the UK's energy supply over the last year and how it may change further in the future. We then briefly outline how we forecast gas prices and why we do so.
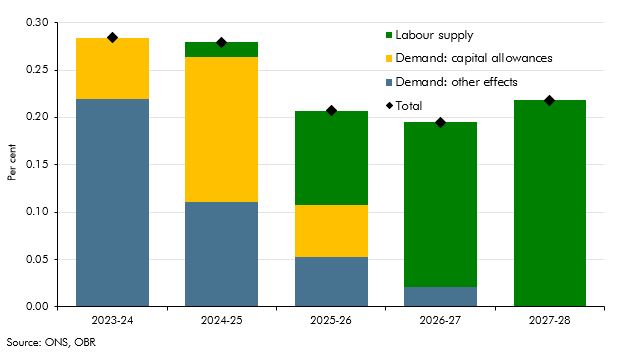
In each Economic and fiscal outlook we publish a box that summarises the effects of the Government’s new policy measures on our economy forecast. These include the overall effect of the package of measures and any specific effects of individual measures that we deem to be sufficiently material to have wider indirect effects on the economy. In our March 2022 Economic and fiscal outlook, we adjusted our forecast to account for the loosening of fiscal policy, including a temporary capital allowance. And, we considered the effects of policy to boost employment on our potential output forecast.
In each Economic and fiscal outlook we publish a box that summarises the effects of the Government’s new policy measures on our economy forecast. These include the overall effect of the package of measures and any specific effects of individual measures that we deem to be sufficiently material to have wider indirect effects on the economy. In our November 2022 Economic and fiscal outlook, we adjusted our economy forecast to take into account plans for the energy price guarantee (EPG) and consider the impact of tax and spending measures on the supply side of the economy.
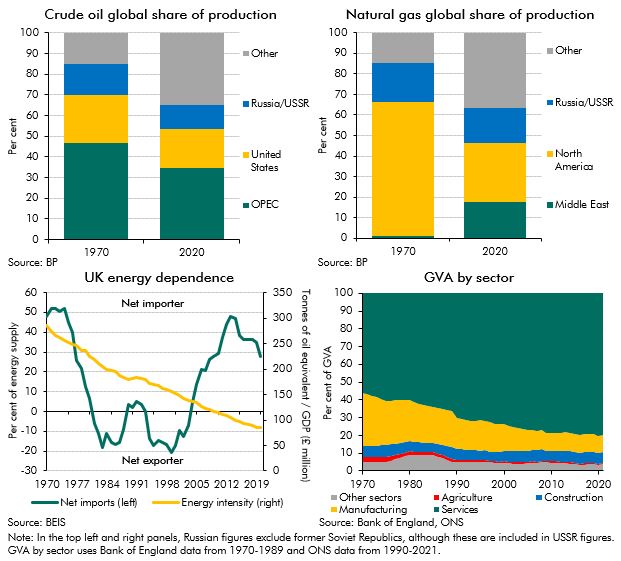
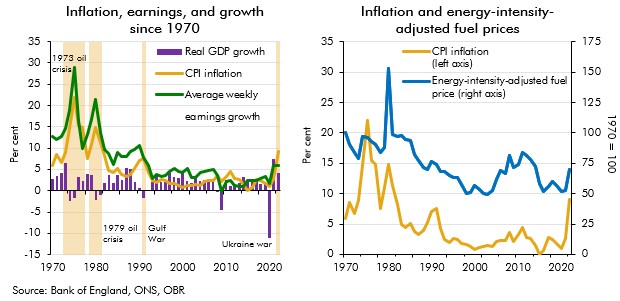
The recent surge in energy prices and its associated effects on inflation has led to comparisons with the last major global energy crisis in the 1970s. This box examined the ways in which the shocks are similar and how they are different, with a focus on how the UK economy in some ways has become more resistent to energy price shocks.
In May 2022, the Government announced a package of measures to support households with the cost of living. In this box, we explained how we had adjusted our March 2022 Economic and fiscal outlook forecast for these policies.
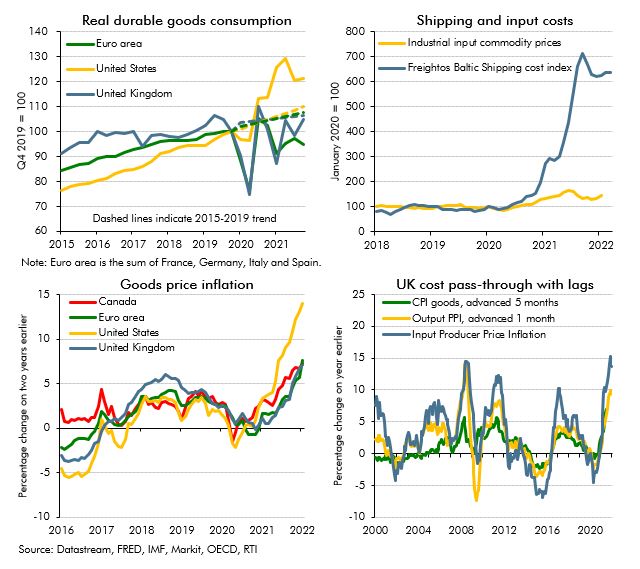
The recovery from Covid in the second half of 2021 was characterised by the emergence of imbalances between supply and demand in many markets. In this box we explored the impact of and outlook for these imbalances, or bottlenecks, in global product markets.
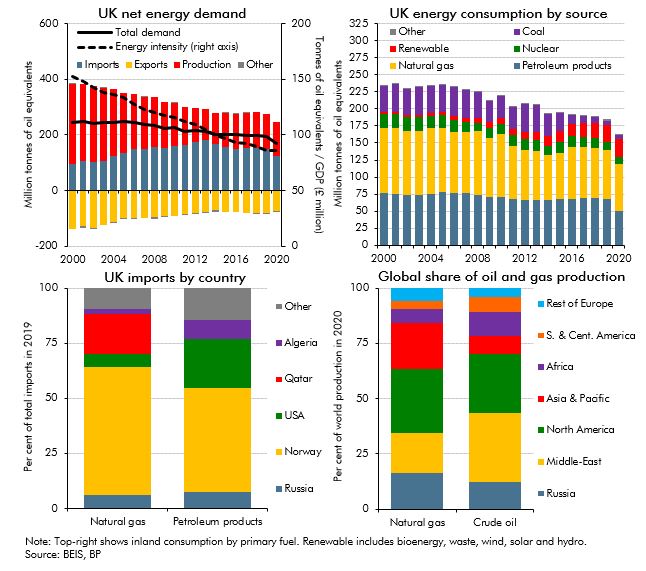
Russia’s invasion of Ukraine in the run-up to our March 2022 Economic and fiscal outlook represented a significant adverse shock, primarily via a sharp rise in gas and oil prices. In this box, we considered where the UK gets its energy from and the channels through which higher energy prices raise inflation. We then set out how the economic shock from the invasion had been reflected in our forecast as well as several potential channels through which the invasion could affect the UK economy that our forecast did not explicitly capture.
In each Economic and fiscal outlook we publish a box that summarises the effects of the Government’s new policy measures on our economy forecast. These include the overall effect of the package of measures and any specific effects of individual measures that we deem to be sufficiently material to have wider indirect effects on the economy. In our March 2022 Economic and fiscal outlook, we adjusted our economy forecast to take into account plans to loosen fiscal policy from 2022-23, to support households with the cost of living crisis, as well as for several specific measures, such as the cut in fuel duty and the freezing of the BBC liscence fee.
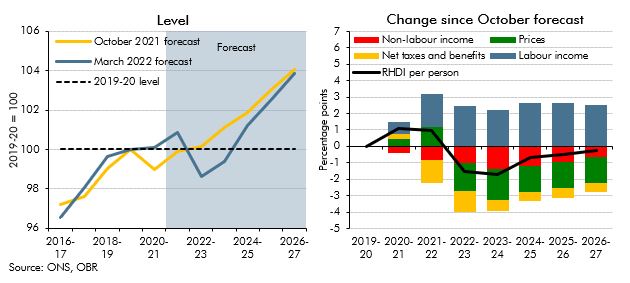
The cost of living has risen rapidly for households, with inflation reaching a 30-year high in January 2022 and the Russian invasion of Ukraine expected to increase inflation further. In this box we outlined our forecast for real household disposable incomes per person and explained that despite the Government's policy measures, 2022-23 is set to see the largest fall in living standards since ONS records began in 1956-57.
In each Economic and fiscal outlook we publish a box that summarises the effects of the Government’s new policy measures on our economy forecast. These include the overall effect of the package of measures and any specific effects of individual measures that we deem to be sufficiently material to have wider indirect effects on the economy. In our October 2021 Economic and fiscal outlook, we adjusted our economy forecast to take into account plans to loosen fiscal policy from 2022-23, as well as for several specific measures, including the impact of the HSC Levy on earnings.
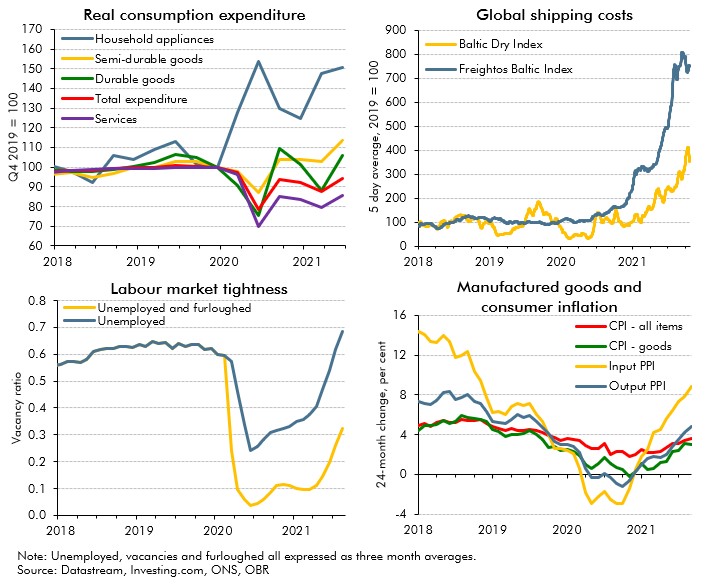
In October 2021 commentators became increasingly concerned that the inability of supply to keep up with demand in specific areas of the economy would hold back the recovery. In this box we examined these 'supply bottlenecks' in energy, product and labour markets, discussing their consequences for wage and price inflation.
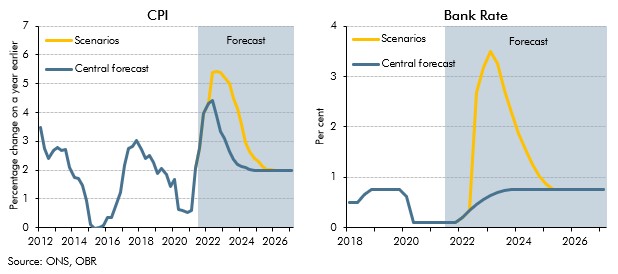
Inflation risks intensified after we closed our pre-measures forecast for the October 2021 Budget. This box showed two stylised scenarios embodying higher and more persistent inflation than in our central forecast to highlight the uncertainty surrounding the outlook. In one scenario inflation was driven mainly by pressures in the product market, and the other mainly pressures in the labour market, which had different implications for wages and consumption.
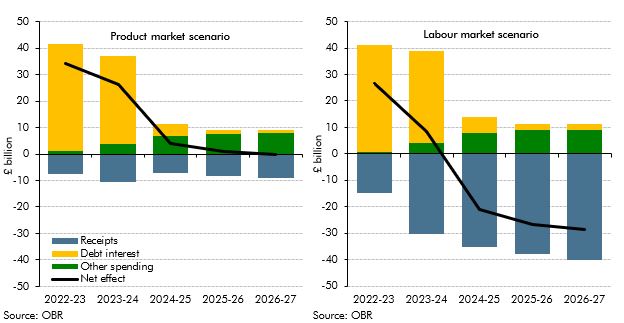
The level and nature of inflation has consequences for the public finances. This box explored the fiscal consequences of the sharp rise in inflation since our March 2021 forecast and examined the fiscal effects of the two scenarios described in Box 2.6 in our October 2021 EFO one where inflation is driven mainly by pressures in the product market, and the other mainly pressures in the labour market. The box concluded the labour market inflation scenario was significantly more beneficial for the public finances.
In each Economic and fiscal outlook we publish a box that summarises the effects of the Government’s new policy measures on our economy forecast. These include the overall effect of the package of measures and any specific effects of individual measures that we deem to be sufficiently material to have wider indirect effects on the economy. In our March 2020 Economic and fiscal outlook, we adjusted our economy forecast to account for the material increase in departmental spending and tax policy changes on GDP and inflation. In addition to this, our business investment forecast incorporates the reversal of the planned cut in corporation tax, increases in the structures and buildings allowance and R&D tax credits.
By issuing gilts linked to the Retail Prices Index (RPI) the Government exposes itself to inflation risks on interest payments. In this box, we looked at how changes to the formula for calculating RPI would affect our forecast.

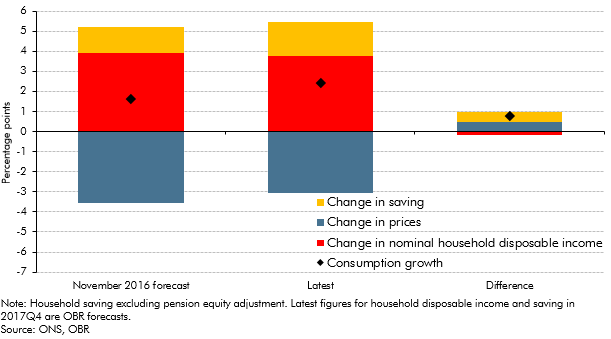
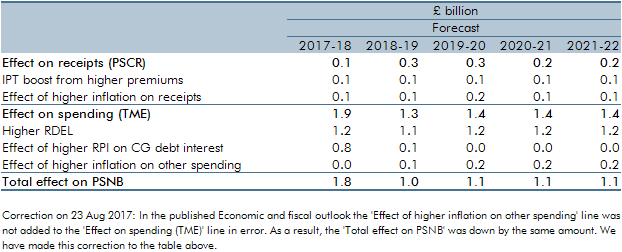
One unforeseen economic development affecting our March 2016 forecast was the upside surprise in inflation in 2017-18 as a result of the fall in the exchange rate. This box described the effect of that surprise on receipts, spending and borrowing.
In each Economic and fiscal outlook we publish a box that summarises the effects of the Government’s new policy measures on our economy forecast. These include the overall effect of the package of measures and any specific effects of individual measures that we deem to be sufficiently material to have wider indirect effects on the economy. In our October 2018 Economic and fiscal outlook, economy forecast adjustments included the effects of looser fiscal policy on GDP and inflation, the effects of capital allowances on business investment, the effects of tax policy changes on inflation and the effects of the extension of the Help to Buy scheme on the housing market.
In the November 2016 EFO we made a number of judgements about how the vote to leave the EU would effect the economy in the near-term. This box from our March 2018 EFO compared these judgements against the outturn data that we had received since then, finding that most of these judgements were broadly on track.
In each Economic and fiscal outlook we publish a box that summarises the effects of the Government’s new policy measures on our economy forecast. These include the overall effect of the package of measures and any specific effects of individual measures that we deem to be sufficiently material to have wider indirect effects on the economy. In our November 2017 Economic and fiscal outlook, economy forecast adjustments included the effects of looser fiscal policy on GDP, the effects of tax policy changes on inflation and the effects of stamp duty relief for first-time-buyers on house prices.
In each Economic and fiscal outlook we publish a box that summarises the effects of the Government’s new policy measures on our economy forecast. These include the overall effect of the package of measures and any specific effects of individual measures that we deem to be sufficiently material to have wider indirect effects on the economy. In our March 2017 Economic and Fiscal Outlook, we adjusted our economy forecast for the effects of reducing the ‘personal injury discount rate’.
In February 2017, just ahead of the Spring Budget and our March Economic and fiscal outlook, the Ministry of Justice announced that the ‘personal injury discount rate’ would be reduced from 2.5 to minus 0.75 per cent (in inflation-adjusted real terms). This box explained the direct and indirect effects of this change on our receipts and public spending forecasts.
In each Economic and fiscal outlook we publish a box that summarises the effects of the Government’s new policy measures on our economy forecast. These include the overall effect of the package of measures and any specific effects of individual measures that we deem to be sufficiently material to have wider indirect effects on the economy. In our November 2016 Economic and Fiscal Outlook, economy forecast adjustments included the effects of looser fiscal policy on GDP and the effects of tax policy changes on inflation.
In each Economic and fiscal outlook we publish a box that summarises the effects of the Government’s new policy measures on our economy forecast. These include the overall effect of the package of measures and any specific effects of individual measures that we deem to be sufficiently material to have wider indirect effects on the economy. In our March 2016 Economic and Fiscal Outlook, we made a number of economy forecast adjustments to GDP, business investment, wage growth, inflation and the housing market.
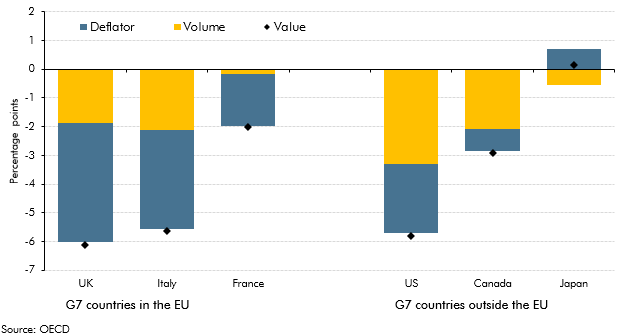
The government consumption deflator measures the implied price of government services. International comparisons show that different methodologies for deriving the government consumption deflator affect the extent to which nominal changes are interpreted as driven by changes in prices as opposed to volumes. This box outlined how these methodologies affected government consumption compared to pre-recession averages for six leading industrial countries.
In each Economic and fiscal outlook we publish a box that summarises the effects of the Government’s new policy measures on our economy forecast. These include the overall effect of the package of measures and any specific effects of individual measures that we deem to be sufficiently material to have wider indirect effects on the economy. In the 2015 Autumn Statement and Spending Review, we made a number of adjustments to real and nominal GDP, the labour market, inflation, and the housing market.
In each Economic and fiscal outlook we publish a box that summarises the effects of the Government’s new policy measures on our economy forecast. These include the overall effect of the package of measures and any specific effects of individual measures that we deem to be sufficiently material to have wider indirect effects on the economy. In the July 2015 Economic and fiscal outlook, we made a number of adjustments to real and nominal GDP, the labour market, inflation, business and residential investment, and the housing market.
In each Economic and fiscal outlook we publish a box that summarises the effects of the Government’s new policy measures on our economy forecast. These include the overall effect of the package of measures and any specific effects of individual measures that we deem to be sufficiently material to have wider indirect effects on the economy. In our March 2015 Economic and Fiscal Outlook, we made adjustments to nominal GDP, inflation and North sea production.
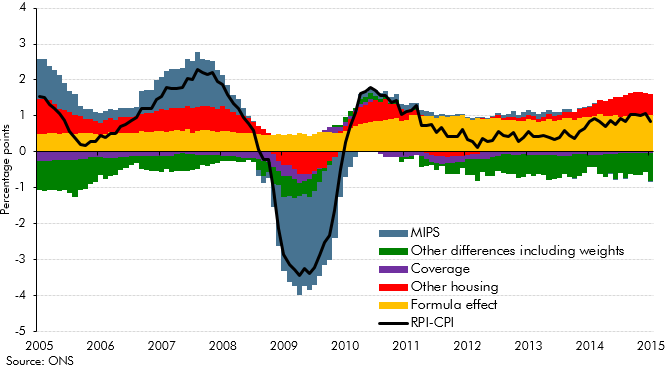
RPI inflation differs from CPI inflation for a number of reasons. Collectively the difference between the two measures is refered to as the 'wedge'. In light of more evidence this box, from our March 2015 Economic and fiscal outlook, re-examined historical contributions to the 'wedge' and set out our latest assumptions for the long-run difference between the two measures.
In each Economic and fiscal outlook we publish a box that summarises the effects of the Government’s new policy measures on our economy forecast. These include the overall effect of the package of measures and any specific effects of individual measures that we deem to be sufficiently material to have wider indirect effects on the economy. In our December 2014 Economic and Fiscal Outlook, we made adjustments to property transactions and residential investment in light of reforms to stamp duty land tax
Each autumn, we publish our Forecast evaluation report (FER), a detailed examination of the performance of past economic and fiscal forecasts relative to the latest outturn data. This box discussed the OECD's and Bank of England's forecast errors, their explanations for these errors, and the lessons forecasters have learnt from the errors.
In each Economic and fiscal outlook we publish a box that summarises the effects of the Government’s new policy measures on our economy forecast. These include the overall effect of the package of measures and any specific effects of individual measures that we deem to be sufficiently material to have wider indirect effects on the economy. In our March 2014 Economic and Fiscal Outlook, we made adjustments to inflation and business investment.
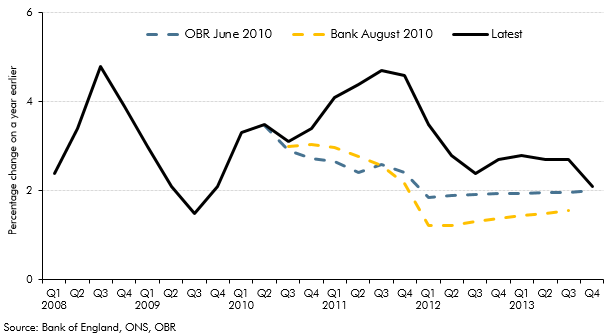
On 7 August 2013, the Bank of England announced that it would not consider raising Bank Rate, then at 0.5 per cent, until the unemployment rate had fallen to 7.0 per cent. However, the Bank also detailed certain conditions, which if breached, would make it consider tightening monetary policy sooner. This box, from our December 2013 Economic and fiscal outlook, examined where our forecast stood in relation to these conditions.
In each Economic and fiscal outlook we publish a box that summarises the effects of the Government’s new policy measures on our economy forecast. These include the overall effect of the package of measures and any specific effects of individual measures that we deem to be sufficiently material to have wider indirect effects on the economy. In our December 2013 Economic and Fiscal Outlook, we adjusted our inflation forecast to reflect changes in fuel duty.
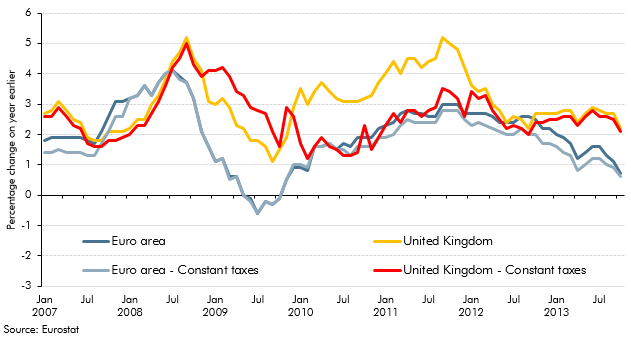
From late-2008 to 2013, the rate of CPI inflation in the UK had been consistently higher than the euro area equivalent measure. This box, published in our December 2013 Economic and fiscal outlook, outlined a number of factors which had contributed to the divergence including exchange rate movements, changes in VAT and utility prices.
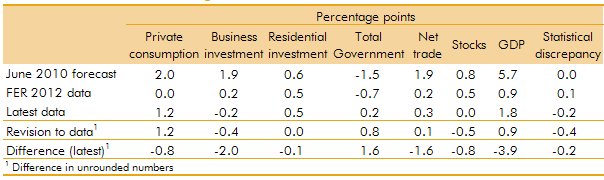
In our 2012 Forecast Evaluation Report, we noted that nominal GDP had held up closer to our June 2010 forecast than real GDP, helping to explain why our fiscal forecasts out to 2011-12 had remained broadly on track. This box in our 2013 Forecast Evaluation Report discussed how this assessment changed in light of revisions to GDP data. While nominal GDP now appeared to be weaker than forecast, the relatively tax-rich components - such as nominal consumption and wages and salaries - held up relatively well.
In each Economic and fiscal outlook we publish a box that summarises the effects of the Government’s new policy measures on our economy forecast. These include the overall effect of the package of measures and any specific effects of individual measures that we deem to be sufficiently material to have wider indirect effects on the economy. In our March 2013 Economic and Fiscal Outlook, we made adjustments to our forecasts of real GDP, business investment and inflation
In October 2011, we published our first Forecast evaluation report (FER). This box summarised the key findings, including a discussion of weaker than expected GDP growth and why, despite this, public sector borrowing has fallen broadly as we expected it would.
In each Economic and fiscal outlook we publish a box that summarises the effects of the Government’s new policy measures on our economy forecast. These include the overall effect of the package of measures and any specific effects of individual measures that we deem to be sufficiently material to have wider indirect effects on the economy. In our December 2012 Economic and Fiscal Outlook, we made adjustments to our forecasts of real GDP, inflation and property transactions
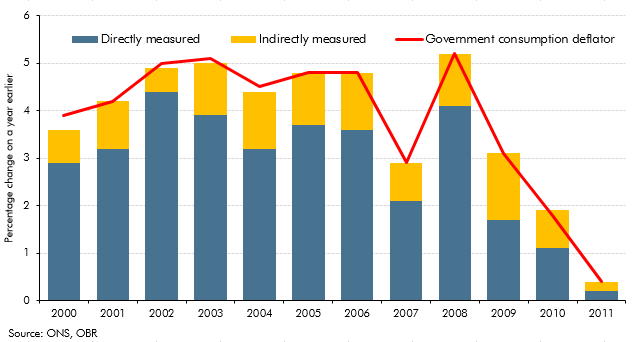
In the two years before our December 2012 forecast, real government consumption held up more than we had expected, with reductions in nominal government consumption affecting prices to a greater extent than we forecast. This box set out how these outturns would have been affected by the way the Office for National Statistics measures real government consumption, a large part of which is based on 'direct' measures of government activity.
In 2012 the ONS carried out a range of methodological development work relating to consumer prices indices. This box summarised some of the key elements, including work addressing the 'formula effect' which had made an increasing contribution to the CPI-RPI 'wedge' in 2010 and 2011. This box also discussed ONS analysis and recommendations from Consumer Prices Advisory Committee on the appropriate measurement of owner occupiers’ housing (OOH) costs and their inclusion in a new index of consumer prices.
In recent years, the government consumption deflator had been weaker than we expected. This box set out our assumption that the weakness of the government consumption deflator was likely to persist over the forecast period. The box also reviewed the outlook for the household consumption deflator and explained our assumption that this would be broadly equal to CPI inflation in the long run. Taken together with our assumptions for other deflators, these assumptions implied a medium-term GDP deflator growth assumption of 2 per cent, revised down from a previous assumption of 2.5 per cent
In each Economic and fiscal outlook we publish a box that summarises the effects of the Government’s new policy measures on our economy forecast. These include the overall effect of the package of measures and any specific effects of individual measures that we deem to be sufficiently material to have wider indirect effects on the economy. In our March 2012 Economic and Fiscal Outlook, we made adjustments to our forecasts of real GDP, business investment and inflation.
In each Economic and fiscal outlook we publish a box that summarises the effects of the Government’s new policy measures on our economy forecast. These include the overall effect of the package of measures and any specific effects of individual measures that we deem to be sufficiently material to have wider indirect effects on the economy. In our November 2011 Economic and Fiscal Outlook, we made adjustments to our forecasts of inflation and property transactions.
In each Economic and fiscal outlook we publish a box that summarises the effects of the Government’s new policy measures on our economy forecast. These include the overall effect of the package of measures and any specific effects of individual measures that we deem to be sufficiently material to have wider indirect effects on the economy. In our March 2011 Economic and Fiscal Outlook, we made adjustments to our forecast of inflation.
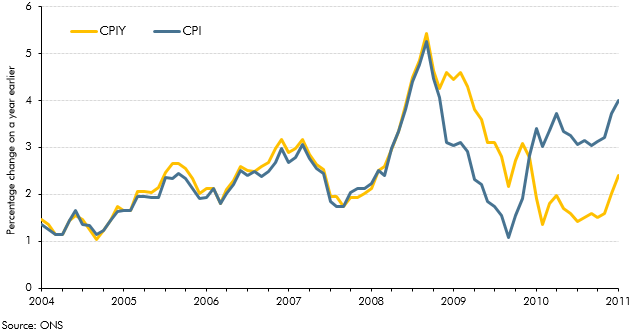
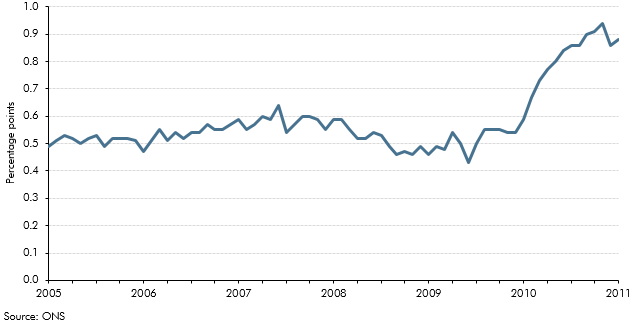
In the years prior to our March 2011 forecast there had been a number of changes to the rate of VAT, which affected CPI inflation. The Consumer Price Index excluding indirect taxes (CPIY) provides a measure of inflationary pressures excluding the effects that policy changes have on the CPI measure. This box considered how changes in VAT had contributed to the difference between CPIY and CPI at the time and what this meant for underlying inflationary pressures.
One of the key differences between the CPI and RPI inflation measures arises from the formulae used to construct the indices. In the year leading up to our March 2011 forecast, the contribution of this 'formula effect' to the divergence between CPI and RPI inflation had increased. This box explained the possible implications for our long-run assumption about the CPI-RPI wedge and our inflation forecast.
In our central forecast, interest rates are assumed to evolve in line with financial market expectations. For alternative economic scenarios which involve different paths for the output gap and inflation, it is useful to specify rules for the way monetary policy is set and for how output and employment will respond. In this box, we set out the rules that governed those relationships in the scenarios we analysed in the March 2011 Economic and fiscal outlook: a persistent inflation scenario and a weak euro scenario.
This box set out the various impacts that higher inflation has on the public finances. These include direct effects (e.g. on income tax and debt interest spending), the impact on nominal tax bases (such as household consumption) and the impact on departmental spending.