
As tensions have risen in the Middle East, there has been increasing concern over the possibility of a wider escalation in the region and its implications on the UK economy. In this box we considered the economic growth and inflationary implications of an adverse scenario. In this scenario, supply chain disruption reaches levels not seen since the pandemic levels and energy costs rise sharply for a second time since the pandemic.
This box is based on ONS data from January 2024 .
The prospect of a widening of the current conflict in the Middle East poses a significant risk to the global economy. So far, the economic impact has primarily been from disruption to Red Sea shipping. Shipping costs from China, measured by the Shanghai Containerized Freight Index, have risen to over twice the historical average, but remain less than half their pandemic peak. The impact on global energy markets appears modest to date. But given the region’s importance to global oil and gas supply, a surge in energy prices is a key risk in a more adverse scenario.
To explore the potential impact of further instability in the region, we use the World Bank’s October 2023 ‘large scale disruption’ scenario. This involves a cut to Middle East energy supplies comparable to the 1973 oil embargo.a In this scenario, wholesale oil and gas prices both rise to 75 per cent above our central forecast. Gas prices peak in early 2025 and oil prices peak in mid-2024 at an all-time nominal high. After a year, prices of both commodities quickly fall back to our central forecast. We also assume that disruption to global supply chains for goods intensifies and peaks in the final quarter of 2024.b
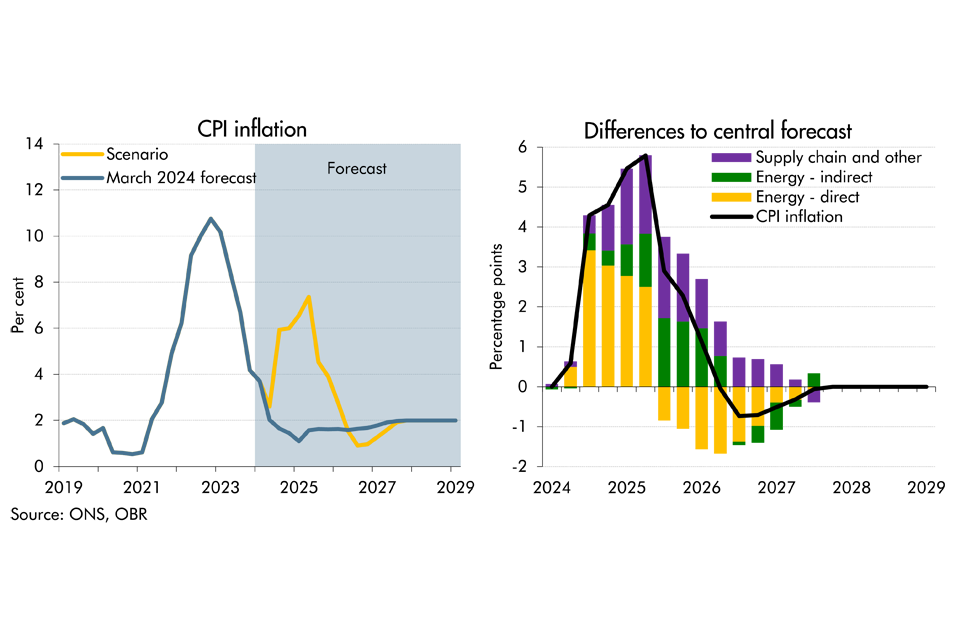
In this scenario, CPI inflation reaches a peak of 7.4 per cent in the second quarter of 2025 (Chart B). Informed by the recent energy shock and our analysis of its pass through to inflation, we assume inflation falls back towards baseline more slowly than it rose.c By the end of the forecast period, the price level is 6 per cent higher than baseline. The impact is driven by:
- Direct effect of energy prices (yellow bars). Higher oil prices feed quickly into consumer prices for fuel and raise the cost of oil intensive goods such as food and transport. The Ofgem price cap slows the impact of gas prices on consumer utilities prices, which peak in mid-2025.
- Indirect effect of energy prices (green bars). The second-round effects of the energy shock then dominate. Higher energy prices pass through into tradables and non-tradables prices, with a peak effect in mid-2025, keeping inflation above baseline until the beginning of 2026.
- Impact of supply chain disruptions (purple bars). To estimate the inflation impact of further disruption to global goods trade, we compute an impulse response based on IMF research, adapted to the UK economy.d The impact peaks in mid-2025 then fades over the next two years.
Chart B: CPI inflation in the adverse scenario
Based on a modified version of our small model,e we assume Bank Rate would rise quickly in response to the shock, and that higher inflation and interest rates lead to a recession lasting just over a year, starting in the first half of 2025. The output gap troughs at around -5 per cent in mid-2026. Growth under this scenario quickly rebounds as inflation eases and Bank Rate falls below our central forecast. But by 2028, the economy remains around 1½ per cent smaller as some spare capacity remains. Over a longer period, we would expect the output gap to close and real GDP and Bank Rate to return to our central forecast as the effects of the shock fade. We explore the fiscal implications of this inflation scenario in Chapter 5.
As this scenario would entail a second large upside shock to inflation in quick succession, there is a risk that households and businesses begin to expect higher medium-term inflation. Should that happen, it would push domestically-driven inflation even higher, potentially prompting a stronger Bank Rate response and weaker GDP growth.
This box was originally published in Economic and fiscal outlook – March 2024