
Box sets » Energy

As tensions have risen in the Middle East, there has been increasing concern over the possibility of a wider escalation in the region and its implications on the UK economy. In this box we considered the economic growth and inflationary implications of an adverse scenario. In this scenario, supply chain disruption reaches levels not seen since the pandemic levels and energy costs rise sharply for a second time since the pandemic.
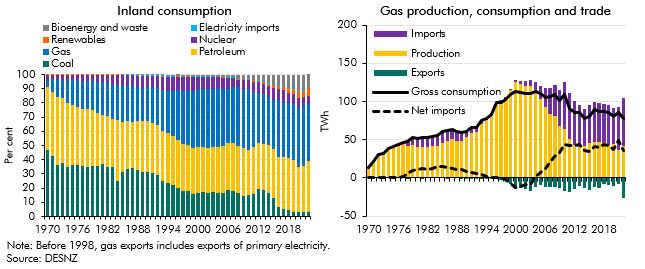
Since 1970 the UK's energy sector has undergone significant shifts following the discovery of oil and gas in the North Sea and the energy shocks of the 1970s. In this box we summarised the historical events and changes that has led to the UK has become increasingly dependent on imported gas.
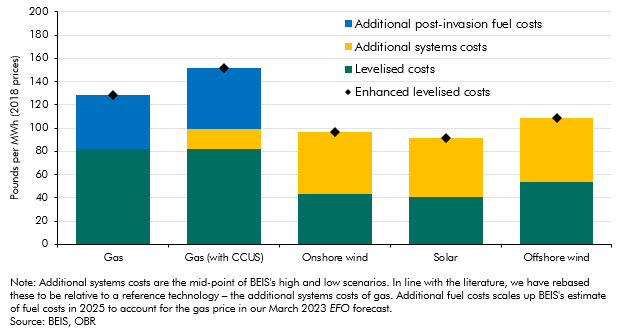
An estimate of the full cost of different energy sources to the power system needs to reflect more than just the construction and operating costs of energy generators that are captured in the levelised cost of electricity (LCOE). In this box we explored enhanced measures of levelised costs of energy.