
Box sets » Conditioning assumptions » Gas prices
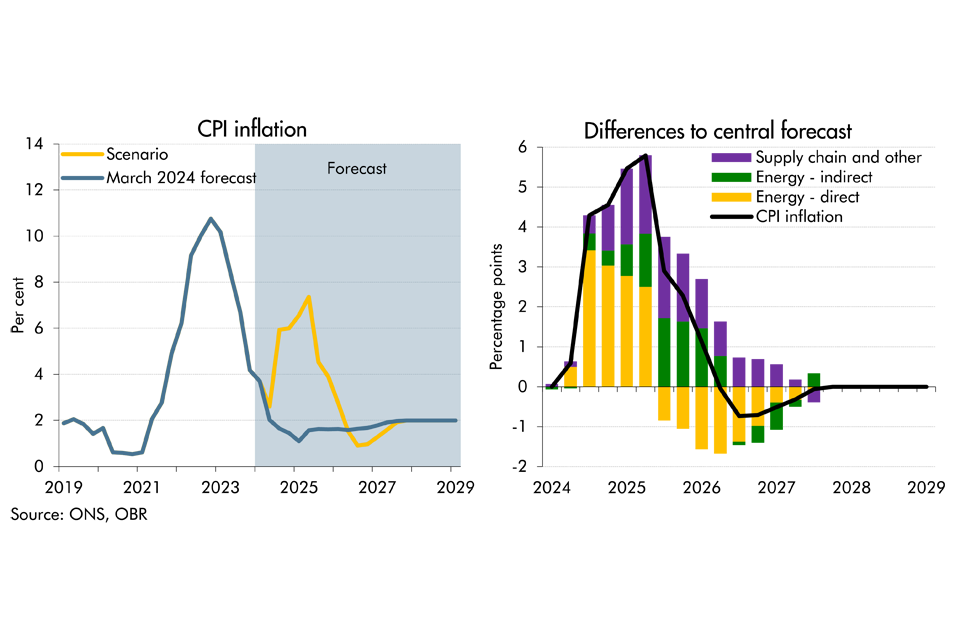
As tensions have risen in the Middle East, there has been increasing concern over the possibility of a wider escalation in the region and its implications on the UK economy. In this box we considered the economic growth and inflationary implications of an adverse scenario. In this scenario, supply chain disruption reaches levels not seen since the pandemic levels and energy costs rise sharply for a second time since the pandemic.
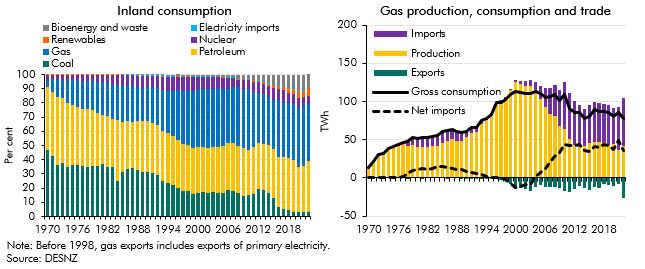
Since 1970 the UK's energy sector has undergone significant shifts following the discovery of oil and gas in the North Sea and the energy shocks of the 1970s. In this box we summarised the historical events and changes that has led to the UK has become increasingly dependent on imported gas.
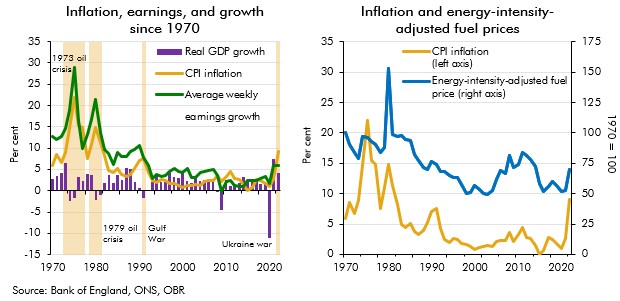
Our recent forecasts have significantly underestimated inflation outturns, with the March 2021 underestimation of inflation in 2022-23 being the largest difference between forecast and outturn since the OBR began forecasting in 2010. In this box we explored the reasons that might have driven these differences since our March 2022 forecast. In particular, we considered the extent to which the knock-on effects of higher energy prices on CPI inflation might have been higher than we originally assumed.
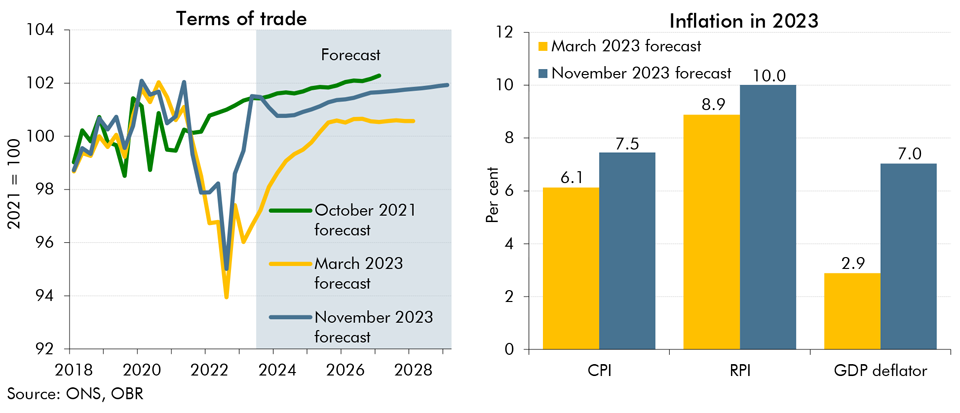
In our November 2023 forecast we expect inflation to be both more persistent and more domestically generated than in March. In this box we explored the reasons behind our assessment for inflation to be more domestically rather than externally driven and its implications for the public finances.
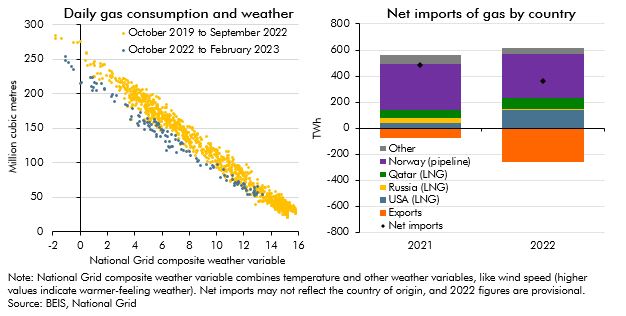
In response to the largest rise in energy prices in around 50 years, an immediate reduction in energy demand, and more gradual change in the composition of energy supply, might be expected. In this box we look at how the sharp rise in the household price of gas has changed households consumption of gas this winter as well as how the Russian invasion of Ukraine and the rise in wholesale gas prices has changed the UK's energy supply over the last year and how it may change further in the future. We then briefly outline how we forecast gas prices and why we do so.
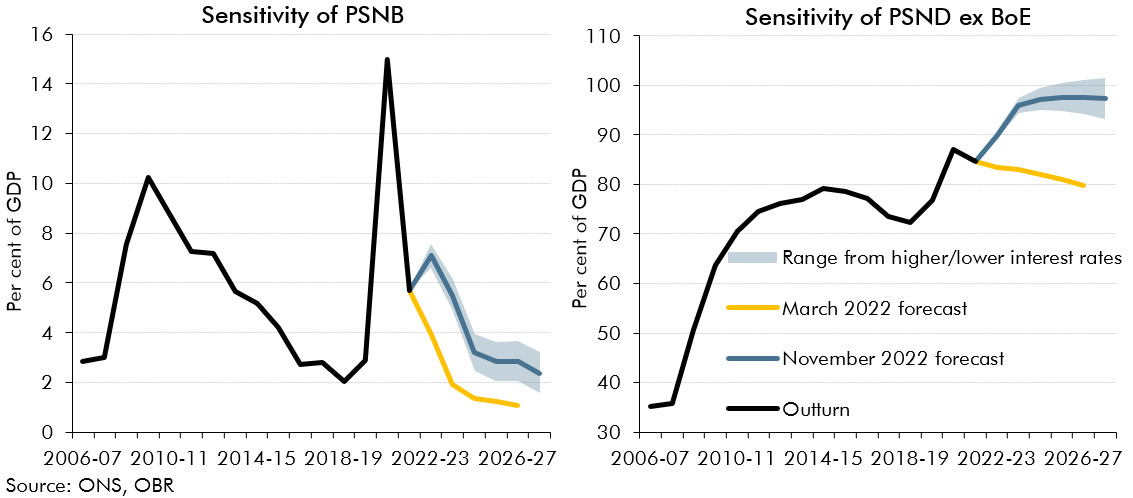
In 2022-23 we have seen sharp rises in gas prices and interest rates, both of which are forecast to remain elevated in 2023-24. This box presented the potential fiscal impacts of a higher-than forecast path for gas prices and two scenarios where Bank Rate is either a percentage point higher or lower than in our central forecast.