
Box sets » Real GDP
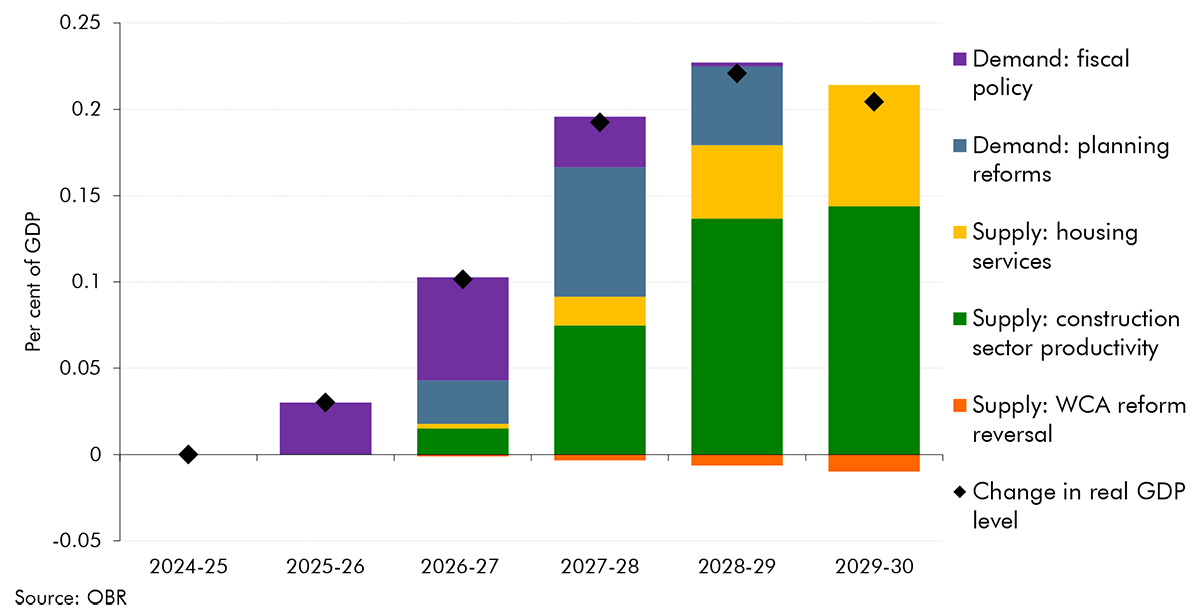
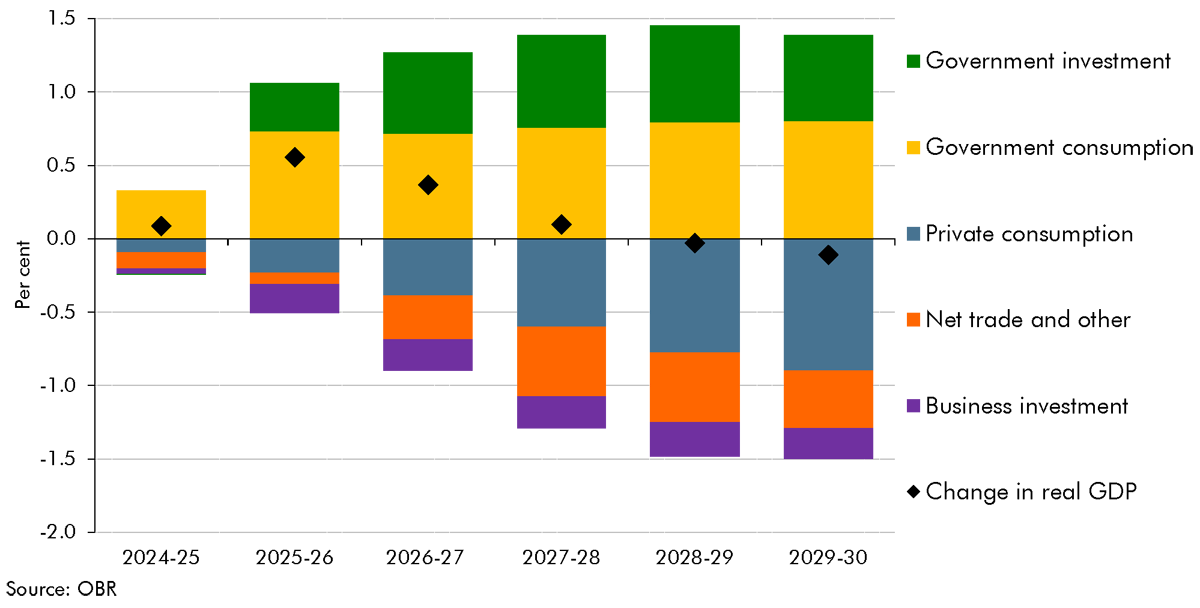
In this box, we discussed the impact that policy changes and announcements since October have on our economy forecast. Specifically, we looked at how the policy package and planning reforms affect real GDP and inflation, before also considering the impact of welfare reforms and its potential future impact.
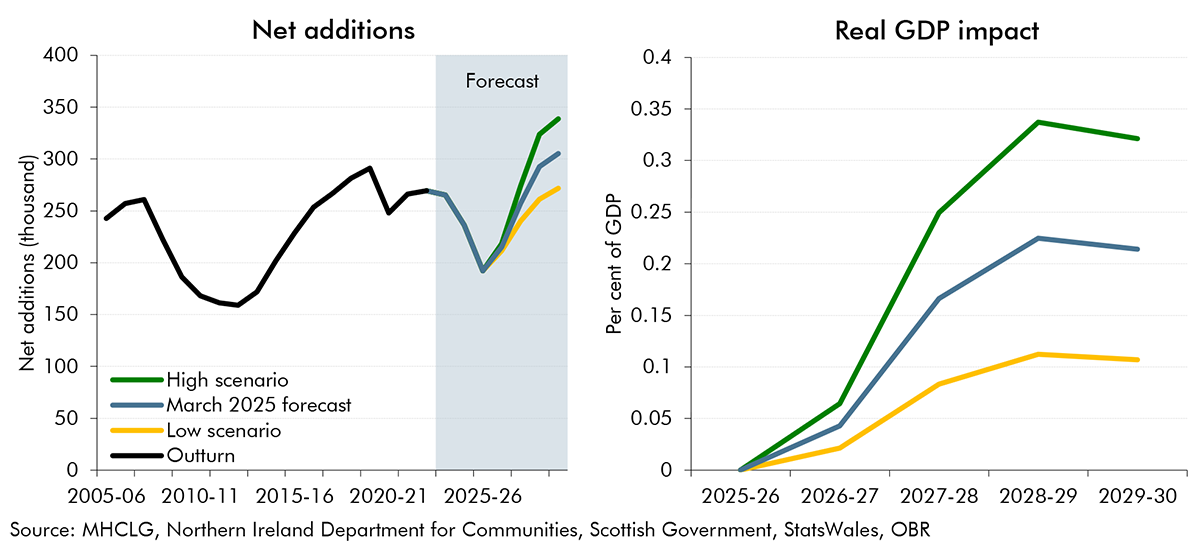
In our March 2025 forecast, we estimated that the Government's residential planning reforms will boost housebuilding by 170,000 and GDP by 0.2% by 2029-30. However, there are significant uncertainties around these estimates. In this box, we explored alternative scenarios for housebuilding and their corresponding impact on GDP.
In each Economic and fiscal outlook we publish a box that summarises the effects of the Government’s new policy measures on our economy forecast. These include the overall effect of the package of measures and any specific effects of individual measures that we deem to be sufficiently material to have wider indirect effects on the economy. In our October 2024 Economic and fiscal outlook, we adjusted our forecast to account for fiscal loosening and considered the effects of changes to taxation and increases in public investment.
As we finalised our pre-measures forecast on 26 September, our forecast did not include the Quarterly National Accounts released on 30 September 2024, which contained Blue Book 2024 consistent revisions. This box examined the potential implications that including the latest data may have had on our forecast. We judged that the data revisions would have provided limited new information on current economic conditions, leaving our economic and fiscal forecast broadly unchanged.
In each Economic and fiscal outlook we publish a box that summarises the effects of the Government’s new policy measures on our economy forecast. These include the overall effect of the package of measures and any specific effects of individual measures that we deem to be sufficiently material to have wider indirect effects on the economy. In our March 2024 Economic and fiscal outlook, we adjusted our forecast to account for fiscal loosening and considered the effects of policy to boost employment on our potential output forecast.
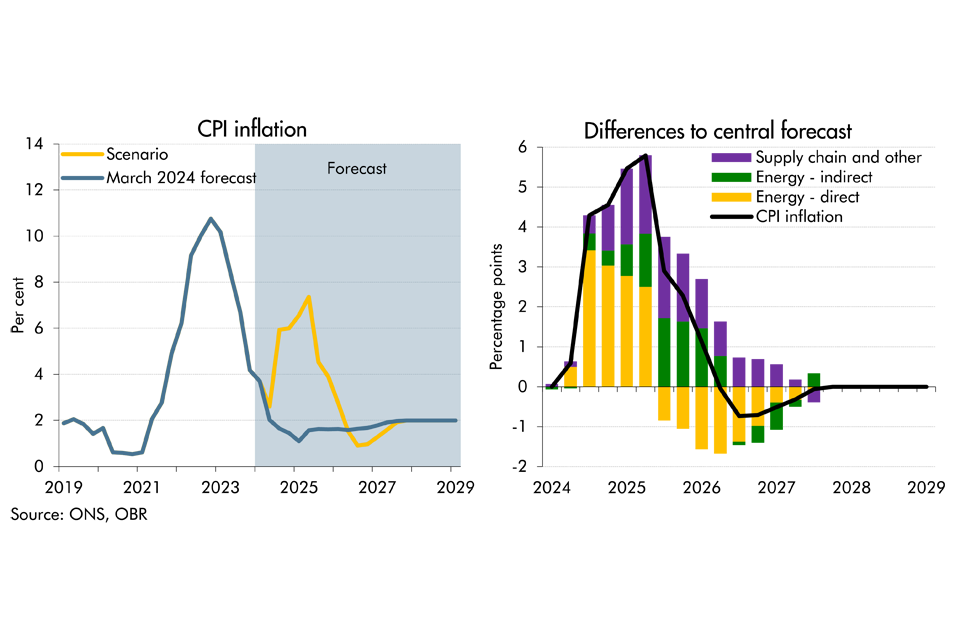
As tensions have risen in the Middle East, there has been increasing concern over the possibility of a wider escalation in the region and its implications on the UK economy. In this box we considered the economic growth and inflationary implications of an adverse scenario. In this scenario, supply chain disruption reaches levels not seen since the pandemic levels and energy costs rise sharply for a second time since the pandemic.
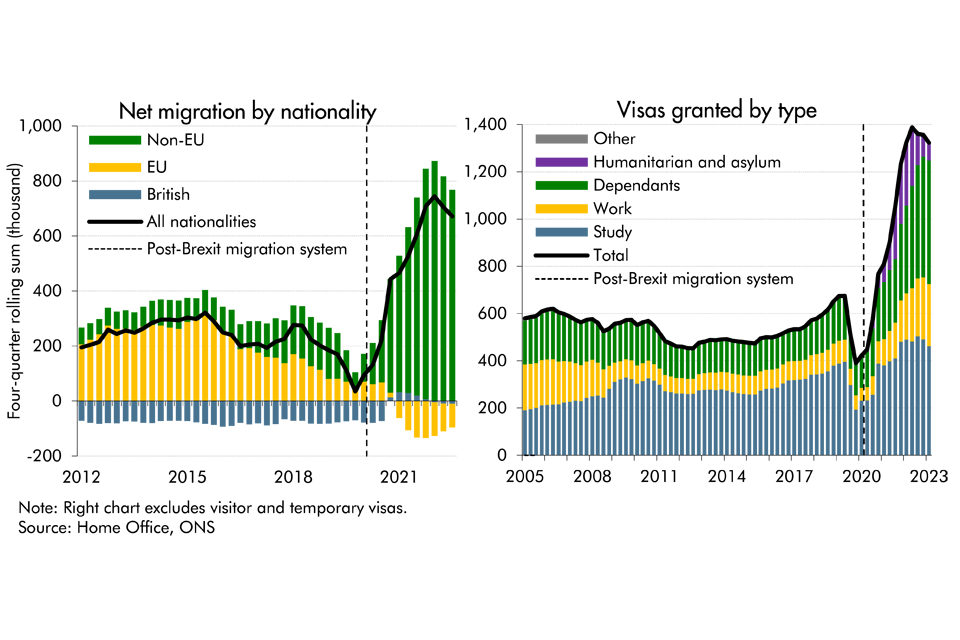
Latest data from the ONS suggest that net migration to the UK was higher than previously thought in recent years, while it's also projected to be higher than previously expected. In this box, we presented our migration forecast and its impact on labour supply. As there is considerable uncertainty around the outlook, we also considered alternative scenarios for net migration and its economic impact.
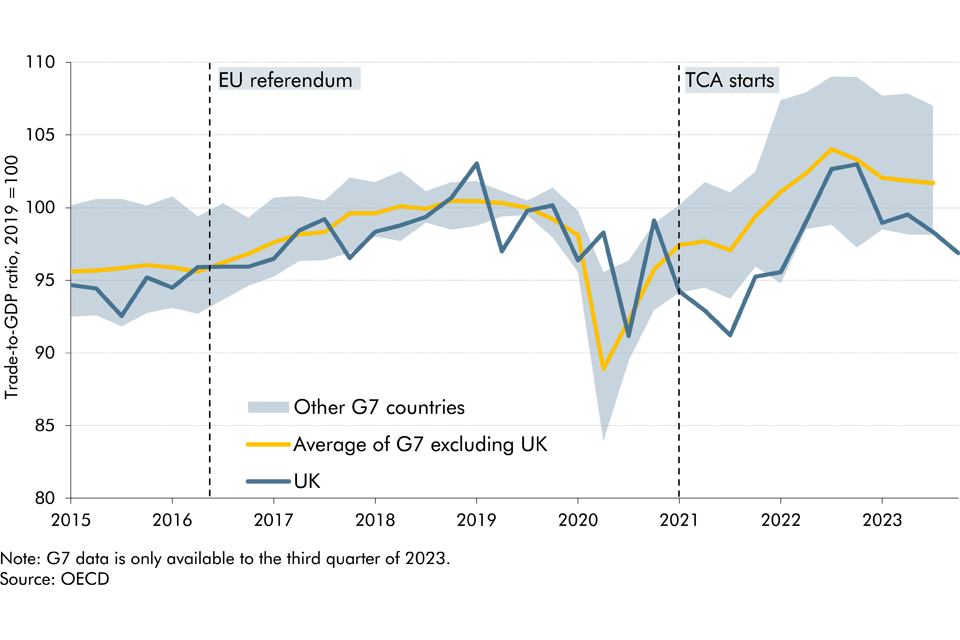
Since the June 2016 EU referendum, our forecasts have incorporated a set of assumptions about the economic impact of Brexit on trade, productivity, investment, and migration. In this box, we assessed our current assumptions on trade against the latest evidence.
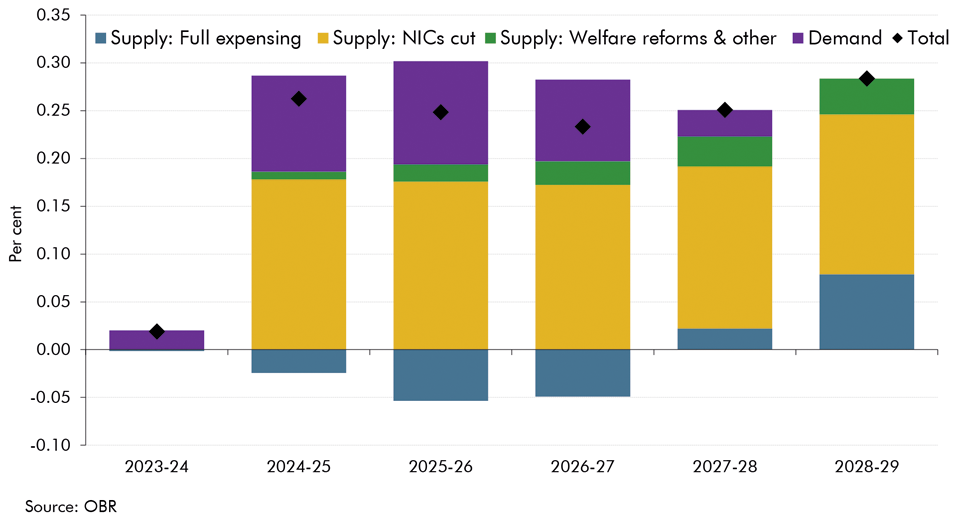
In each Economic and fiscal outlook we publish a box that summarises the effects of the Government’s new policy measures on our economy forecast. These include the overall effect of the package of measures and any specific effects of individual measures that we deem to be sufficiently material to have wider indirect effects on the economy. In our November 2023 Economic and fiscal outlook, we adjusted our forecast to account for permanent full expensing and fiscal loosening. And, we considered the effects of policy to boost employment on our potential output forecast.
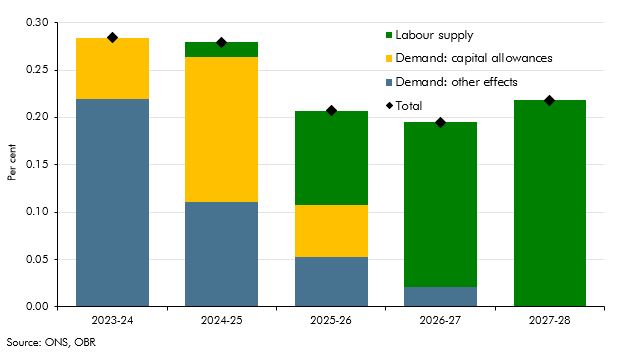
In each Economic and fiscal outlook we publish a box that summarises the effects of the Government’s new policy measures on our economy forecast. These include the overall effect of the package of measures and any specific effects of individual measures that we deem to be sufficiently material to have wider indirect effects on the economy. In our March 2022 Economic and fiscal outlook, we adjusted our forecast to account for the loosening of fiscal policy, including a temporary capital allowance. And, we considered the effects of policy to boost employment on our potential output forecast.
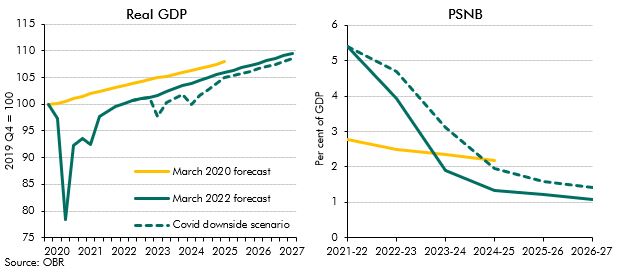
The possibility of a new vaccine-escaping Coronavirus variant cannot be ruled out. In this box we explored the possibility of such an escape and investigated the potential economic and fiscal consequences.
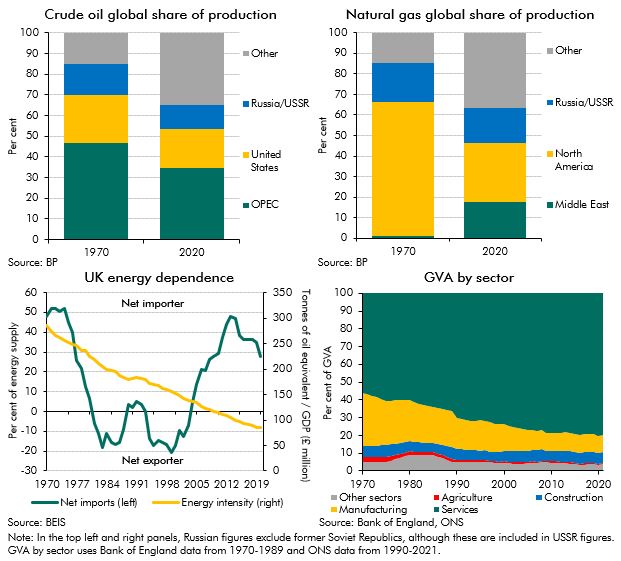
The recent surge in energy prices and its associated effects on inflation has led to comparisons with the last major global energy crisis in the 1970s. This box examined the ways in which the shocks are similar and how they are different, with a focus on how the UK economy in some ways has become more resistent to energy price shocks.
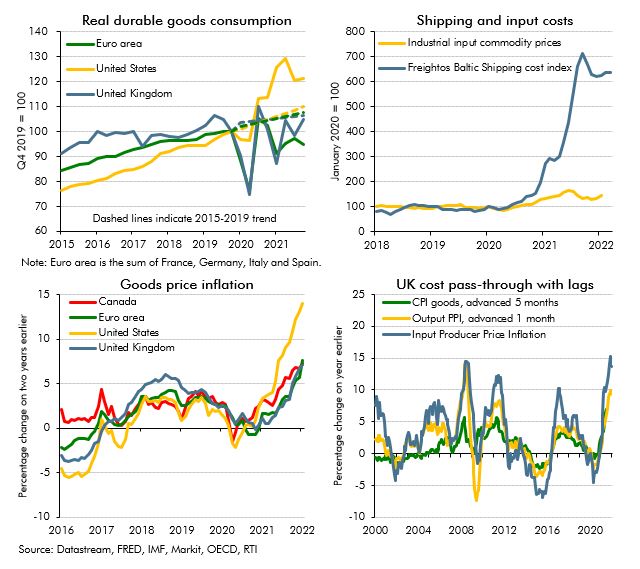
The recovery from Covid in the second half of 2021 was characterised by the emergence of imbalances between supply and demand in many markets. In this box we explored the impact of and outlook for these imbalances, or bottlenecks, in global product markets.
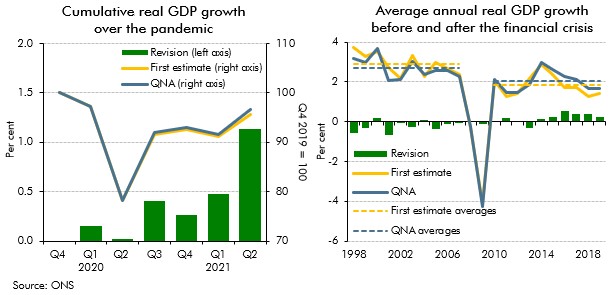
As we closed our pre-measures forecast earlier than usual at October Budget 2021, our forecast did not include the Quarterly National Accounts released on 30 September 2021, which contained Blue Book 2021 consistent revisions. This box examined the potential implications that including the latest data may have had on our forecast. We judged that the data revisions and other developments since we closed our forecast would have largely offset one another, leaving our economic forecast broadly unchanged.
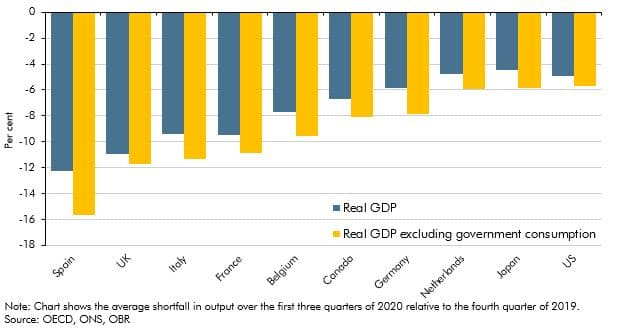
The coronavirus pandemic has affected economies of all countries around the world as a result of public health measures and voluntary social distancing. In this box we assessed how the UK had fared relative to other major advanced economics by examining the effect of using different measures of government output, the composition of these economies and the severity of the virus.
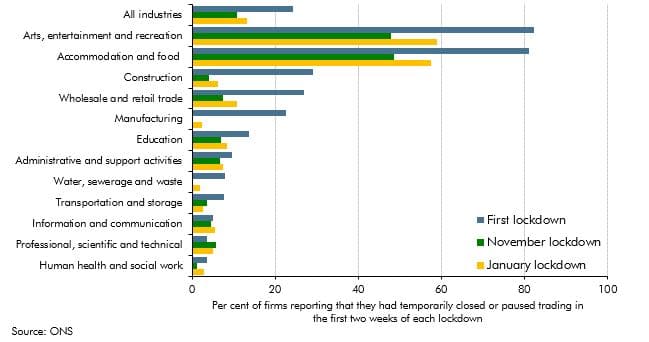
Output held up better in November 2020 than we had expected at the time of our November 2020 forecast. In light of this, this box considered whether the economy had become increasingly adapted to operating under lockdowns and other public health restrictions since the onset of the pandemic, and the implications that this might have had for the economy during the January 2021 lockdown.
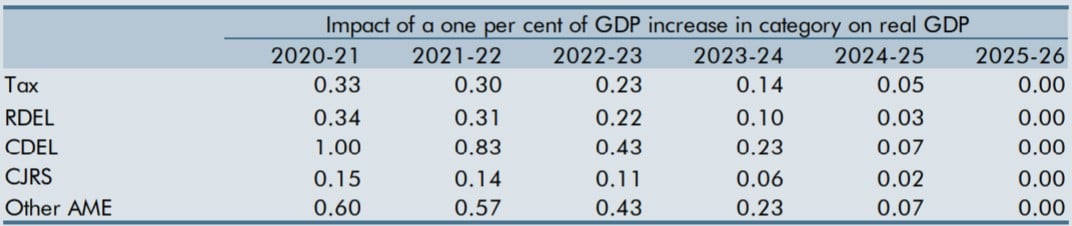
The unusual nature and size of the prevailing economic shock, and the Government’s fiscal response, raised the question of whether our usual fiscal multipliers were appropriate at the time. This box set out competing arguments for the multipliers being larger or smaller than those we usually employ and concluded that we would leave them largely unchanged.
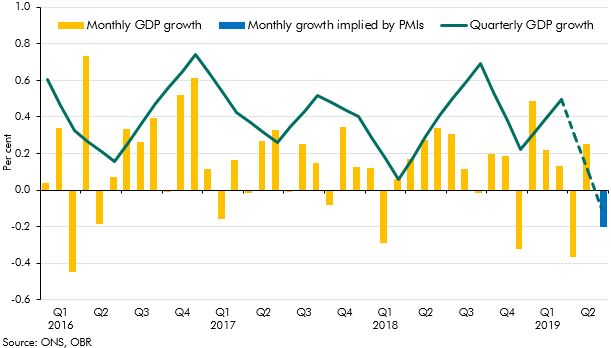
Monthly output data and the PMIs weakened in the second quarter of 2019, leading some commentators to suggest GDP would fall. This box considered what was behind the weaker data and whether it would persist into the third quarter, leading to a technical recession.
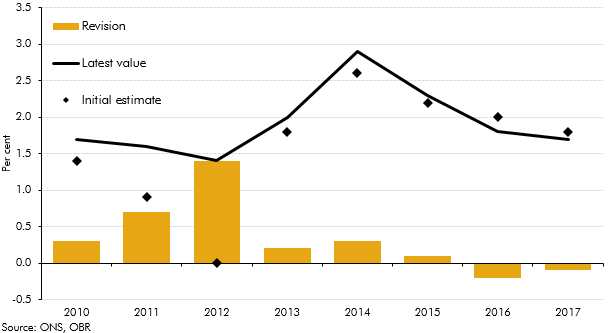
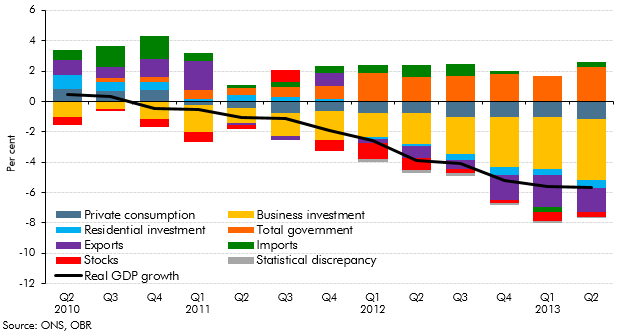
Revisions to National Accounts data are a normal part of the Blue Book process, which reconciles the different measures of GDP and incorporates information from annual data sources. This box explored how the estimated path of real GDP growth since 2010 has evolved over time, focusing in particular on revisions to GDP growth in 2012.
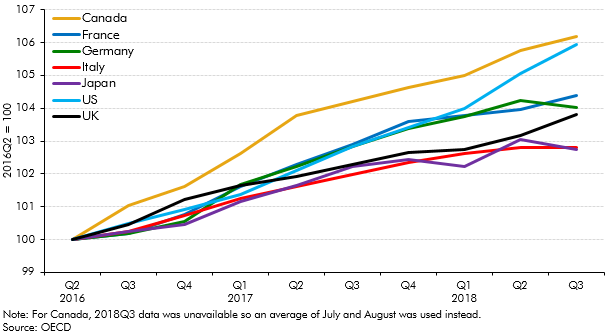
The vote to leave the EU had caused in a a slowdown in real GDP growth in the UK, with the main driver being weak investment growth. This box compared UK growth and investment since the referendum to that in the other major advanced countries in the G7.
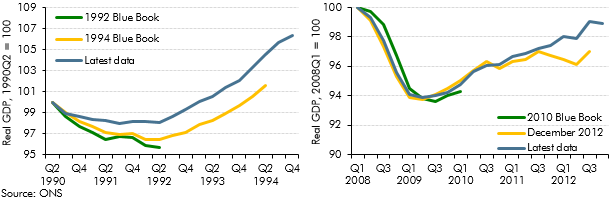
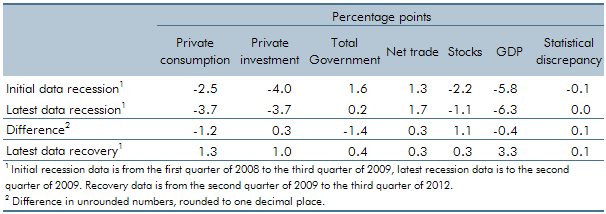
Revisions to National Accounts data are a normal part of the Blue Book process, which reconciles the different measures of GDP and incorporates information from annual data sources. This box explored how the estimated path of the 1990-92 and 2008-09 recessions and subsequent recoveries evolved over time, focusing in particular on revisions to GDP growth in 2011 and 2012.
Over the past six years there has been a large discretionary fiscal tightening in the UK. This box set out estimates of the effect of fiscal policy changes on GDP growth, based on estimates of the consolidation produced by the Institute for Fiscal Studies (IFS) together with estimates of fiscal multipliers, which are drawn from the available empirical literature. The box also considered how changes in discretionary fiscal policy compared with our forecast errors for GDP growth.
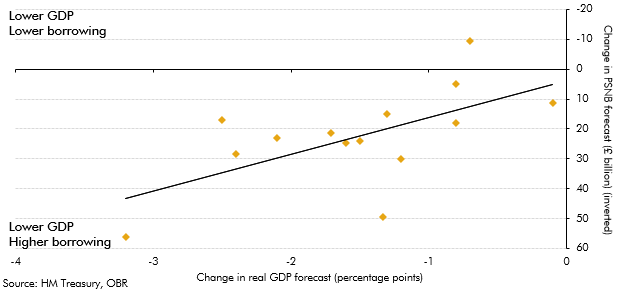
Our 2016 Forecast evaluation report was published around four months after the EU referendum was held. Over that period forecasters had revised their real GDP growth and borrowing forecasts. This box summarised those revisions and the relationship between them. It illustrated the uncertainty that forecasters faced in trying to predict the impact of the referendum result and Brexit on the economy and public finances.
Between 2012 and 2014, growth in the UK picked up, outpacing all other members of the G7. This box provided wider context for this strength in UK growth, comparing GDP, employment and productivity growth across G7 countries since 2008.
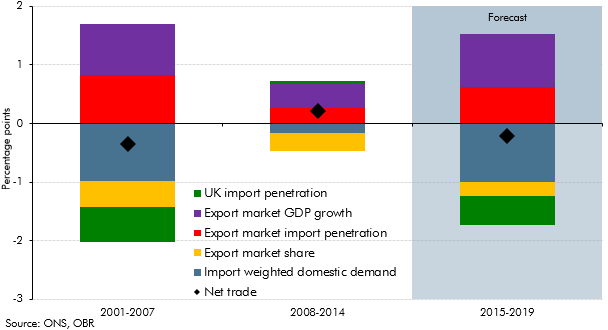
This box decomposed the net trade contribution to GDP growth into its various drivers, to illustrate the sources of the negative contribution in the seven years before the late-2000s recession, the positive contribution in the seven years after the recession and the negative contribution in the December 2014 forecast.
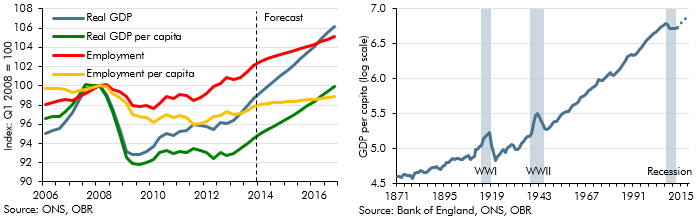
This box showed how growth in some of the key economy variables between 2010 and 2013 was lower when measured on a per capita basis. We also discussed our forecast for productivity growth at that time, given its importance in determining GDP per capita growth in the medium term.
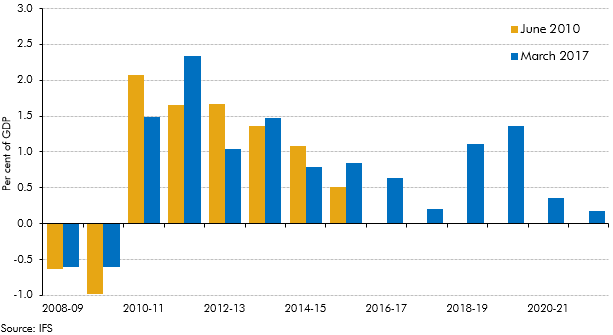
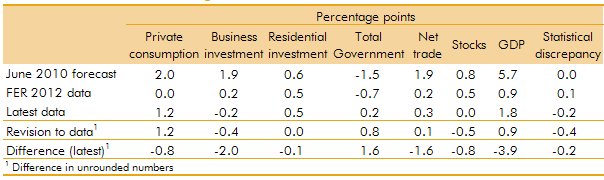
Each autumn, we publish our Forecast evaluation report (FER), a detailed examination of the performance of past economic and fiscal forecasts relative to the latest outturn data. This box discussed cumulative errors in our June 2010 real and nominal GDP forecasts in light of the significant revisions made by the ONS to real GDP growth between mid-2010 and mid-2012, and the implications this has had for the performance of our June 2010 public sector borrowing forecast
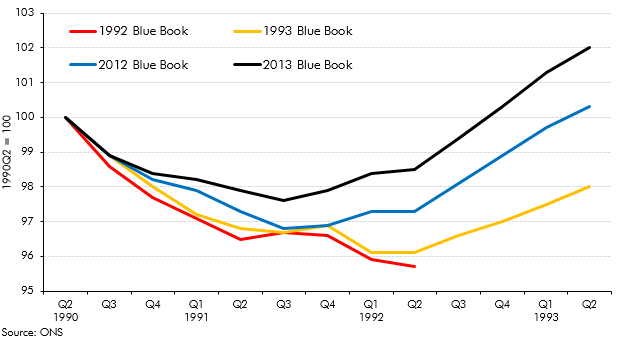
Revisions to National Accounts data are a normal part of the Blue Book process, which reconciles the different measures of GDP and incorporates information from annual data sources. This box explored how the estimated path of the 1990s recession and recovery evolved from estimates made in the 1992 Blue Book to estimates made in the 2013 Blue Book.
In our 2012 Forecast Evaluation Report, we noted that nominal GDP had held up closer to our June 2010 forecast than real GDP, helping to explain why our fiscal forecasts out to 2011-12 had remained broadly on track. This box in our 2013 Forecast Evaluation Report discussed how this assessment changed in light of revisions to GDP data. While nominal GDP now appeared to be weaker than forecast, the relatively tax-rich components - such as nominal consumption and wages and salaries - held up relatively well.
Revisions to National Accounts data are a normal part of the Blue Book process, which reconciles the different measures of GDP and incorporates information from annual data sources. This box explored the different picture of the late 2000s recession and recovery in light of the 2012 Blue Book.
In October 2011, we published our first Forecast evaluation report (FER). This box summarised the key findings, including a discussion of weaker than expected GDP growth and why, despite this, public sector borrowing has fallen broadly as we expected it would.
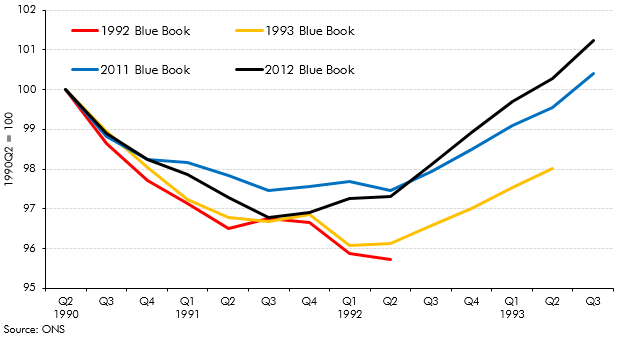
Each year, the ONS publishes the National Accounts ‘Blue Book’. The revisions it contains are often a source of revisions to our subsequent forecasts. In this box, we illustrated the scope for history to be rewritten by exploring how the reported pattern of the recession and recovery of the early 1990s had evolved between the Blue Books published shortly after the recession and the most recent Blue Books available at the time.
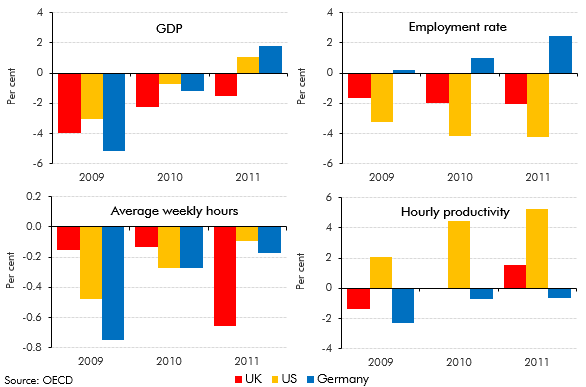
The UK, the US and Germany all saw broadly similar falls in GDP over 2009, but their labour markets responded differently. This box discussed these differences and compared the behaviour of employment, hours and productivity over this period.
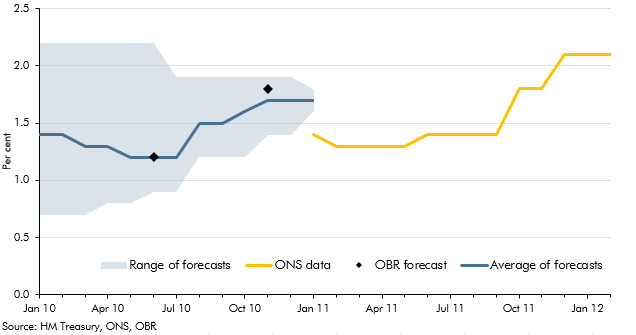
Both forecasts and National Accounts data are subject to revision. This box discussed how outside forecasts for growth in 2010 evolved through that year and compared these forecasts with ONS outturns, from the ONS' first estimate made in January 2011 through to their latest available estimate in February 2012.
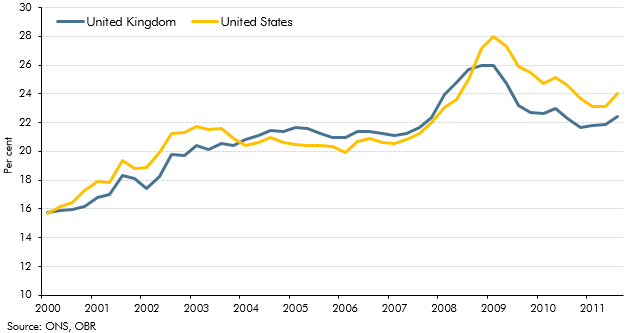
The path of the household debt-to income ratio since the crisis had led outside commentators to conclude that household deleveraging had further to run in the UK than the in the US. This box discussed some of the limitations of debt-to-income as a measure of leverage. An alternative measure is the debt to equity ratio - which takes into account both household assets and liabilities - which indicated that household leverage had fallen more slowly in the US than in the UK since the crisis.
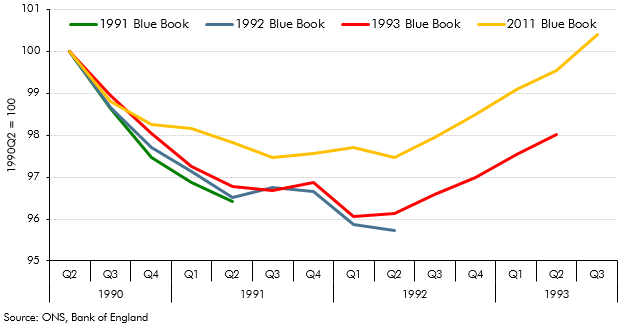
Revisions to National Accounts data are a normal part of the Blue Book process, which reconciles the different measures of GDP and incorporates information from annual data sources. This box explored how the estimated path of the 1990s recession and recovery evolved from estimates made in the 1992 Blue Book to estimates made in the 2011 Blue Book.
Revisions to National Accounts data are a normal part of the Blue Book process, which reconciles the different measures of GDP and incorporates information from annual data sources. This box set out the key differences between the vintage of data used for the purposes of the October 2011 Forecast Evaluation Report and the data consistent with the 2011 Blue Book.