
Box sets » Labour market » Productivity
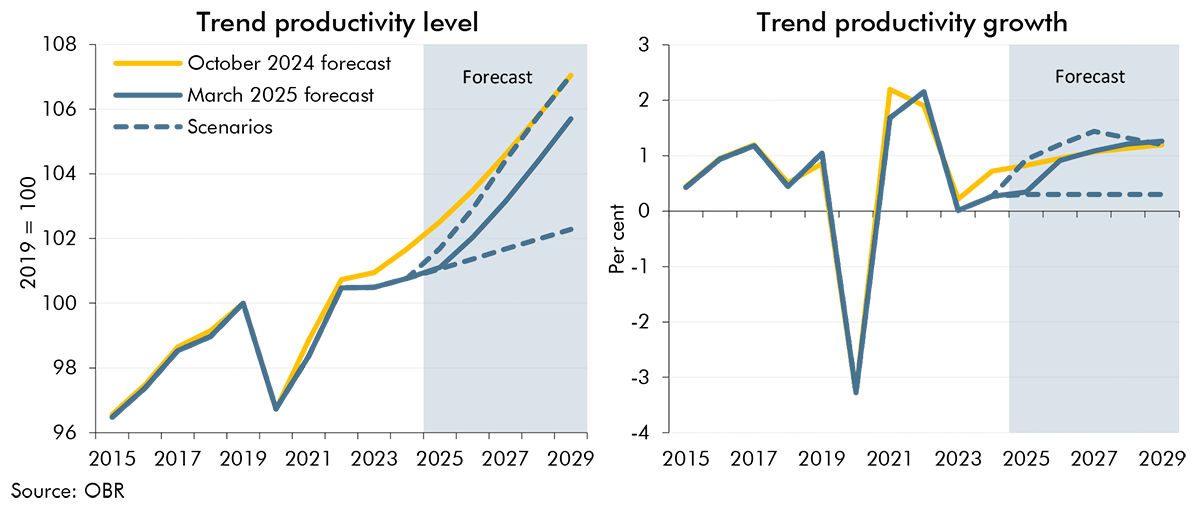
The outlook for trend productivity is one of the most important and uncertain forecast judgements. Successive past forecasts for trend productivity have proven to be too optimistic as productivity growth has continued to disappoint. In this box we explored two alternative scenarios for trend productivity: One where the recent weakness in trend productivity growth persists throughout the forecast period and one where it proves to be entirely cyclical and is offset by higher growth in the near-term.
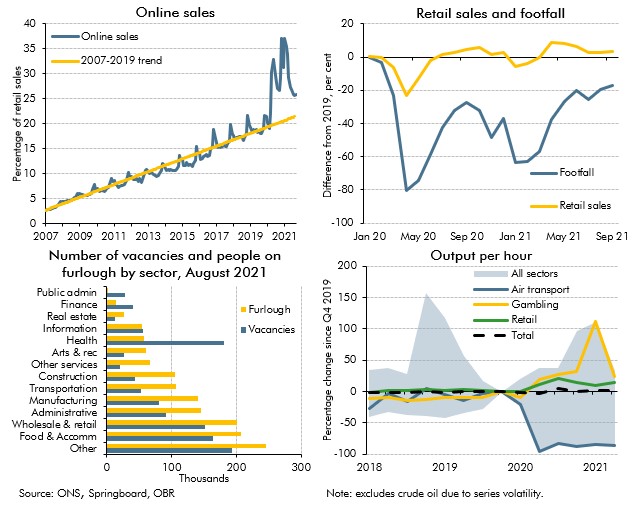
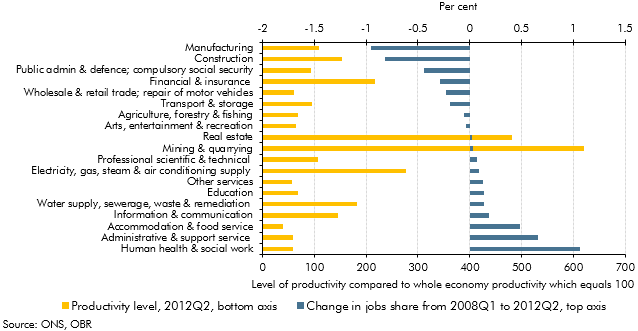
Covid-19 caused dramatic changes in people's behaviour, which affected where, what and how much economic activity took place. In this box we examined the changes which appeared likely to outlast the pandemic, and the progress the economy had made in adjusting to them.
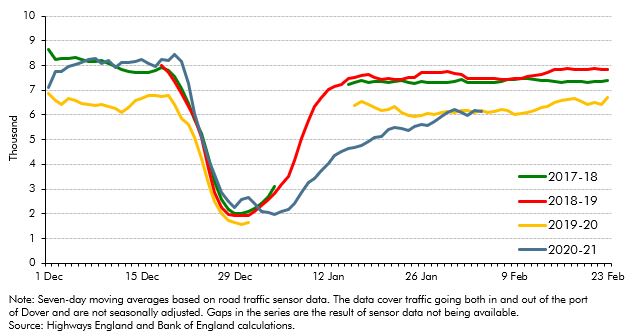
On 24 December, four and a half years after the EU referendum, the UK and the European Union concluded the Trade and Cooperation Agreement (TCA). This box compared the provisions of the TCA against our previous broad-brush assumption that UK-EU trade would take place under the terms of a ‘typical’ free-trade agreement. It also discusses the initial evidence regarding its short-term impact.
On 31 January 2020, the UK left the EU and the transition period was set to finish at the end of 2020. This box set out our estimate of the effect of the EU referendum result on productivity to date. It also outlined the effect that leaving the EU and trading under the terms of a typical free trade agreement - which we assumed in this forecast - will have on productivity in the long run.
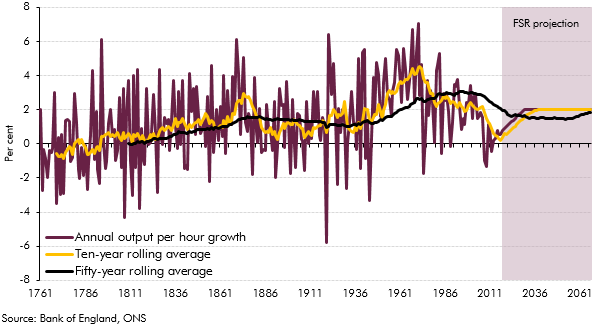
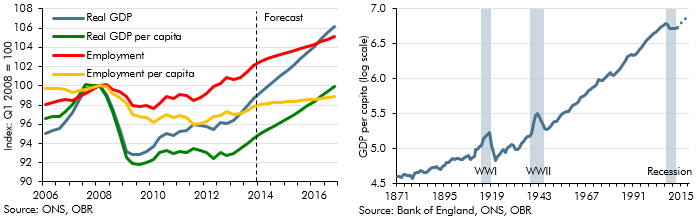
In our November 2017 EFO, we revised down our forecast for trend productivity growth so that it reached 1.2 per cent a year at the end of the medium-term horizon. For the purposes of the long-term projections in our 2018 FSR, we assumed that productivity growth would rise beyond the medium term to reach 2.0 per cent a year from 2030-31 onwards. In this box we provided context for our long-term assumption by exploring the rises and falls in UK productivity growth over the past two-and-a-half centuries.
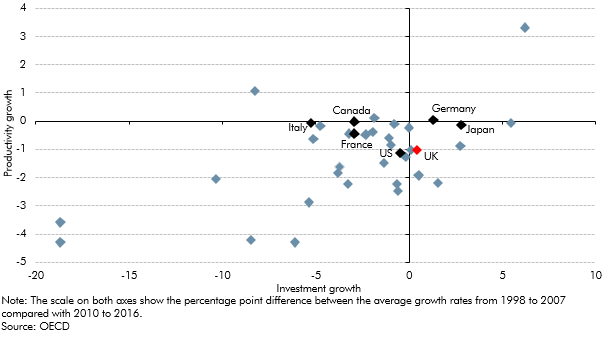
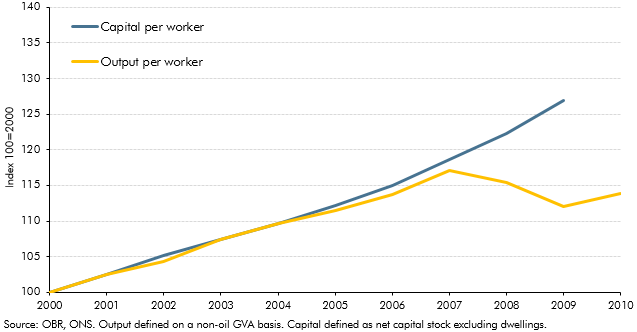
The outlook for productivity growth is one of the most important and yet uncertain areas of our economy forecast. In this box from our March 2018 EFO we looked at how actual productivity growth can be broken down into contributions from capital deepening and total factor productivity (TFP) growth and how differences in investment across countries could be related to post-crisis productivity performance.
Our first post-EU referendum forecast in November 2016 assumed that leaving the EU would result in a less open economy and lower productivity, but we did not incorporate an explicit link between the two over our medium-term forecast horizon. This box from our March 2018 EFO discusses why we did not include this link and what other forecasters have assumed.
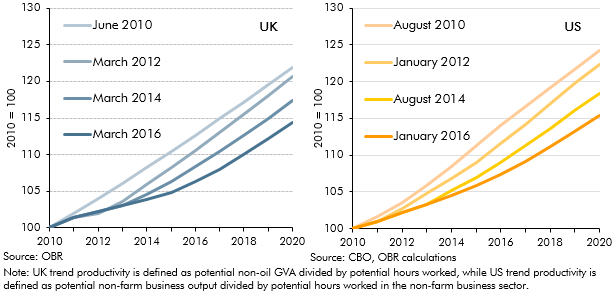
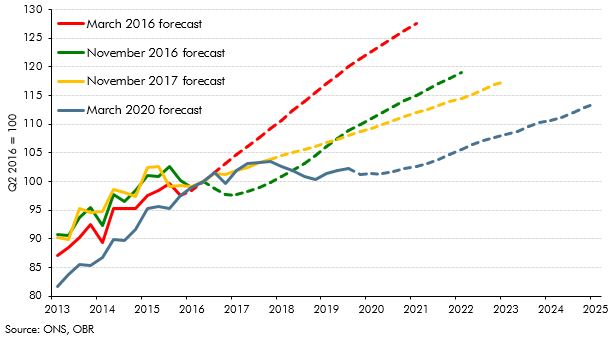
The path of productivity growth is a key driver of GDP growth in our forecast and is also one of the most uncertain judgements. In March 2016, given persistent weakness in outturn data, we revised down our forecast for productivity growth. But this issue was not specific to the UK, with productivity having disappointed in many other major advanced economies. This box compared different vintages of UK and US productivity and potential output forecasts since 2010 to illustrate this point.
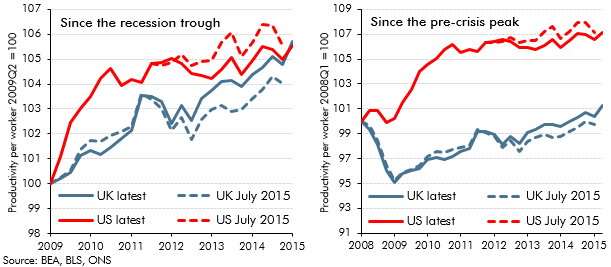
Recent estimates of UK GDP growth represent an early draft of economic history that will be revised, often substantially, over time. OECD found that initial estimates of UK GDP growth have tended to be revised up over time. This box also highlights revisions to estimates of US and UK productivity growth between July and November 2015, and the substantial productivity shortfall relative to the US and relative to the pre-crisis trend in the UK.
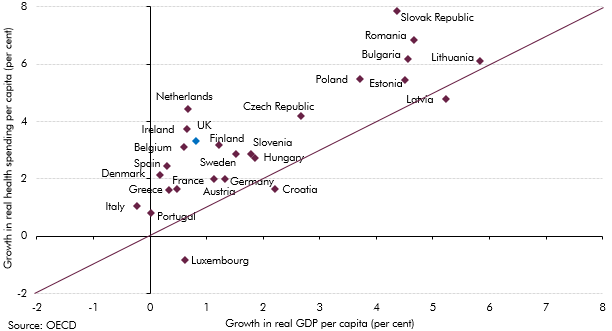
Health spending rose faster than GDP in almost all European countries over the past decade. This box investigated most notable long-term drivers of real spending on health care: demographic effects, income effects and other cost pressures.
Between 2012 and 2014, growth in the UK picked up, outpacing all other members of the G7. This box provided wider context for this strength in UK growth, comparing GDP, employment and productivity growth across G7 countries since 2008.
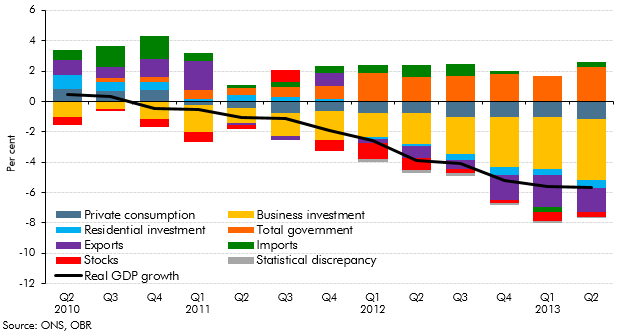
This box showed how growth in some of the key economy variables between 2010 and 2013 was lower when measured on a per capita basis. We also discussed our forecast for productivity growth at that time, given its importance in determining GDP per capita growth in the medium term.
Each autumn, we publish our Forecast evaluation report (FER), a detailed examination of the performance of past economic and fiscal forecasts relative to the latest outturn data. This box discussed cumulative errors in our June 2010 real and nominal GDP forecasts in light of the significant revisions made by the ONS to real GDP growth between mid-2010 and mid-2012, and the implications this has had for the performance of our June 2010 public sector borrowing forecast
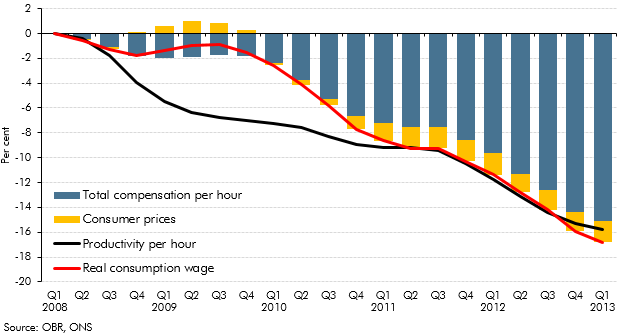
In the years following the late-2000s recession, productivity growth remained subdued, which would be expected to lead to lower wages. This box showed that while the real product wage grew more strongly than productivity growth since 2008, real consumption wage growth was weaker.
Productivity growth since the late-2000s recession has been relatively weak. This box set out some proposed explanations for that weakness, including measurement issues, lower investment, compositional effects, labour market factors and impaired financial markets. Most commentators believed that some combination of these factors was likely to be responsible. The relative importance of these factors also has implications for the extent to which the shortfall was believed to be demand or supply-related.
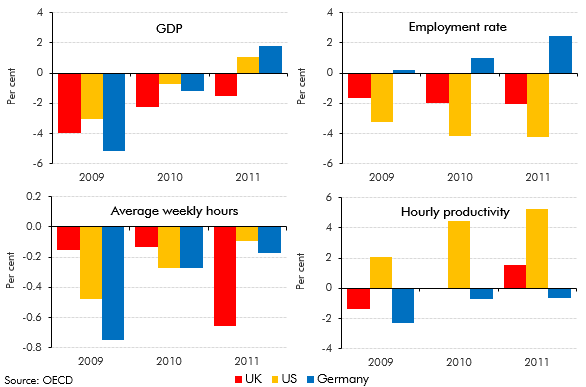
The UK, the US and Germany all saw broadly similar falls in GDP over 2009, but their labour markets responded differently. This box discussed these differences and compared the behaviour of employment, hours and productivity over this period.
Potential output growth had been relatively weak in the period following the late-2000s recession. This box discussed some possible reasons, noting that indicators available at the time did not indicate a structural deterioration in the labour market.