
Productivity growth since the late-2000s recession has been relatively weak. This box set out some proposed explanations for that weakness, including measurement issues, lower investment, compositional effects, labour market factors and impaired financial markets. Most commentators believed that some combination of these factors was likely to be responsible. The relative importance of these factors also has implications for the extent to which the shortfall was believed to be demand or supply-related.
This box is based on ONS productivity data from September 2012 .
Since the start of the financial crisis productivity has fallen considerably and remains significantly below its pre-crisis peak. Output per hour and output per worker, on a non-oil GVA basis, were around 15 per cent below their pre-crisis trend level in the third quarter of 2012. These gap estimates rely on past productivity trends being good indicators of the future. Productivity growth may have been unsustainably strong in the run up to the crisis, in which case extrapolating that performance might slightly overstate the shortfall.
There are a number of possible explanations for the weakness of productivity and most commentators believe no single factor can explain the entire puzzle. Which combination of factors you favour determines how much of the puzzle you believe to be demand related, and likely to reverse, and how much supply related, and therefore representing a fall in the output potential of the economy. This is a key judgement for any medium-term forecast. This box explores some of the possible explanations.
1. Measurement
As discussed in detail in our latest Forecast evaluation report, the ONS has made significant revisions to the path of past recessions. So one potential explanation for the recent weakness of productivity is that GDP is being under-measured and/or employment over-measured and that the puzzle will be revised away in future. The latest data, for example, suggest that all the loss of GDP during the 1990s recession had been recouped by the second quarter of 1993, while the National Accounts published at the time suggested that only half had been. But it is impossible to say whether we will see similar revisions to the most recent recession and recovery.
The ONS addressed this issue in a recent paper.a It found that so far nothing had come to light which would lead them to have major concerns about the reliability of the statistics for both GDP and the labour market. Future revisions would need to be very large to explain a significant part of the puzzle.
2. Slowdown in investment growth
Weak investment growth in the wake of the financial crisis (due, for example, to impaired financial markets and weak demand) could have reduced the amount of capital that workers have to work with. But comparing our current estimate of the capital labour ratio (using capital per hour worked) to a level consistent with pre-crisis growth suggests that this would explain at most around 1.5 percentage points of the 15 per cent gap.
3. Composition
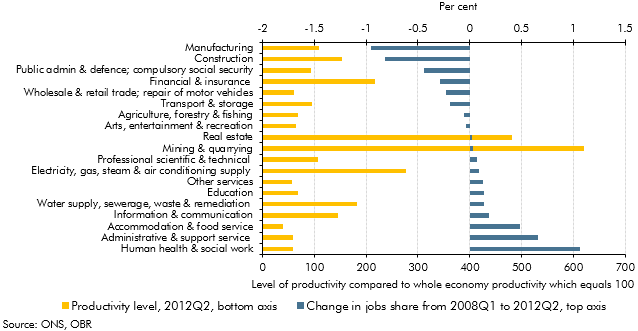
Another explanation could be a sectoral shift from high productivity to low productivity sectors, following the financial crisis. Chart A shows that between the first quarter of 2008 and the second quarter of 2012 there was a shift in jobs from some previously high productivity sectors (for example finance and construction) to less productive sectors, but overall these changes have been relatively small. On this basis we estimate this effect could explain around 1 percentage point of the shortfall in productivity on a per job basis.
Chart A: Change in sectoral job share and level of productivity
4. Labour market explanations
A number of labour market factors have been suggested as explanations for the puzzle. Most of them would fall into the demand-related category, suggesting that there is a large degree of spare capacity within firms and that as demand recovers productivity is likely to increase sharply.
One of the most frequently stated explanations is the idea that firms are hoarding labour in anticipation of a bounce back in demand. Weak real wages and the currently high corporate surplus suggest that firms might find keeping staff attractive and would be in a position to do so. There is also a possibility that some firms are unable to cut employment below a certain minimum level of operation.
But private sector hiring has also been strong, especially within struggling productivity sectors. And the strength in employment since 2010 reflects increased flows into employment rather than a drop in outflows. This suggests to us that labour hoarding is only likely to explain a small part of the puzzle. But Martin and Rowthorn (2012)b argue that these developments are consistent with the labour hoarding story. They maintain that the recent strength in hiring is concentrated within low productivity sectors, while high productivity sectors (which have more incentive to hoard labour) continue to retain staff and are not hiring.
A move towards more part-time work would explain why the initial fall in productivity was larger on a per worker basis compared to a per hour basis. However, on a productivity per hour basis the gap remains large.c
There has also been a large increase in self employment, especially the number of self-employed people working part time. HMRC data shows that the median self-employed wage has historically been below that of employees, suggesting lower average productivity. However, based on this difference, and even assuming the recent increase in self employment is all related to the crisis, it could only account for around 1 percentage point of the overall productivity gap on a per worker basis.
5. Credit rationing and impaired financial markets
A number of studies have shown a link between financial crises and weak productivity.d As well as affecting capital per worker (see item 2), there are a number other channels through which crises could affect TFP and therefore labour productivity.
Credit rationing and impaired financial markets could, for example, impede the expansion of efficient firms by lowering the supply of working capital traditionally supplied by banks. This would cause misallocation of resources across sectors in the economy or capital mismatch. Ben Broadbente has argued that the apparent increase in the dispersion of the rate of return across sectors since the crisis might suggest that some firms that have high rate of returns are capital constrained, while other ‘zombie firms’ have kept operating despite lower returns. Relatively low levels of insolvencies and liquidations, compared to previous recessions, and a drop in company births also support this theory.
This is likely to hit smaller and medium sized firms (SMEs) more than large firms, which are able to access funds more easily. Although large firms account for the majority of investment in the economy, expansion of SMEs is particularly important for productivity growth. Various studies suggest that new (small) firms can have relatively large contribution to productivity growth possibly because they enter with a more efficient mix of capital and labour and new technology.f A NESTA study from 2009 also found that most high growth firms in the UK between 2005 and 2008 had fewer than 50 employees.g There is some evidence to support the suggestion that SMEs have seen a bigger hit to productivity than larger firms. In its latest Inflation Report, the Bank of England used data from companies’ accounts to show that most of the weakness in productivity growth is concentrated among SMEs.
Another way in which tight credit conditions might have an effect on productivity is by limiting the scope for investment in R&D. A recent paper by Mehmoodh finds that access to external finance is an important determinant for innovation and long term growth. The number of patents applications from the UK to the World Intellectual Property Organization (WIPO) has fallen since 2008 suggesting a fall in R&D activity. ONS data also show a fall in real expenditure on R&D in 2008 and 2009 before picking up again in 2011.
Conclusion
It is unlikely that any single factor fully explains the fall in productivity. The balance of the arguments above suggest that a significant proportion of the 15 per cent difference between the current level and a pre-crisis trend level is structural, although there is doubtless also a cyclical element.