
Box sets » Labour market
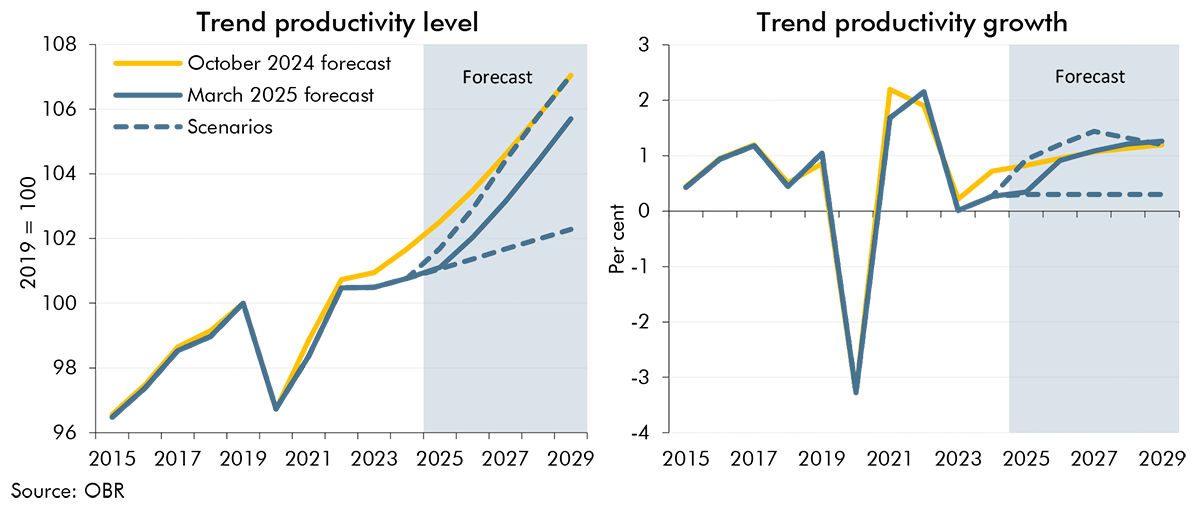
The outlook for trend productivity is one of the most important and uncertain forecast judgements. Successive past forecasts for trend productivity have proven to be too optimistic as productivity growth has continued to disappoint. In this box we explored two alternative scenarios for trend productivity: One where the recent weakness in trend productivity growth persists throughout the forecast period and one where it proves to be entirely cyclical and is offset by higher growth in the near-term.
The Pathways to Work Green Paper announced a range of welfare measures, some of which we have not incorporated in this forecast. In this box, we explained why some measures were not included, and indicated what risks they pose to our welfare spending and labour supply forecasts.
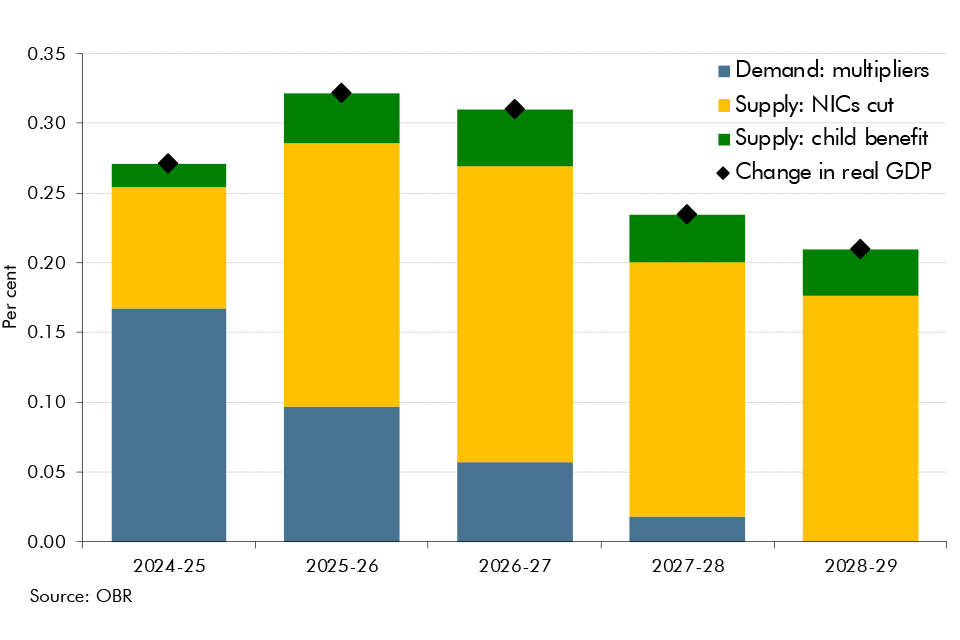
In each Economic and fiscal outlook we publish a box that summarises the effects of the Government’s new policy measures on our economy forecast. These include the overall effect of the package of measures and any specific effects of individual measures that we deem to be sufficiently material to have wider indirect effects on the economy. In our March 2024 Economic and fiscal outlook, we adjusted our forecast to account for fiscal loosening and considered the effects of policy to boost employment on our potential output forecast.
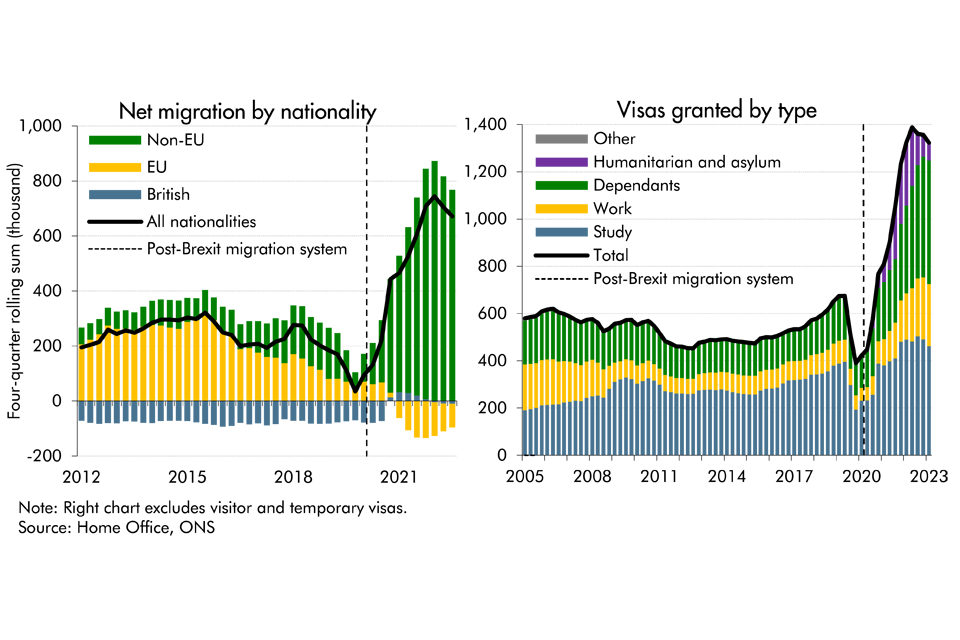
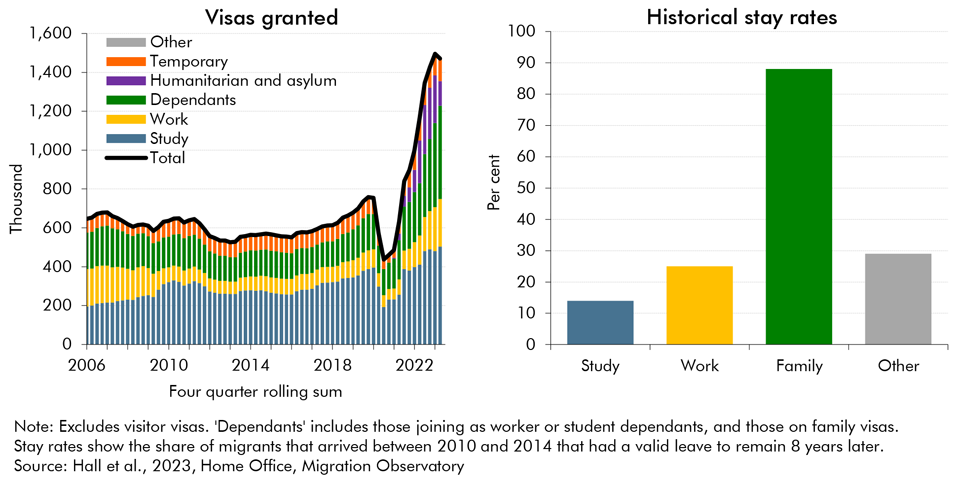
Latest data from the ONS suggest that net migration to the UK was higher than previously thought in recent years, while it's also projected to be higher than previously expected. In this box, we presented our migration forecast and its impact on labour supply. As there is considerable uncertainty around the outlook, we also considered alternative scenarios for net migration and its economic impact.
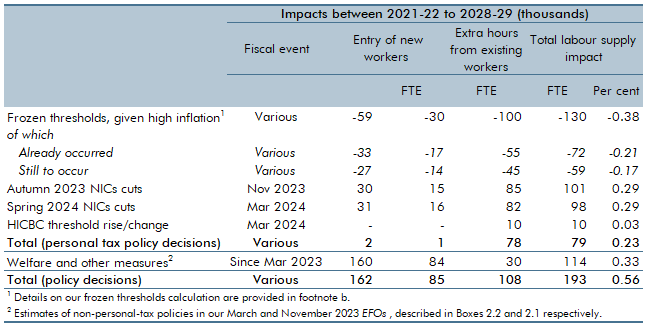
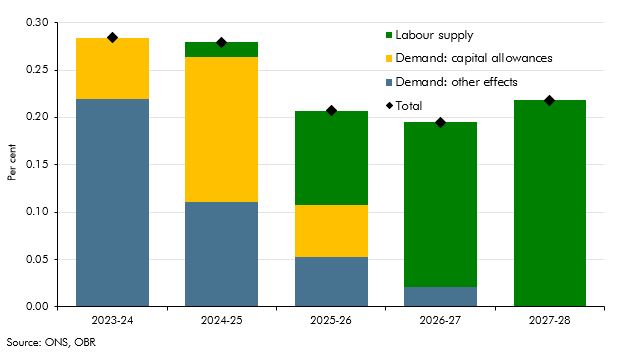
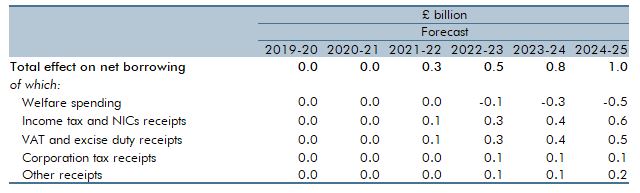
Between March 2021 and November 2022, almost all the main allowances and thresholds in income tax and national insurance contributions (NICs) were frozen rather than indexed to inflation, as is the default in nearly all cases, up to and including 2027-28. The Chancellor has subsequently announced personal tax cuts that are due to offset around a half of the resulting impact on the personal tax burden by 2028-29. In this box, we showed estimates for total effects of these policy decisions on work incentives, given high inflation, over the period from 2021-22 to 2028-29.
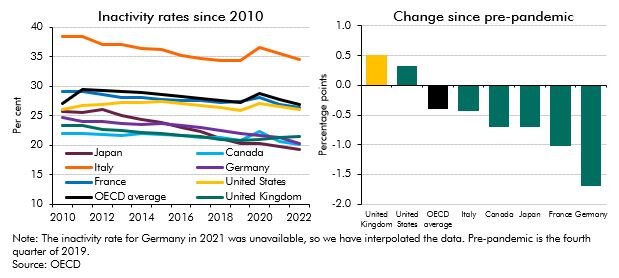
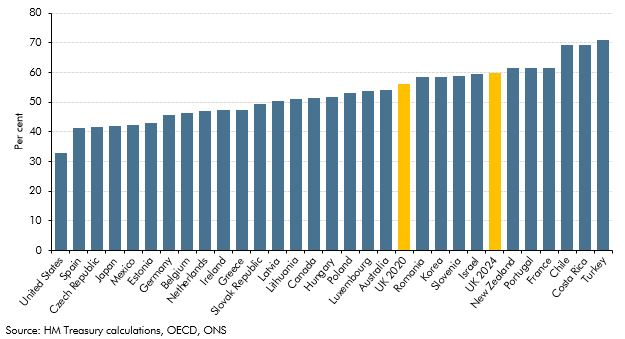
Inactivity fell across the G7 countries in the years prior to the onset of the pandemic and the UK consistently had one of the lowest inactivity rates. Since then inactivity has risen in the UK and US, but fallen across the rest of the G7 countries. This box detailed these changes and looked at ill-health as a driver of inactivity across the G7.
The referral to elective treatment waiting list in England has risen steadily since the onset of the pandemic, to 7.4 million treatments in April 2023. This box used waiting list and LFS data to estimate the effect on employment and inactivity of halving the waiting list by 2027-28.
Our recent forecasts have significantly underestimated inflation outturns, with the March 2021 underestimation of inflation in 2022-23 being the largest difference between forecast and outturn since the OBR began forecasting in 2010. In this box we explored the reasons that might have driven these differences since our March 2022 forecast. In particular, we considered the extent to which the knock-on effects of higher energy prices on CPI inflation might have been higher than we originally assumed.
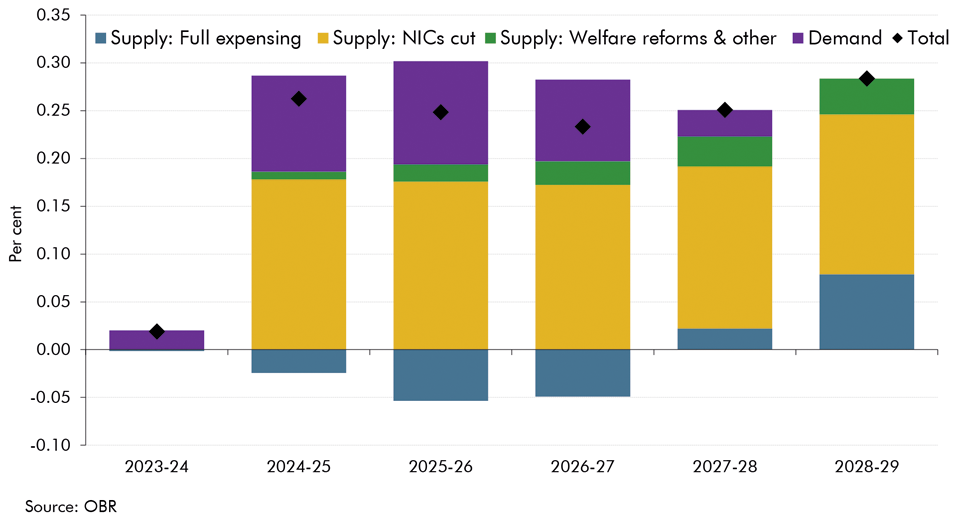
In each Economic and fiscal outlook we publish a box that summarises the effects of the Government’s new policy measures on our economy forecast. These include the overall effect of the package of measures and any specific effects of individual measures that we deem to be sufficiently material to have wider indirect effects on the economy. In our November 2023 Economic and fiscal outlook, we adjusted our forecast to account for permanent full expensing and fiscal loosening. And, we considered the effects of policy to boost employment on our potential output forecast.
Net migration to the UK increased substantially in recent years but the ONS's population projections, that normally underpin our forecast, did not fully account for that rise at the time. In this box, we explored recent trends in migration and outlined our revised near-term migration forecast. We also examined how likely the migrants were to participate in the labour market.
In each Economic and fiscal outlook we publish a box that summarises the effects of the Government’s new policy measures on our economy forecast. These include the overall effect of the package of measures and any specific effects of individual measures that we deem to be sufficiently material to have wider indirect effects on the economy. In our March 2022 Economic and fiscal outlook, we adjusted our forecast to account for the loosening of fiscal policy, including a temporary capital allowance. And, we considered the effects of policy to boost employment on our potential output forecast.
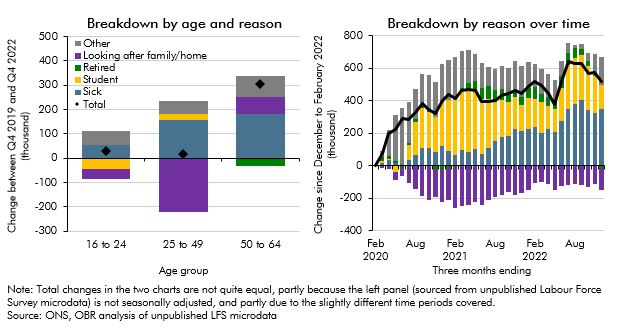
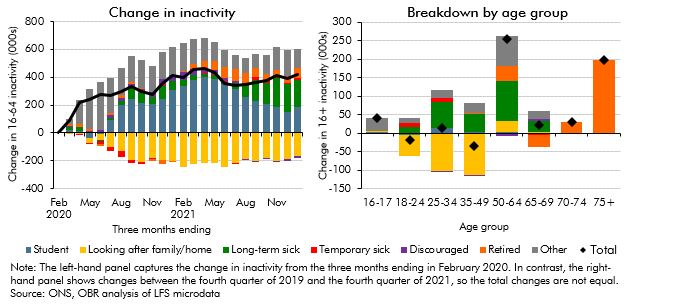
Economic inactivity rose significantly following the pandemic. This box explored the factors behind this rise, including decomposing it into different age brackets and considering the reasons behind it, as well as analysing the flows into and out of inactivity.
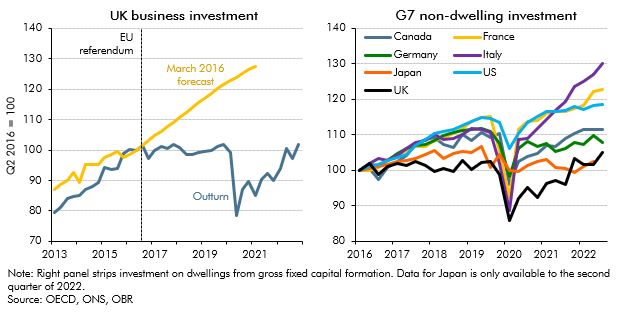
Since the June 2016 EU referendum, our forecasts have incorporated a set of assumptions about the economic impact of Brexit on trade, productivity, investment, and migration. In this box, we assessed our current assumptions against the latest evidence.
In each Economic and fiscal outlook we publish a box that summarises the effects of the Government’s new policy measures on our economy forecast. These include the overall effect of the package of measures and any specific effects of individual measures that we deem to be sufficiently material to have wider indirect effects on the economy. In our November 2022 Economic and fiscal outlook, we adjusted our economy forecast to take into account plans for the energy price guarantee (EPG) and consider the impact of tax and spending measures on the supply side of the economy.
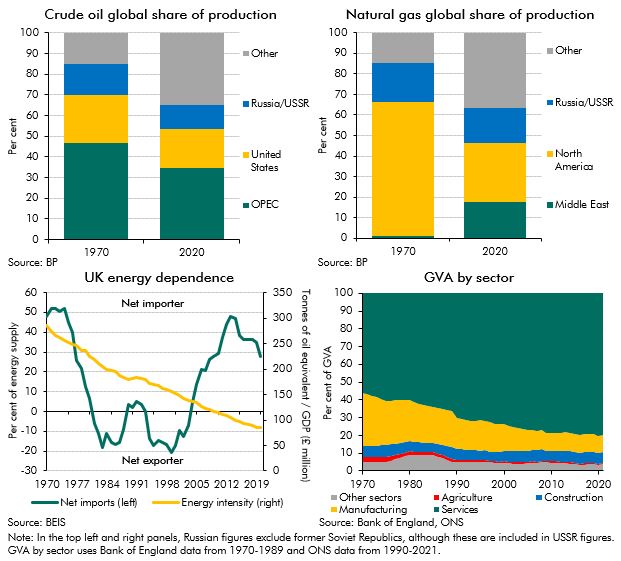
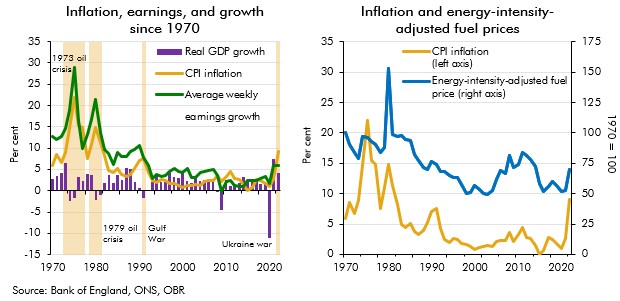
The recent surge in energy prices and its associated effects on inflation has led to comparisons with the last major global energy crisis in the 1970s. This box examined the ways in which the shocks are similar and how they are different, with a focus on how the UK economy in some ways has become more resistent to energy price shocks.
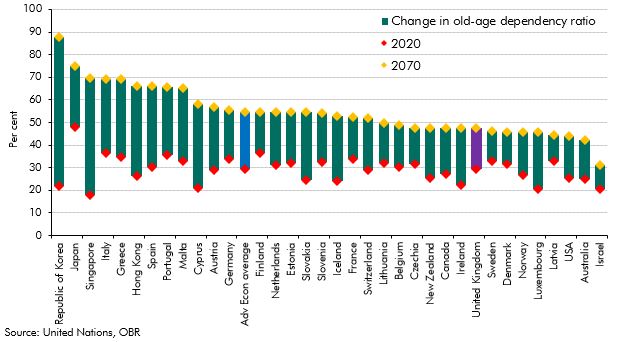
The populations of most advanced economies are ageing, placing new demands on these countries' public finances. This box explored why the UK population is forecast to age slower than most advanced economies over the next fifty years.
The labour market has seen mixed performance following the closure of the coronavirus job retention scheme. Low unemployment surprised to the upside whereas participation remained weaker than expected. In this box, we compared these weak participation outturns with two pre-pandemic counterfactuals, and explored the reasons why fewer people were active than we expected in previous forecasts, including by looking at the trends in different age groups. We also discussed whether we expected these trends to unwind over our forecast.
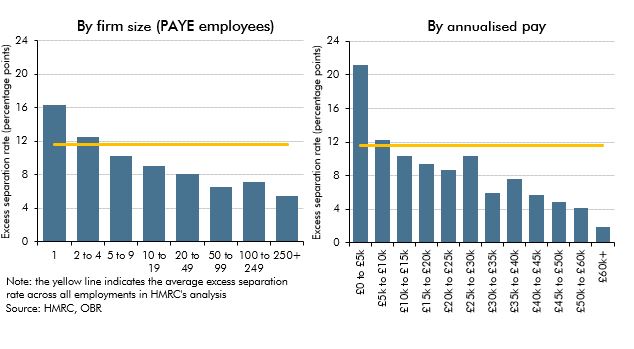
In the final month of the coronavirus job retention scheme (September 2021), over 1 million people were still receiving payments from the scheme. In this box we explore the labour outcomes, up to January 20222, for this population after the closure of the scheme, compared to individuals in employment who were not on furlough in September 2021.
In each Economic and fiscal outlook we publish a box that summarises the effects of the Government’s new policy measures on our economy forecast. These include the overall effect of the package of measures and any specific effects of individual measures that we deem to be sufficiently material to have wider indirect effects on the economy. In our October 2021 Economic and fiscal outlook, we adjusted our economy forecast to take into account plans to loosen fiscal policy from 2022-23, as well as for several specific measures, including the impact of the HSC Levy on earnings.
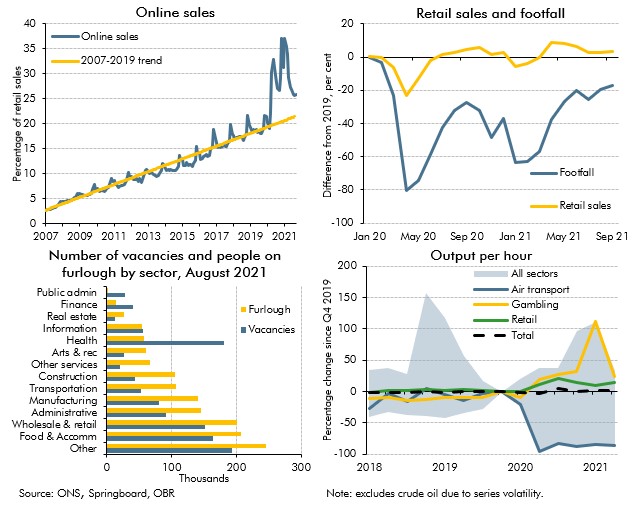
Covid-19 caused dramatic changes in people's behaviour, which affected where, what and how much economic activity took place. In this box we examined the changes which appeared likely to outlast the pandemic, and the progress the economy had made in adjusting to them.
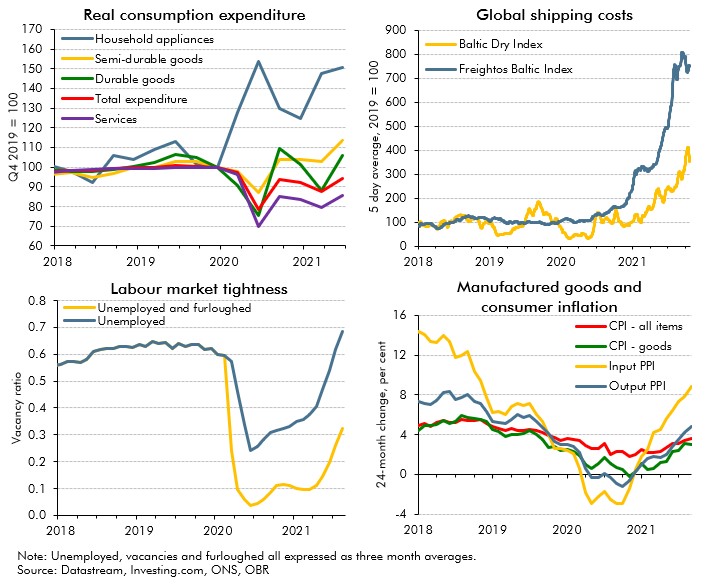
In October 2021 commentators became increasingly concerned that the inability of supply to keep up with demand in specific areas of the economy would hold back the recovery. In this box we examined these 'supply bottlenecks' in energy, product and labour markets, discussing their consequences for wage and price inflation.
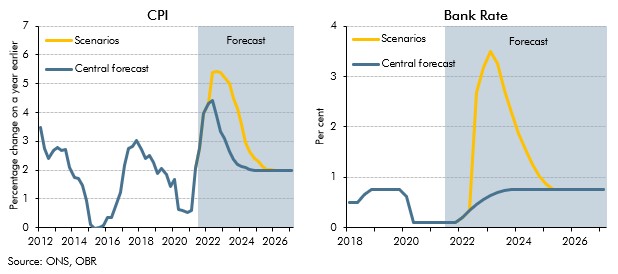
Inflation risks intensified after we closed our pre-measures forecast for the October 2021 Budget. This box showed two stylised scenarios embodying higher and more persistent inflation than in our central forecast to highlight the uncertainty surrounding the outlook. In one scenario inflation was driven mainly by pressures in the product market, and the other mainly pressures in the labour market, which had different implications for wages and consumption.
The Government announced in March 2021 that the coronavirus job retention scheme (CJRS) would be phased out completely by the end of September 2021. In this box, we looked at the latest evidence on the number of people on the scheme and their concentration in certain industries, as well as the latest data on vacancy rates. We also discussed how these data related to our labour market assumptions from March 2021.
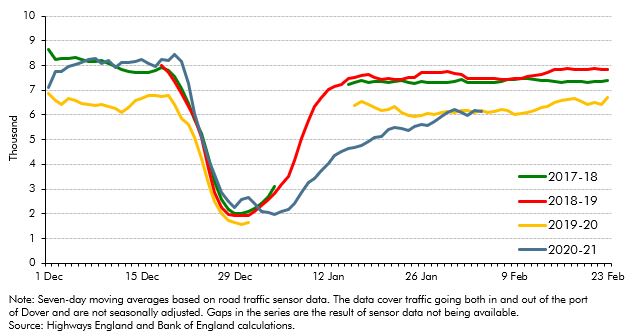
On 24 December, four and a half years after the EU referendum, the UK and the European Union concluded the Trade and Cooperation Agreement (TCA). This box compared the provisions of the TCA against our previous broad-brush assumption that UK-EU trade would take place under the terms of a ‘typical’ free-trade agreement. It also discusses the initial evidence regarding its short-term impact.
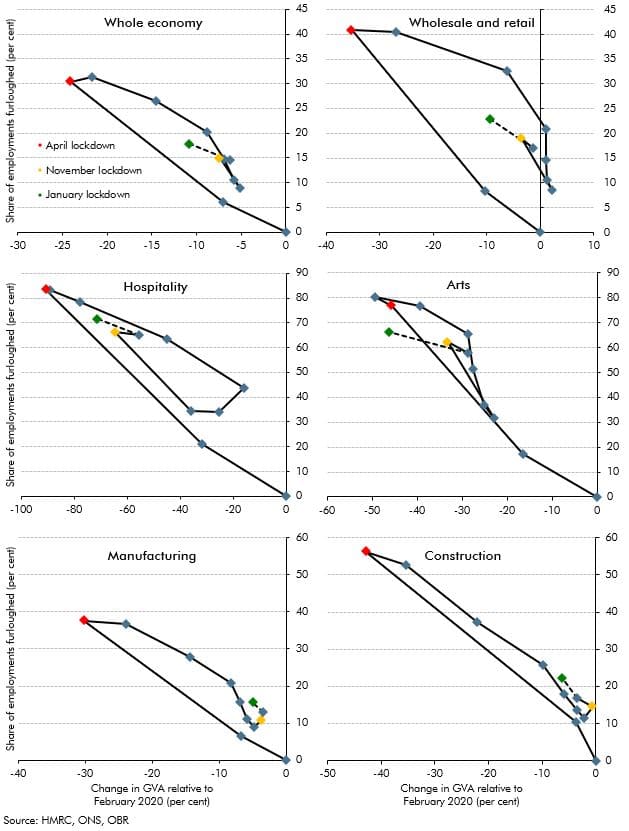
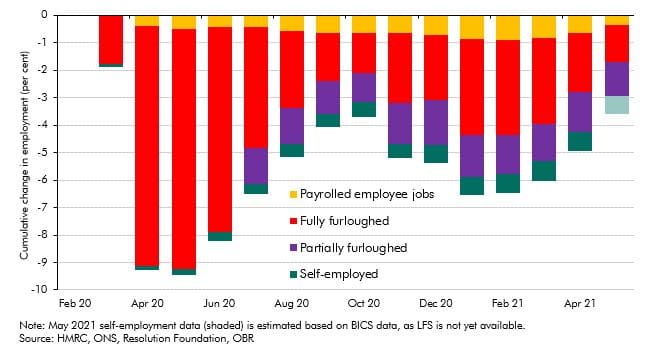
In this box, we discussed how the hospitality, wholesale and retail, arts, manufacturing and construction sectors, as well as the economy as a whole, adapted the usage of the furlough scheme in relation to output, and commented on the increased level of employees on furlough relative to the loss in output in the November 2020 and January 2021 lockdowns when compared with the April 2020 lockdown.
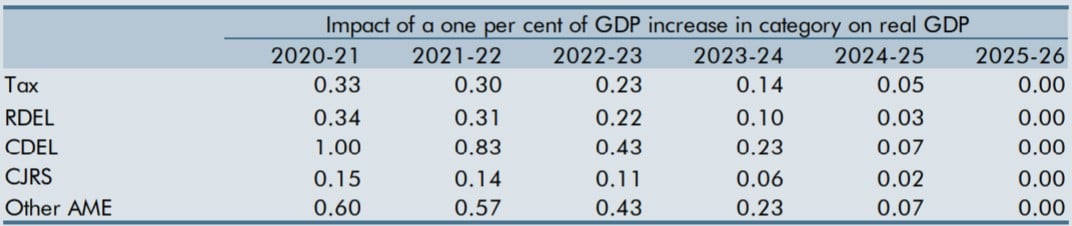
The unusual nature and size of the prevailing economic shock, and the Government’s fiscal response, raised the question of whether our usual fiscal multipliers were appropriate at the time. This box set out competing arguments for the multipliers being larger or smaller than those we usually employ and concluded that we would leave them largely unchanged.
On 31 January 2020, the UK left the EU and the transition period was set to finish at the end of 2020. This box set out our estimate of the effect of the EU referendum result on productivity to date. It also outlined the effect that leaving the EU and trading under the terms of a typical free trade agreement - which we assumed in this forecast - will have on productivity in the long run.
The Government announced plans for a new 'points based' immigration system set to come into place in 2021 that will align migration policy for EU and non-EU migrants. In this box, we considered the impacts of this new system on the outlook for potential output growth.
In March 2020, the Government introduced a new target for the National Living Wage (NLW) to reach two-thirds of median earnings (of the relevant population) by 2024, providing economic conditions allow. In this box we considered the effect of this policy change on the outlook for the economy and the public finances.
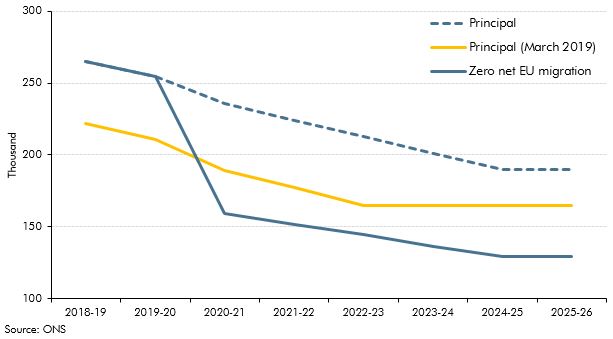
In February 2020, the Government announced its intention to introduce a ‘points-based’ migration system from January 2021 that will align migration policy for EU and non-EU migrants. In this box we looked at the effect of the new migration regime on our borrowing forecast.
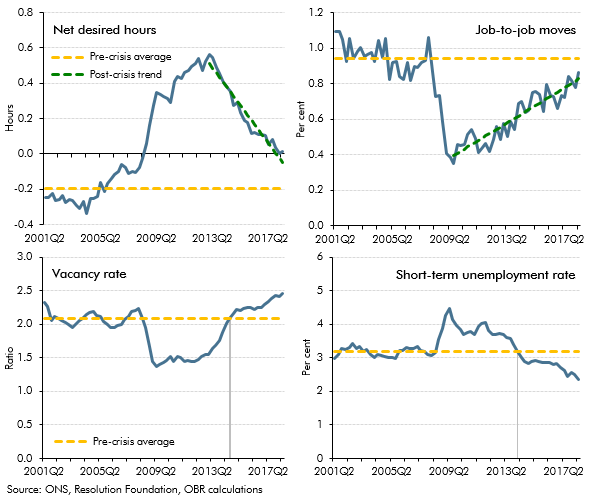
In the 2018 Economic and fiscal outlook we discussed how the unemployment rate – which had fallen to its lowest level since 1975 – may not necessarily give a complete picture of the extent of labour market slack. This box therefore looked at some other measures, some of which suggested there could be more spare capacity than was captured by the unemployment rate at that time and some of which could be used to argue that there was less.
Alongside the October 2018 Economic and fiscal outlook (EFO) the Government expressed its aspiration to end low pay, noting the definition used by the OECD, which corresponds to two-thirds of median earnings. This policy was not firm enough for us to incorporate into our central forecast. Nevertheless, in this box we drew on previous analysis from our July 2015 EFO – when the National Living Wage was first introduced – to illustrate the potential effect on the economy and public finances.
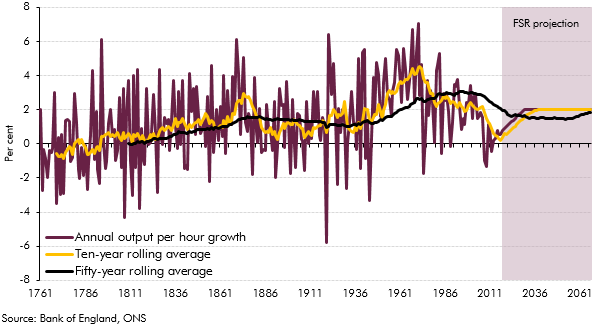
In our November 2017 EFO, we revised down our forecast for trend productivity growth so that it reached 1.2 per cent a year at the end of the medium-term horizon. For the purposes of the long-term projections in our 2018 FSR, we assumed that productivity growth would rise beyond the medium term to reach 2.0 per cent a year from 2030-31 onwards. In this box we provided context for our long-term assumption by exploring the rises and falls in UK productivity growth over the past two-and-a-half centuries.
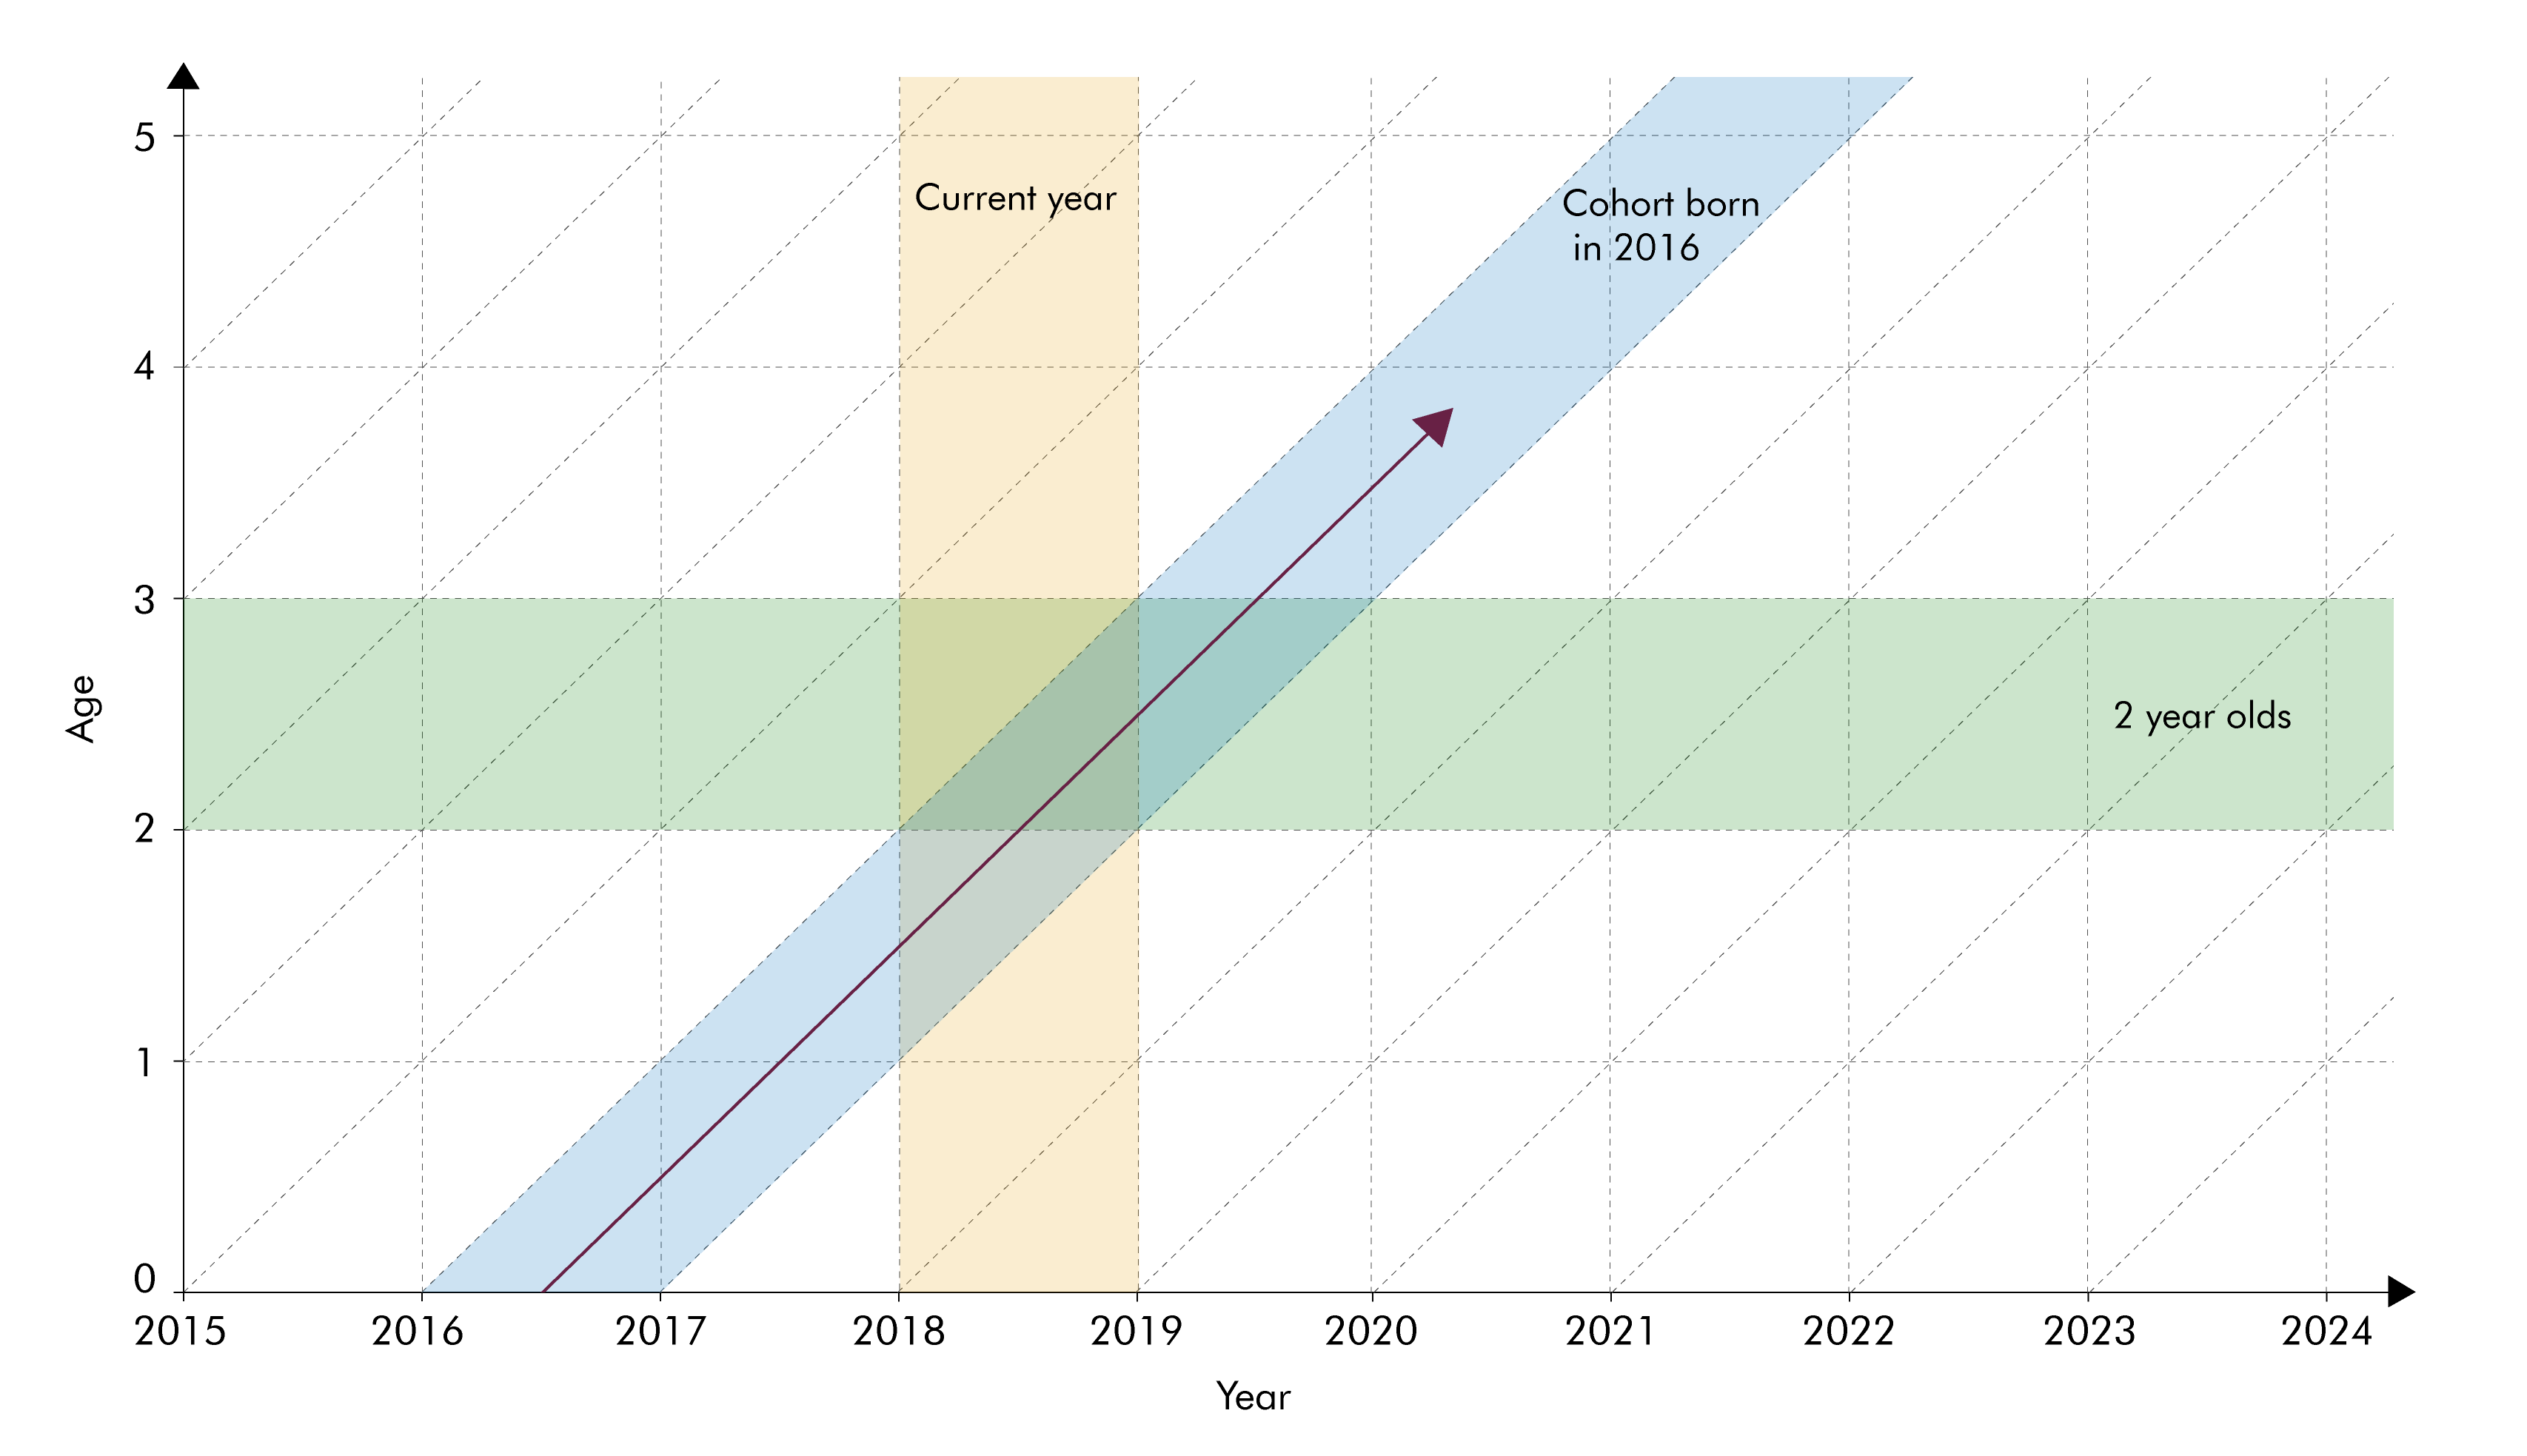
The population projections used to produce our long-term fiscal projections are underpinned by projections for age-specific fertility and mortality rates. In this box we considered two different ways of summarising trends in these rates - period and cohort metrics - and discussed their relative advantages.
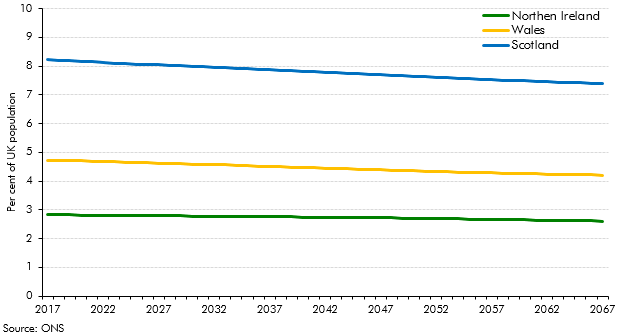
This box looked at differences in the Office for National Statistics’ population projections for the four constituent nations of the UK. It discussed the nations’ relative size and ageing, and possible implications for fiscal sustainability.
In the November 2016 EFO we made a number of judgements about how the vote to leave the EU would effect the economy in the near-term. This box from our March 2018 EFO compared these judgements against the outturn data that we had received since then, finding that most of these judgements were broadly on track.
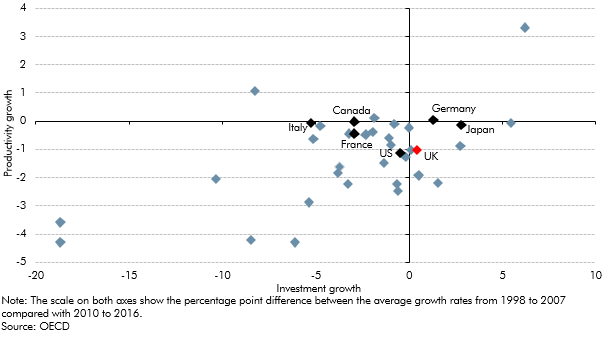
The outlook for productivity growth is one of the most important and yet uncertain areas of our economy forecast. In this box from our March 2018 EFO we looked at how actual productivity growth can be broken down into contributions from capital deepening and total factor productivity (TFP) growth and how differences in investment across countries could be related to post-crisis productivity performance.
Our first post-EU referendum forecast in November 2016 assumed that leaving the EU would result in a less open economy and lower productivity, but we did not incorporate an explicit link between the two over our medium-term forecast horizon. This box from our March 2018 EFO discusses why we did not include this link and what other forecasters have assumed.
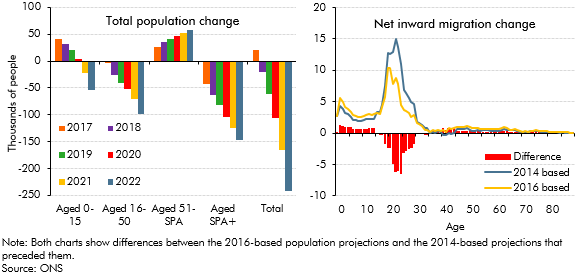
The Office for National Statistics (ONS) published new UK population projections in October 2017, based on 2016 population estimates and updated assumptions for fertility, mortality and net migration. This box compared the latest projections with the previous 2014-based principal projections that underpinned our March 2017 forecast and summarised their effects on our November 2017 fiscal forecast.
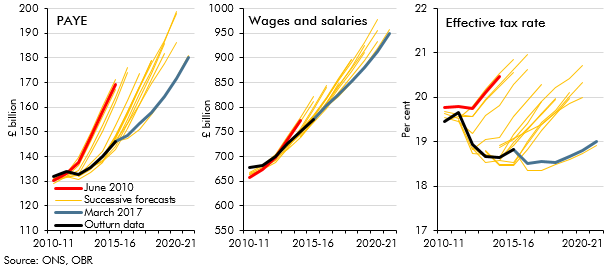
PAYE income tax is the Government’s single most important source of revenue, and one where our forecasts since 2010 have tended to be revised down over time. In this box from our March 2017 Economic and fiscal outlook, we explored the role that changes in the distribution of earnings might have played in explaining the shortfalls in income tax receipts.
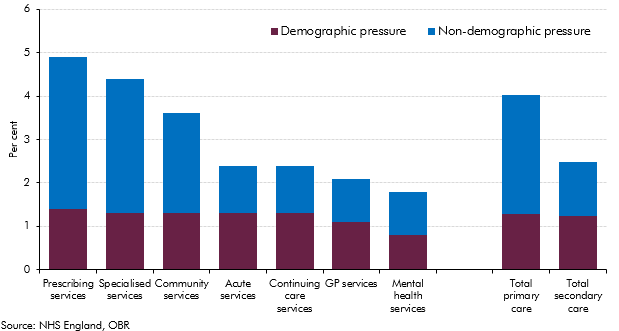
Over the past four decades, health spending in the UK rose faster than GDP (on average in real terms) and it increased steadily in real per capita terms. Demographic change alone could have not explained these rising trends, with other factors expected to provide further upward pressures on health spending. This box summarised the key findings of our WP No. 9 that reviewed the latest evidence on demographic and non-demographic determinants of health spending in the UK and its implications for our long-term health spending projections.
In our November 2016 forecast, our first following the June 2016 referendum, we revised down our potential growth forecast, primarily reflecting the effect of weaker business investment on productivity growth. To give some context to our central forecast judgements, this box outlined a number of channels through which the decision to leave the EU could affect potential output and the uncertainty associated with estimating these effects.
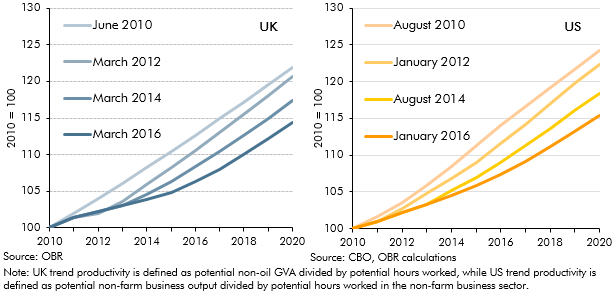
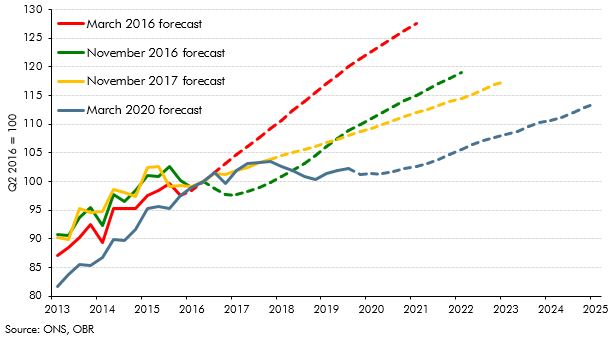
The path of productivity growth is a key driver of GDP growth in our forecast and is also one of the most uncertain judgements. In March 2016, given persistent weakness in outturn data, we revised down our forecast for productivity growth. But this issue was not specific to the UK, with productivity having disappointed in many other major advanced economies. This box compared different vintages of UK and US productivity and potential output forecasts since 2010 to illustrate this point.
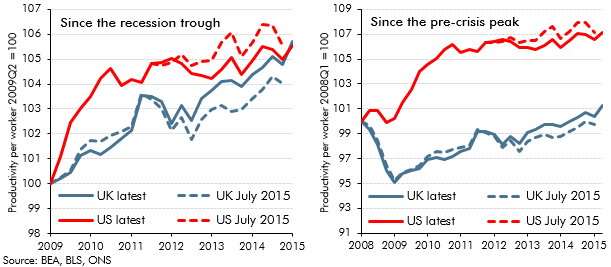
Recent estimates of UK GDP growth represent an early draft of economic history that will be revised, often substantially, over time. OECD found that initial estimates of UK GDP growth have tended to be revised up over time. This box also highlights revisions to estimates of US and UK productivity growth between July and November 2015, and the substantial productivity shortfall relative to the US and relative to the pre-crisis trend in the UK.
In each Economic and fiscal outlook we publish a box that summarises the effects of the Government’s new policy measures on our economy forecast. These include the overall effect of the package of measures and any specific effects of individual measures that we deem to be sufficiently material to have wider indirect effects on the economy. In the 2015 Autumn Statement and Spending Review, we made a number of adjustments to real and nominal GDP, the labour market, inflation, and the housing market.
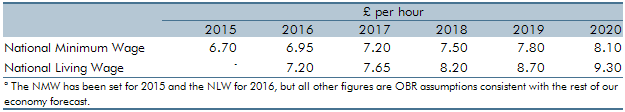
In July 2015, the Government announced the ‘National Living Wage’ (NLW) for workers aged 25 and above. This box from our November 2015 Economic and fiscal outlook outlined how revisions to the wider economy forecast affected our NLW forecast and also explored some of the potential labour market and employer responses to the NLW.
As part of our economic forecast, we produce forecasts for total employment and GDP per capita based on ONS population projections. Relative to our June 2010 forecast, employment in 2015 was 1 million higher than expected and GDP per capita over the period increased by 4.5 per cent lower. This box from our July 2015 Economic and fiscal outlook examined the reasons for these forecast errors.
In each Economic and fiscal outlook we publish a box that summarises the effects of the Government’s new policy measures on our economy forecast. These include the overall effect of the package of measures and any specific effects of individual measures that we deem to be sufficiently material to have wider indirect effects on the economy. In the July 2015 Economic and fiscal outlook, we made a number of adjustments to real and nominal GDP, the labour market, inflation, business and residential investment, and the housing market.
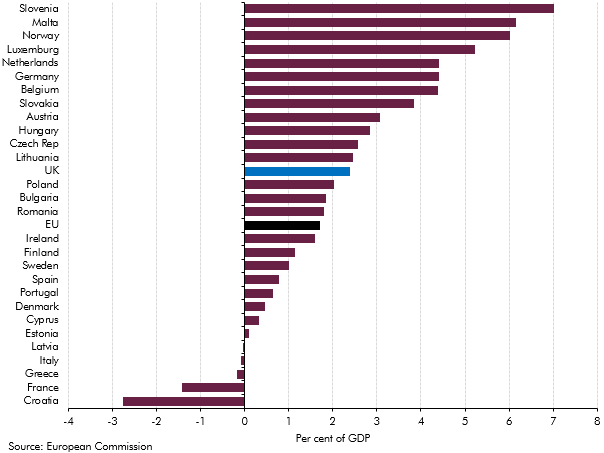
Our 2015 long-term fiscal projections suggested that, if left unaddressed, the public sector finances would have come under increasing pressure over the next 50 years due to rising age-related expenditure. This box compared our long-term age related spending projections with projections from the Ageing Working Group (2015) for the EU countries between 2020 and 2060.
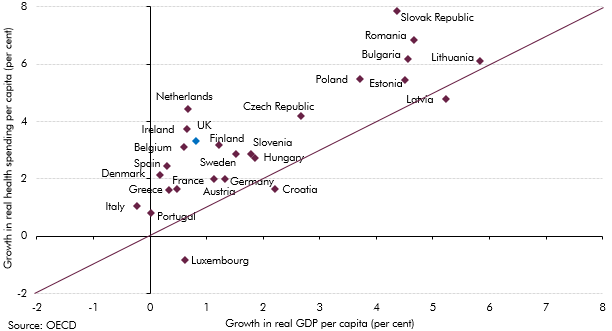
Health spending rose faster than GDP in almost all European countries over the past decade. This box investigated most notable long-term drivers of real spending on health care: demographic effects, income effects and other cost pressures.
Between 2012 and 2014, growth in the UK picked up, outpacing all other members of the G7. This box provided wider context for this strength in UK growth, comparing GDP, employment and productivity growth across G7 countries since 2008.
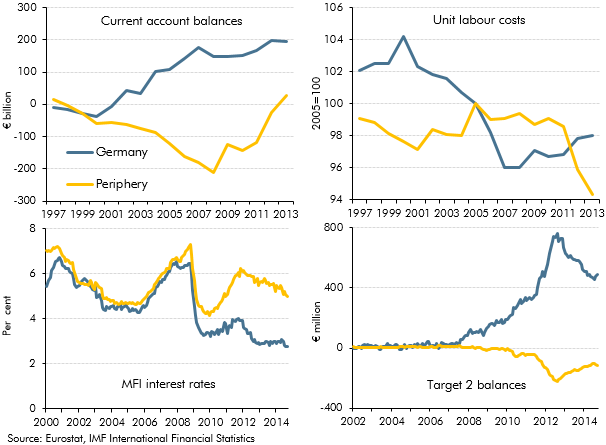
In the December 2014 Economic and fiscal outlook, we identified the adjustment in the euro area as a risk to our forecast. This box highlighted some of the key indicators that commentators were using to measure the progress of that rebalancing.
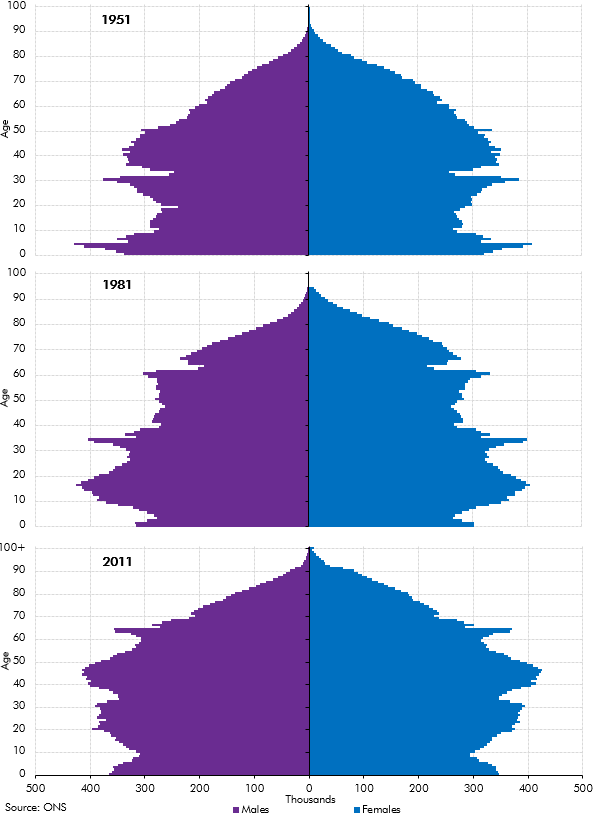
In our 2014 Welfare trends report, Chapter 3 reviewed the drivers of welfare spending. In this box we showed how the age structure of the population in England and Wales had evolved between the census years of 1951, 1981 and 2011. The post-war and 1960s baby-boom generations affect the dependency ratio in different ways over time, as these larger cohorts move from childhood to working adulthood and into retirement.
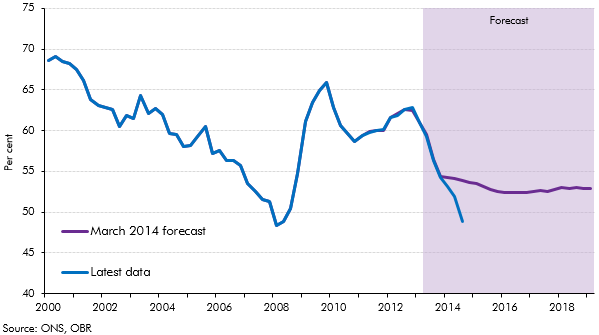
In our 2014 Welfare trends report, Chapter 8 considered spending on unemployed people. This box compared outturn data on unemployment and claimants of unemployment benefits to the levels implied by our March 2014 forecast. As the economy performed better than anticipated in our March 2014 forecast, the ratio of claimants of unemployed benefits to the Labour Force Survey (LFS) measure of unemployment deviated from our projections. This was largely due to a drop in the rate of inflows into unemployment benefits and a rise in the rate of outflows from unemployment benefits, though an increase in the number of people looking for jobs but not claiming unemployment benefits may have increased LFS unemployment and so been a contributing factor.
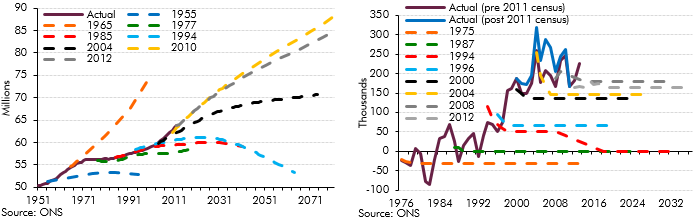
Population projections are subject to significant uncertainty, particularly over very long time horizons. This box outlined the error in successive population projections and the sources of error.
In Annex A of our 2013 Fiscal sustainability report, we reviewed the assumptions that we make about the fiscal effects of net migration. In this box from our 2014 Fiscal sustainability report we summarised the migration-related issues that we consider explicitly in our long-term projections, those that are implicit in the material we use to produce them, and, importantly, those issues we do not consider – either because of our modelling techniques or because they fall outside the remit that Parliament has set the OBR.
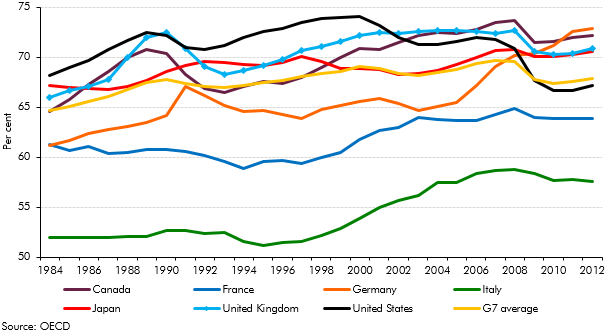
Earlier in the year, the Chancellor expressed an ambition “to have more people working than any of the other countries in the G7 group". This box compared countries employment rates and demonstrated the scope for labour market outcomes to differ substantially.
In the February 2014 Inflation Report the Bank of England published more information about its assessment of spare capacity. This box compared that assessment with our own output gap estimate at the time, highlighting some conceptual differences between the two.
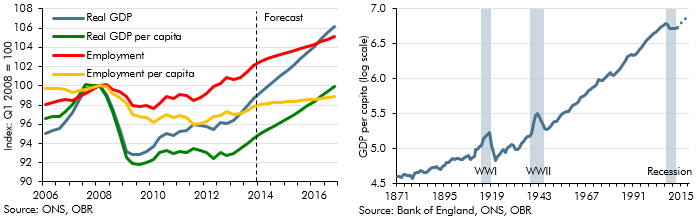
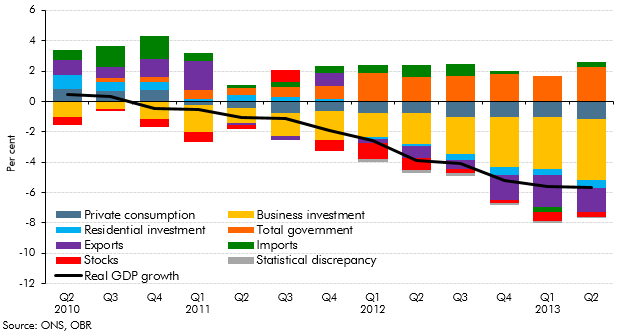
This box showed how growth in some of the key economy variables between 2010 and 2013 was lower when measured on a per capita basis. We also discussed our forecast for productivity growth at that time, given its importance in determining GDP per capita growth in the medium term.
In each Economic and fiscal outlook we publish a box that summarises the effects of the Government’s new policy measures on our economy forecast. These include the overall effect of the package of measures and any specific effects of individual measures that we deem to be sufficiently material to have wider indirect effects on the economy. In our March 2014 Economic and Fiscal Outlook, we made adjustments to inflation and business investment.
Each autumn, we publish our Forecast evaluation report (FER), a detailed examination of the performance of past economic and fiscal forecasts relative to the latest outturn data. This box discussed cumulative errors in our June 2010 real and nominal GDP forecasts in light of the significant revisions made by the ONS to real GDP growth between mid-2010 and mid-2012, and the implications this has had for the performance of our June 2010 public sector borrowing forecast
On 7 August 2013, the Bank of England announced that it would not consider raising Bank Rate, then at 0.5 per cent, until the unemployment rate had fallen to 7.0 per cent. However, the Bank also detailed certain conditions, which if breached, would make it consider tightening monetary policy sooner. This box, from our December 2013 Economic and fiscal outlook, examined where our forecast stood in relation to these conditions.
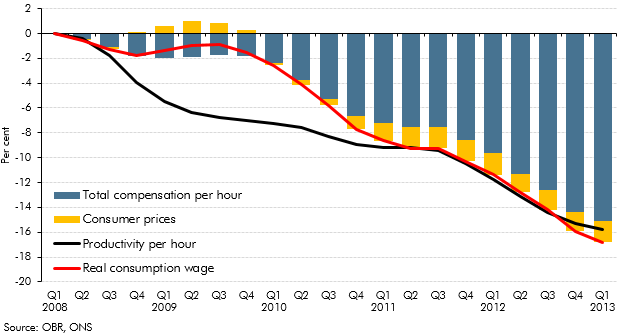
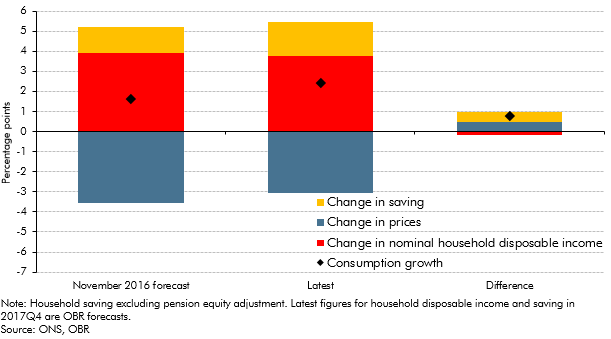
In the years following the late-2000s recession, productivity growth remained subdued, which would be expected to lead to lower wages. This box showed that while the real product wage grew more strongly than productivity growth since 2008, real consumption wage growth was weaker.
The ONS updates its population projections every two years based on mid‑year population estimates but every ten years it can draw on the latest census results. Census 2011 suggested that there were around half a million more people in the UK in 2011 than assumed in the population projections at the time, among other compositional changes. This box outlined some of the key findings from the census data and the impact this might have on our future projections.
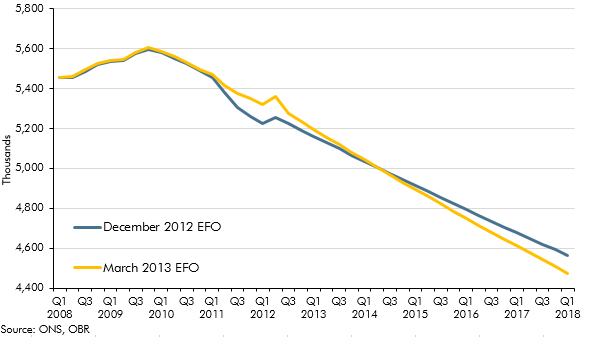
Our general government employment (GGE) forecast is based on projections of the growth of the total government paybill and paybill per head, which is in turn based on the Government's latest spending plans. In this box we compared our GGE forecast against the outturn data since the start of the 2010 Spending Review period. This allowed some assessment of how public sector employers were progressing with their intended workforce reduction and how much adjustment would still be required.
In October 2011, we published our first Forecast evaluation report (FER). This box summarised the key findings, including a discussion of weaker than expected GDP growth and why, despite this, public sector borrowing has fallen broadly as we expected it would.
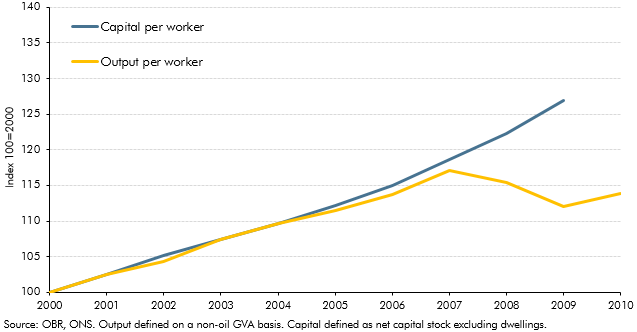
Productivity growth since the late-2000s recession has been relatively weak. This box set out some proposed explanations for that weakness, including measurement issues, lower investment, compositional effects, labour market factors and impaired financial markets. Most commentators believed that some combination of these factors was likely to be responsible. The relative importance of these factors also has implications for the extent to which the shortfall was believed to be demand or supply-related.
Our general government employment (GGE) forecast is based on projections of the growth of the total government paybill and paybill per head, which is in turn based on the Government's latest spending plans. In this box we compared our GGE forecast against the outturn data since the start of the 2010 Spending Review period. This allowed some assessment of how public sector employers were progressing with their intended workforce reduction and how much adjustment would still be required.
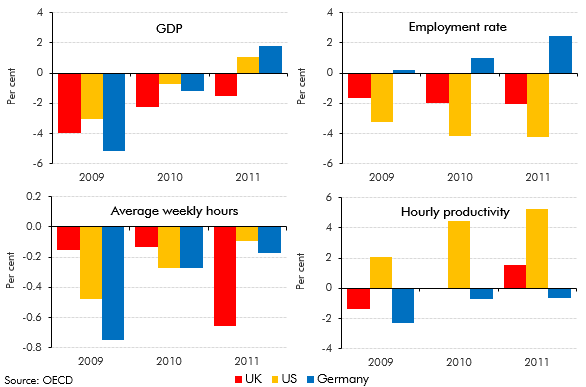
The UK, the US and Germany all saw broadly similar falls in GDP over 2009, but their labour markets responded differently. This box discussed these differences and compared the behaviour of employment, hours and productivity over this period.
In each Economic and fiscal outlook we publish a box that summarises the effects of the Government’s new policy measures on our economy forecast. These include the overall effect of the package of measures and any specific effects of individual measures that we deem to be sufficiently material to have wider indirect effects on the economy. In our March 2012 Economic and Fiscal Outlook, we made adjustments to our forecasts of real GDP, business investment and inflation.
Our general government employment (GGE) forecast is based on projections of the growth of the total government paybill and paybill per head, which is in turn based on the Government's latest spending plans. In this box we compared our GGE forecast against the outturn data since the start of the 2010 Spending Review period. This allowed some assessment of how public sector employers were progressing with their intended workforce reduction and how much adjustment would still be required.
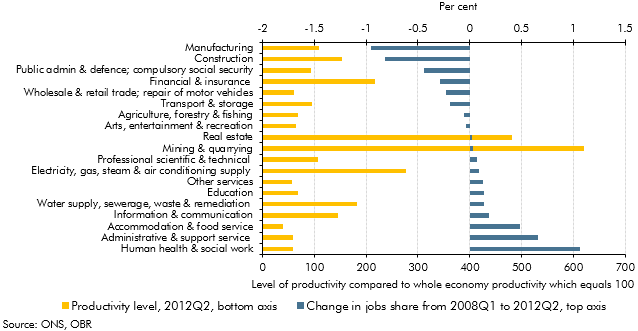
Potential output growth had been relatively weak in the period following the late-2000s recession. This box discussed some possible reasons, noting that indicators available at the time did not indicate a structural deterioration in the labour market.
In each Economic and fiscal outlook we publish a box that summarises the effects of the Government’s new policy measures on our economy forecast. These include the overall effect of the package of measures and any specific effects of individual measures that we deem to be sufficiently material to have wider indirect effects on the economy. In our November 2011 Economic and Fiscal Outlook, we made adjustments to our forecasts of inflation and property transactions.
Our general government employment (GGE) forecast is based on projections of the growth of the total government paybill and paybill per head, which is in turn based on the Government's latest spending plans. In this box we compared our GGE forecast against the outturn data since the start of the 2010 Spending Review period. This allowed some assessment of how public sector employers were progressing with their intended workforce reduction and how much adjustment would still be required.
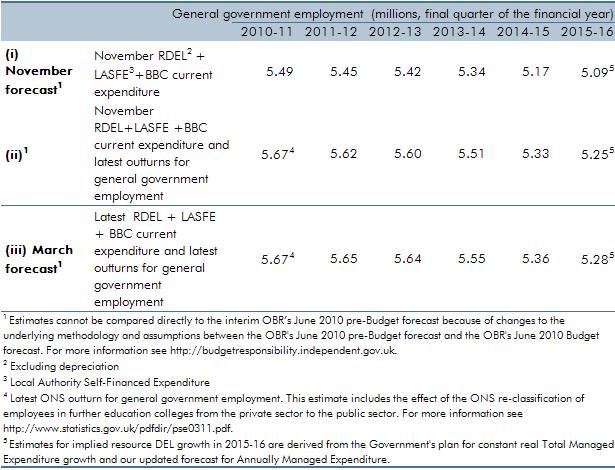
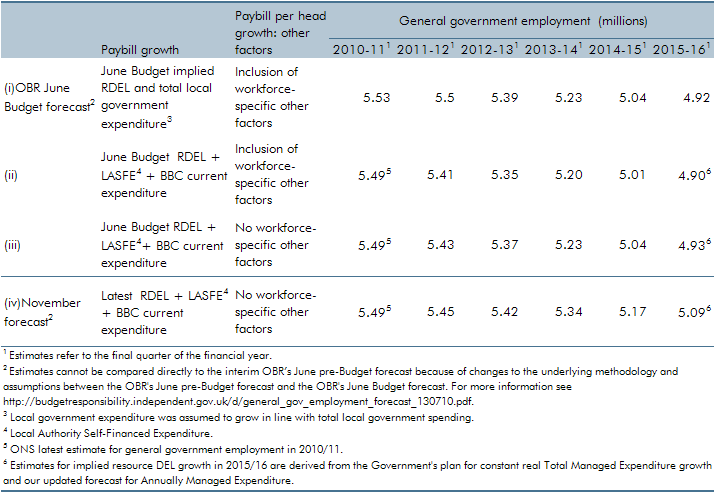
Our general government employment (GGE) forecast is based on projections of the growth of the total government paybill and paybill per head, which is in turn based on the Government's latest spending plans. Ahead of our March 2011 forecast, ONS estimates of general government employment were revised up, largely reflecting the reclassification of employees in further education colleges. In this box we set out the extent to which changes to our general government employment forecast were a result of our revised projections for paybill growth as opposed to data revisions.
In our central forecast, interest rates are assumed to evolve in line with financial market expectations. For alternative economic scenarios which involve different paths for the output gap and inflation, it is useful to specify rules for the way monetary policy is set and for how output and employment will respond. In this box, we set out the rules that governed those relationships in the scenarios we analysed in the March 2011 Economic and fiscal outlook: a persistent inflation scenario and a weak euro scenario.
Following the June 2010 Budget, the Government set out further details of the planned reductions in government expenditure in its 2010 Spending Review, including additional measures to reduce welfare spending. This box discussed the possible ways in which these measures could affect the economy's trend growth rate.
Net migration is an important source of growth in the working-age population. It therefore influences the economy’s trend growth rate by affecting potential labour supply growth. In this box in our first full Economic and fiscal outlook in November 2010, we considered how changes in migrant employment and productivity could affect whole economy employment and productivity.
Data available at the time of our November 2010 Economic and fiscal outlook suggested that general government employment fell by 550,000 between 1992 and 1998. But some of this fall reflected the reclassification of further education colleges and sixth-form school employees from the public to the private sector in 1993. This box outlined a simple methodology which suggested that general government employment would have fallen by just over 400,000 over that period in the absence of this reclassification.
Our general government employment (GGE) forecast is based on projections of the growth of the total government paybill and paybill per head, which is in turn based on the Government's latest spending plans. Ahead of our November 2010 forecast, those plans were updated as part of the 2010 Spending Review. We also made a number of refinements to our forecasting approach. In this box we described revisions to our general government employment forecast and explain the extent to which these changes were the result of methodological changes as opposed to revised spending plans.