
Box sets » Welfare trends report - October 2014
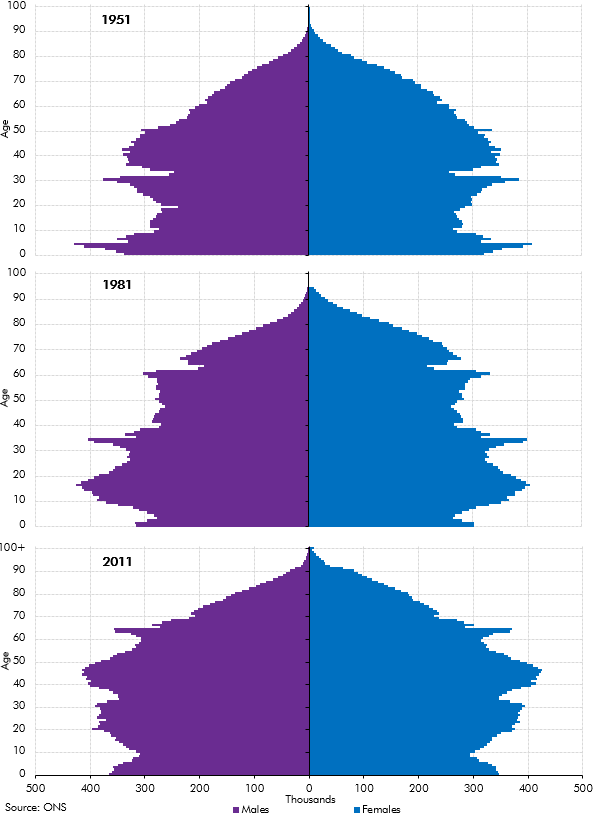
In our 2014 Welfare trends report, Chapter 3 reviewed the drivers of welfare spending. In this box we showed how the age structure of the population in England and Wales had evolved between the census years of 1951, 1981 and 2011. The post-war and 1960s baby-boom generations affect the dependency ratio in different ways over time, as these larger cohorts move from childhood to working adulthood and into retirement.
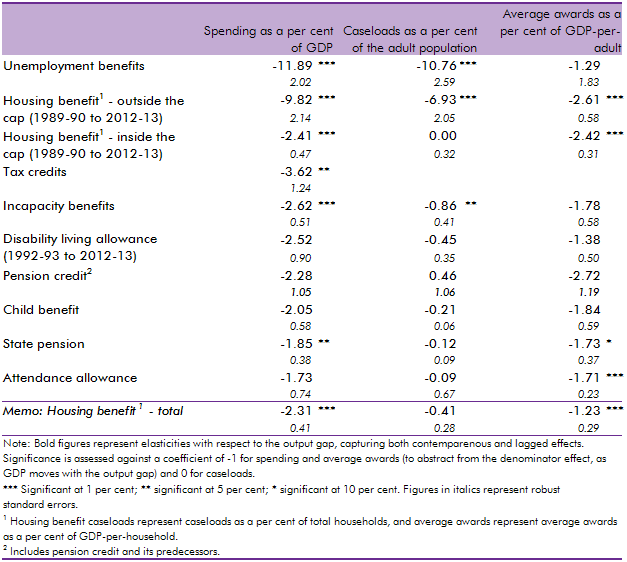
In our 2014 Welfare trends report, Chapter 4 reviewed the overall trends in welfare spending. In this box, we considered how responsive welfare spending is to the economic cycle by estimating the elasticity of benefits and tax credits spending as a share of GDP with respect to changes in the output gap (the difference between actual GDP and an estimate of its potential or underlying level). We found that the most counter-cyclical benefits have caseloads closely associated with the economic cycle whereas mildly counter-cyclical benefits are likely to only exhibit cyclicality due to spending varying less than GDP, thereby producing a denominator effect.
In our 2014 Welfare trends report, Chapter 4 reviewed the overall trends in welfare spending. In this box we discussed the latest Universal Credit (UC) forecast at the time of writing. This forecast assumed UC would roll-out slowly during 2014-15 and 2015-16 before accelerating in 2016-17 and 2017-18, by which time 5.8 million people were expected to be receiving the benefit. We highlighted that the roll out of UC had already been subject to previous delays and that the decision to produce a top-down UC forecast helped mitigate the uncertainties caused by delivery challenges. We then decomposed the marginal UC forecast into its constituent gross savings and gross costs forecasts.
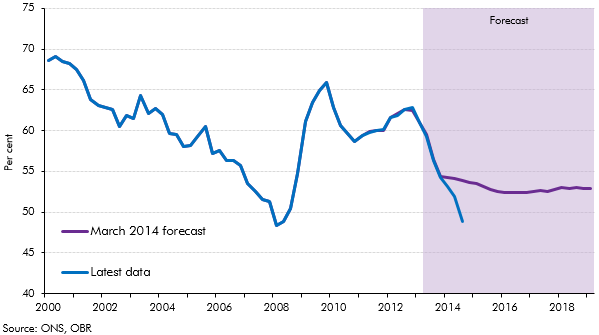
In our 2014 Welfare trends report, Chapter 8 considered spending on unemployed people. This box compared outturn data on unemployment and claimants of unemployment benefits to the levels implied by our March 2014 forecast. As the economy performed better than anticipated in our March 2014 forecast, the ratio of claimants of unemployed benefits to the Labour Force Survey (LFS) measure of unemployment deviated from our projections. This was largely due to a drop in the rate of inflows into unemployment benefits and a rise in the rate of outflows from unemployment benefits, though an increase in the number of people looking for jobs but not claiming unemployment benefits may have increased LFS unemployment and so been a contributing factor.