In our 2014 Welfare trends report, Chapter 3 reviewed the drivers of welfare spending. In this box we showed how the age structure of the population in England and Wales had evolved between the census years of 1951, 1981 and 2011. The post-war and 1960s baby-boom generations affect the dependency ratio in different ways over time, as these larger cohorts move from childhood to working adulthood and into retirement.
This box is based on ONS population data from March 2011 .
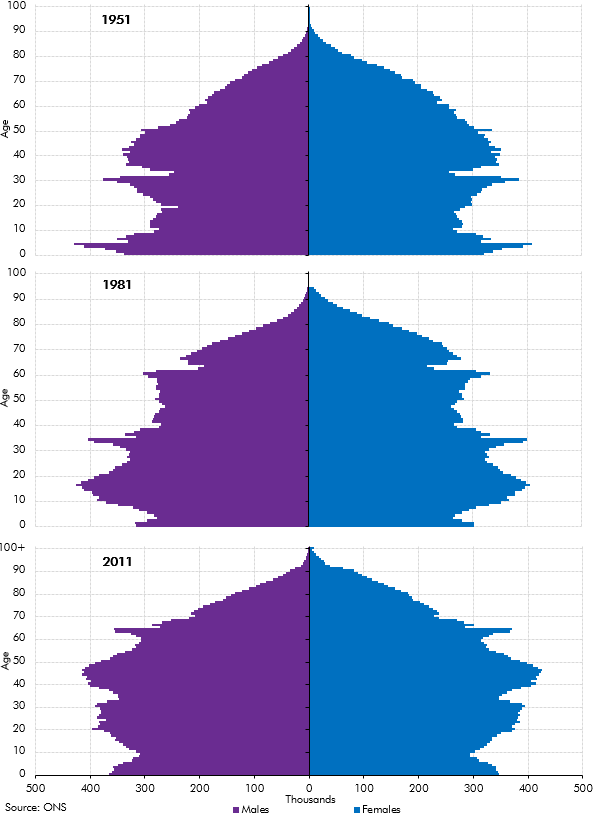
Chart A shows ‘age pyramids’ of the population structure in England and Wales over the sixty years from 1951 to 2011. (Detailed UK-wide data are only available from 1971.)
The 1951 census was the first after World War II. The total population in England and Wales was 43.8 million, of which 52.0 per cent were women. This reflected the greater longevity of women (visible at the top right of the 1951 pyramid), but also the direct effect of wars on several male cohorts. The pyramids are indented at certain cohorts due to lower fertility during the 1930s depression (individuals aged 12 to 20 in 1951) and the influenza pandemic of the late 1910s (the 32 to 33 year old cohort). The beginning of the post-war baby boom – when total fertility rates increased from 2.0 children per woman in 1946 to 2.6 in 1948 – is also visible, particularly for children aged 3 to 4 years by 1951. The old-age dependency ratio – the population over 65 relative to the working-age population – was 16.5 per cent in 1951.
By 1981, the total population in England and Wales had reached 48.5 million. The gender composition was more balanced than in 1951, with women making up 51.3 per cent of the total. Life expectancy at birth had risen from 66 to 71 years for men and from 71 to 77 years for women, reflecting both lower rates of infant mortality and more people living past the age of 65. The first wave of baby boomers had now reached their early 30s, in the middle of their working lives. By this stage, the second baby-boom was also evident in the number of individuals aged 16 to 26, i.e. people born between 1955 and 1965. Towards the end of the 1960s, birth rates fell, which is reflected in fewer people aged 3 to 15. The old-age dependency ratio in 1981 was 23.2 per cent, an increase of 6.7 percentage points compared to 1951.
In the most recent 2011 census, the population in England and Wales had reached 56.1 million, up 7.6 million since 1981 and 12.3 million since 1951. Women represented 50.8 per cent of the population. The pyramid shows a bulge in the number of people above 60 years old – the post-war baby boom cohorts were 60 to 64 years old – and a lower proportion of people under 20 years old. The number of younger children has started to increase again, which is likely to reflect higher fertility rates of both UK-born women and immigrants arriving after the expansion of the European Union in 2004. The total fertility rate in the 2011 census was 1.93 for all women, up from the post-1930s low of 1.60 in 2001. Life expectancy at birth had risen to 79 years for men and 83 for women. The old-age dependency ratio had increased further to 25.0 per cent by 2011.
The 1960s baby-boom generation were by this stage 46 to 55 years old so – for the most part – they were still working. As they reach retirement, the shape of the population pyramid will continue to evolve and the old age dependency ratio will continue rising.
The trends depicted in these pyramids help us to understand trends in welfare spending and age-related spending more generally. For example, the post-war baby-boom generation will have affected spending on family allowance – the predecessor of child benefit – in the 1950s; working-age benefits from the 1960s to 2000s; and pensions and other benefits for the elderly from the 2010s. More generally, as we have shown in our Fiscal sustainability reports (FSR), an ageing population raises the share of GDP spent on health, long-term care and pensions. As Chapter 6 discusses, spending on benefits for the sick and disabled are also likely to be affected.
Chart A: Population pyramids for England and Wales: 1951, 1981 and 2011