Our annual Forecast evaluation report (FER) examines how our forecasts compare to subsequent outturn data and identifies lessons for future forecasts.
This report focuses on our March 2023 forecast and latest outturn data for 2023-24.

"It is the duty of the Office to examine and report on the sustainability of the public finances"
Our annual Forecast evaluation report (FER) examines how our forecasts compare to subsequent outturn data and identifies lessons for future forecasts.
This report focuses on our March 2023 forecast and latest outturn data for 2023-24.
The Office for Budget Responsibility was created in 2010 to provide independent and authoritative analysis of the UK public finances. Twice a year – usually at the time of each Budget and Autumn or Spring Statement – we publish a set of forecasts for the economy and public finances over the coming five years in our Economic and fiscal outlook (EFO). We use these forecasts to assess the Government’s progress against its fiscal targets.
In each EFO, we stress the uncertainty that lies around all such forecasts. We compare our central forecasts to those of other forecasters. We highlight the limited confidence that should be placed in our central forecast given the scale of shocks that inevitably drive a wedge between any central predictions and subsequent outcomes. We use sensitivity and scenario analysis to show how the public finances could be affected by alternative economic outcomes. And we highlight the residual uncertainties in the public finances, even if one were confident about the path for the economy – for example, because of uncertain estimates of the cost of policy measures.
Notwithstanding these uncertainties, we believe that it is important to set out our forecast in detail. It is also important to examine regularly how our forecasts compare to outturn data and to explain any discrepancies so that we can learn from our experience.
Our annual Forecast evaluation report (FER) enables us to reflect on the reasons for divergence between our central forecast and the subsequent outturns. To a significant extent these differences between outturns and previous forecasts are inevitable given the inherent difficulty in forecasting the path of the economy and public finances, which has been amplified recently by a series of unforecastable shocks. But some differences are due to genuine errors, which would have been corrected before the forecast was finalised if we had spotted them. We use these reports to identify, understand, and learn from these errors and more generally improve the way in which we forecast.
This year our report analyses the performance of our March 2023 economic and fiscal forecasts for the 2023-24 financial year. This report was initially scheduled for publication on 18 July. The announcement on 22 May of a General Election on 4 July meant we postponed its release to 10 October. However, most of the preparation of this report had been undertaken on the initial publication schedule.
Therefore, economy outturn data is taken from the 28 June 2024 Quarterly National Accounts publication. We have not taken on the subsequent Blue Book revisions, which were released as aggregates on 7 August 2024 but not fully incorporated into Quarterly National Accounts until 30 September 2024.
For public sector expenditure, the outturn data used is from the ONS’s June Public Sector Finances publication. This uses the ONS’s ‘Public Sector Analytical Tables’ (‘PSAT’) economic categories of expenditure, rather than the full ‘total managed expenditure’ (‘TME’) breakdown that we focus on in our forecast and would normally analyse in FERs. This means we have had to classify the major spending forecast differences into economic and other factors, plus the impact of policy, in a more approximate manner than we would normally be able to, but we are confident the broad results are nevertheless robust.
For public sector receipts, we were able to update our analysis to use the outturn from the ONS’s July 2024 Public Sector Finances publication, which reflected adjustments from HMRC’s Trust Statement alignment exercise. When classifying the receipts forecast differences arising from economic factors, we used economic data from the ONS’s March 2024 Quarterly National Accounts.
In line with our Memorandum of Understanding, we provided a final copy of this report to the Treasury two working days in advance of publication.
We would be pleased to receive feedback on any aspect of the content or presentation of our analysis. This can be sent to [email protected].
The Budget Responsibility Committee
Richard Hughes, Professor David Miles CBE and Tom Josephs
1.1 The focus of this year’s Forecast evaluation report (FER) is the performance of our March 2023 Economic and fiscal outlook (EFO) forecast for the financial year 2023-24. The economy outturn data uses the ONS’s Quarterly National Accounts released on 28 June 2024. We have not taken on the Blue Book revisions partially released on 7 August 2024 and included in the 30 September 2024 Quarterly National Accounts, which arrived too late for consideration. The fiscal outturn data used is the ONS’s July 2024 Public Sector Finances publication for receipts, which include changes to tax revenues from HMRC’s Trust Statement alignment exercise, and the ONS’s June 2024 publication for spending.
1.2 During 2023-24, inflation fell rapidly as energy prices dropped, while GDP growth stagnated following its recovery from the pandemic. The labour force grew as net migration reached record levels, more than offsetting further falls in the overall participation rate. Total tax receipts remained at historically high levels as a share of GDP, with income tax and NICs receipts in particular remaining elevated due to high nominal earnings combined with frozen personal tax thresholds. Public spending fell as a share of GDP, as higher inflation eroded its real value despite modest additions to departmental spending to fund pay settlements, and higher spending on debt interest.
1.3 In this FER, in addition to examining the performance of our central forecast, we also explore how we presented the uncertainty around that forecast. While significantly different from our central forecast, outturns for energy prices, and interest rates were close to the alternative scenarios we explored for these key forecast determinants in the March 2023 EFO. In a volatile period for market expectations, outturns for gas prices proved to be closer to our downside scenario, while interest rates were closer to our upside. And the asymmetric impact of unexpectedly high inflation on the public finances, pushing up receipts more than spending, was consistent with the inflation scenarios included in successive EFOs.
1.4 CPI inflation averaged 5.7 per cent in 2023-24 compared to our forecast of 4.1 per cent. But falling inflation during the year and in subsequent outturns was broadly consistent with our judgement that the spike in inflation would prove to be transitory. And, by the second quarter of 2024, inflation was close to the 2 per cent target. Inflation in 2023-24 was 1½ percentage points higher than our forecast despite lower-than-forecast wholesale energy prices. That is because these were more than offset by a more substantial pass-through of the previous rise in energy prices, and higher domestically generated inflation from a tighter labour market and stronger nominal wage growth.
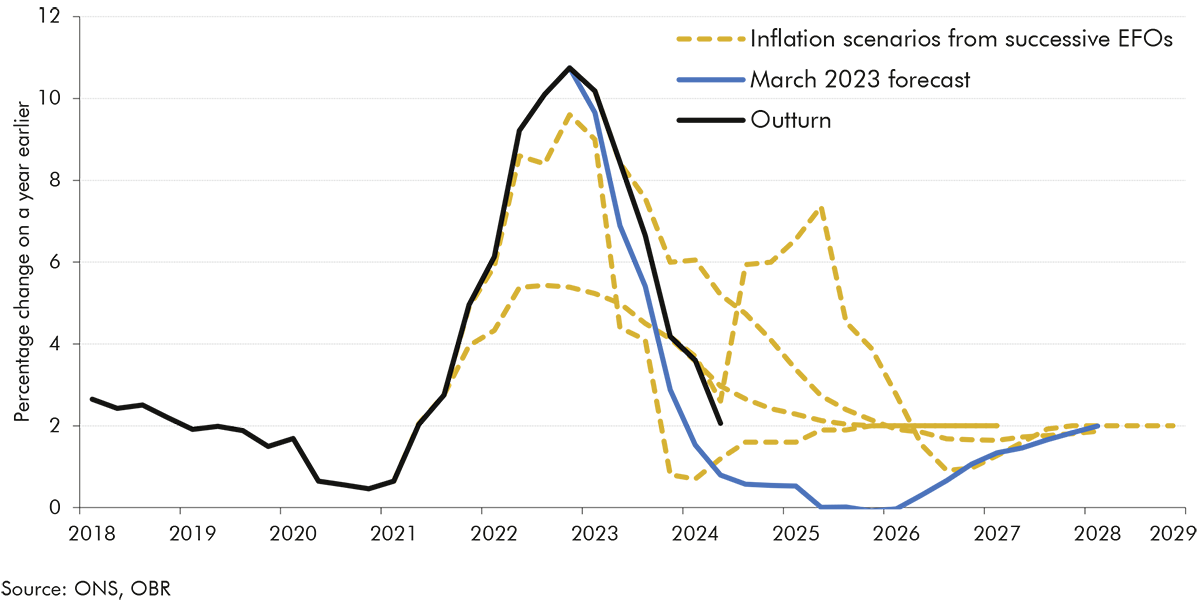
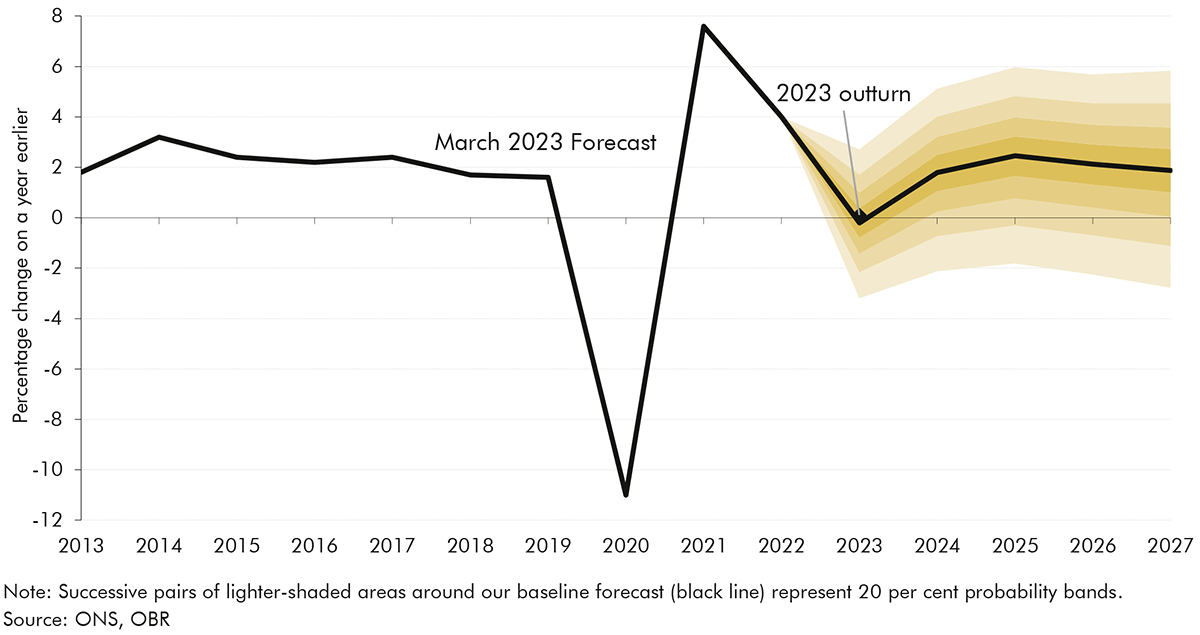
1.5 To reflect the difficulty of forecasting inflation during the UK’s largest inflation shock since the 1980s, we illustrated risks to our central inflation forecast using scenarios in successive EFOs (Chart 1.1). These scenarios mostly varied the size of the energy price shock and the extent to which inflation continued to reflect an imported energy shock versus passing through to domestically generated inflation. However, inflation often turned out to be somewhat higher than even our high-inflation scenarios, suggesting we could have used more extreme assumptions.
1.6 Higher domestically generated inflation meant Bank Rate and gilt rates turned out to be higher than market expectations at the time of our March 2023 forecast. Bank Rate peaked at 5.25 per cent, 1.0 percentage points higher and a quarter later than markets expected, and averaged 0.9 percentage points above our forecast for 2023-24. Long-term (20-year) gilt rates averaged 4.3 per cent, 0.6 percentage points higher than the path assumed in our forecast. Our forecast was produced during a volatile period for interest rates, so in our March 2023 EFO we included scenarios to show the fiscal impact of these being higher and lower. Bank Rate turned out to be broadly in line with our upside scenario, which was 1 percentage point above our central forecast.
1.7 Alongside the uncertainty around inflation and interest rates, over the past few years there have been significant challenges in forecasting two key drivers of the size of the labour force: inactivity and net migration. This has been compounded by uncertainty about the quality of the statistics in the ONS Labour Force Survey (LFS). Our March 2023 forecast for the participation rate was in line with outturn, as inactivity due to long-term sickness and among students rose, while inactivity due to caring fell. But we underestimated the size of the labour force due to a very large upward revision to the size of the population following the reweighting of the LFS. This was driven by net migration, which rose to 740,000 over the year to mid-2023, 430,000 higher than the assumption in our forecast.
1.8 Aggregate real household disposable income (RHDI) growth was much stronger than we forecast, with growth of 3.0 per cent in 2023-24 compared to our forecast of a 1.5 per cent fall. Higher-than-expected inflation was more than offset by a combination of stronger nominal wage growth, higher net interest income, and much faster population growth. This contributed to higher-than-expected real consumption growth, which was 0.8 percentage points above our central forecast, at 0.2 per cent. However, the upside surprise in RHDI did not fully feed through to consumption due to a much higher saving rate than we forecast. This is likely because a higher Bank Rate incentivised saving, and stronger real income growth meant, in aggregate, households did not need to lower their saving to support their real consumption as much as we expected.
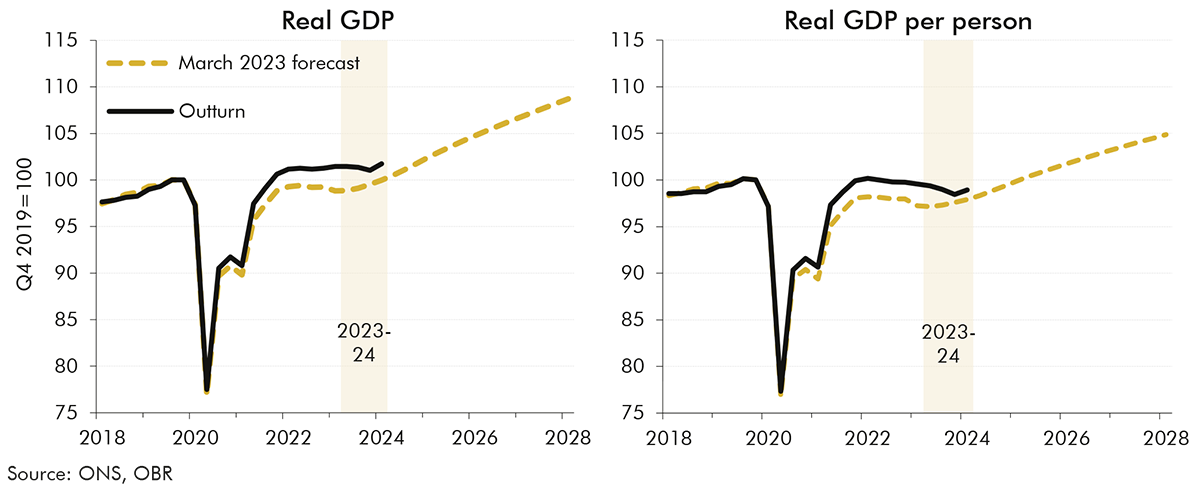
1.9 Based on ONS estimates available at the time of writing this report, real GDP growth of 0.1 per cent was very close to our forecast of 0.2 per cent. But its composition was somewhat different: growth in employment was higher than expected as net migration drove strong population growth, while average hours and productivity growth were weaker. In per-person terms, real GDP fell by 0.8 per cent in 2023-24 compared to our forecast of a 0.3 per cent decline. Despite the similar growth forecast, the level of real GDP in 2023-24 was 2 per cent higher than our forecast (Chart 1.2). This was because GDP revisions released after our March 2023 forecast suggested that the economy recovered more quickly and more fully from the pandemic than previously estimated. Nominal GDP growth, the key driver of our fiscal forecast, was higher than forecast due to stronger GDP deflator inflation.
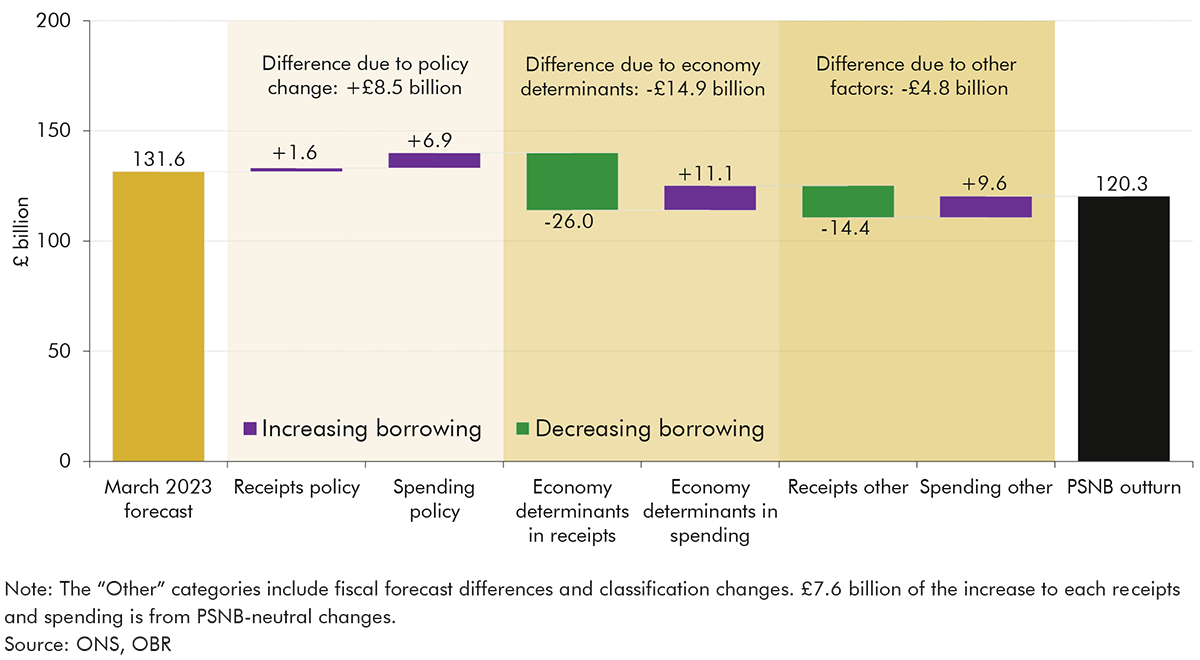
1.10 Public sector net borrowing (PSNB) in 2023-24 was £120.3 billion (4.4 per cent of GDP), £11.2 billion (0.4 per cent of GDP) lower than we forecast in March 2023. This undershoot was the net effect of receipts exceeding our forecast by £38.8 billion (1.4 per cent of GDP), and spending exceeding our forecast by £27.6 billion (1.0 per cent of GDP). Receipts grew more strongly primarily due to higher inflation and earnings which boost receipts from taxes levied on a nominal base. Inflation had a smaller proportional impact on spending as departmental expenditure and welfare benefit rates were largely fixed at an earlier point. Therefore, the net effect was that higher-than-anticipated inflation reduced PSNB relative to forecast, as summarised in Chart 1.3.
1.11 Policy changes increased borrowing by £8.5 billion, by reducing receipts by £1.6 billion and increasing spending by £6.9 billion relative to our March 2023 forecast. The reduction in receipts was primarily driven by the January 2024 2p cut to employee NICs. The largest policy change affecting spending was an increase in day-to-day departmental spending to fund 2023-24 pay settlements.
1.12 Economic factors reduced borrowing by £14.9 billion relative to our March 2023 forecast, through increasing receipts by £26.0 billion and spending by £11.1 billion:
1.13 Other fiscal forecasting factors reduced borrowing by £4.8 billion relative to our March 2023 forecast. This was the net result of a £14.4 billion underestimate of receipts, offset by a £9.6 billion underestimate in spending. £7.6 billion of these additional receipts and spending came from fiscally neutral changes. These other factors included:
1.14 Public sector net debt (PSND) came in 5.0 per cent of GDP lower than forecast in 2023-24. This largely reflects upward revisions to nominal GDP (4.7 per cent of GDP) with the remainder due to downward revisions to the cash level of debt by £7.9 billion (0.3 per cent of GDP). These include a series of largely offsetting changes:
1.15 Forecasting the recovery from the pandemic and unwinding of the energy shock was always likely to be challenging, given the lack of recent historical precedents upon which to draw. But the lessons we can learn from 2023-24 for future forecasts include:
2.1 This chapter assesses the performance of our March 2023 forecast for the 2023-24 financial year, using Quarterly National Accounts data published by the ONS on 28 June 2024.[3] During this year, inflation fell rapidly as energy prices dropped, while real GDP growth stagnated, following its recovery from the pandemic, and fell in per-person terms. The labour force grew as net migration reached record levels, but the inactivity rate rose further, resulting in a further decline in the employment rate from its pre-pandemic peak.
2.2 Our March 2023 forecast was finalised at a time when wholesale energy prices were falling from their peak but were still elevated. This meant there was significant uncertainty about the outlook for retail energy prices, inflation, and interest rates. There was also uncertainty about the post-pandemic path of labour market inactivity, while the interaction of the post-Brexit visa regime and the end of the pandemic created challenges for forecasting net migration. In this chapter, we therefore consider how we presented uncertainty around these key forecast drivers, including through the scenarios we presented for the future path of Bank Rate, energy prices, inflation, and labour market inactivity.
2.3 To evaluate the performance of our forecast for 2023-24, this chapter explores the differences between our central forecast and outturns. We also review how our assessment of the risks around key economic variables compared with subsequent developments. In doing so, we discuss:
2.4 We condition our forecast on market expectations of interest rates and energy prices. Actual interest rates in 2023-24 were significantly higher and gas prices significantly lower than the market expectations we used (Chart 2.1). Our March 2023 forecast was produced during a particularly volatile period for interest rates and energy prices. To reflect this uncertainty around our central forecast, in our March 2023 Economic and fiscal outlook (EFO) we included both energy price and interest rate scenarios to show the potential fiscal impact of higher and lower assumptions for these variables. The key differences between outturn and our central forecast and scenarios are:
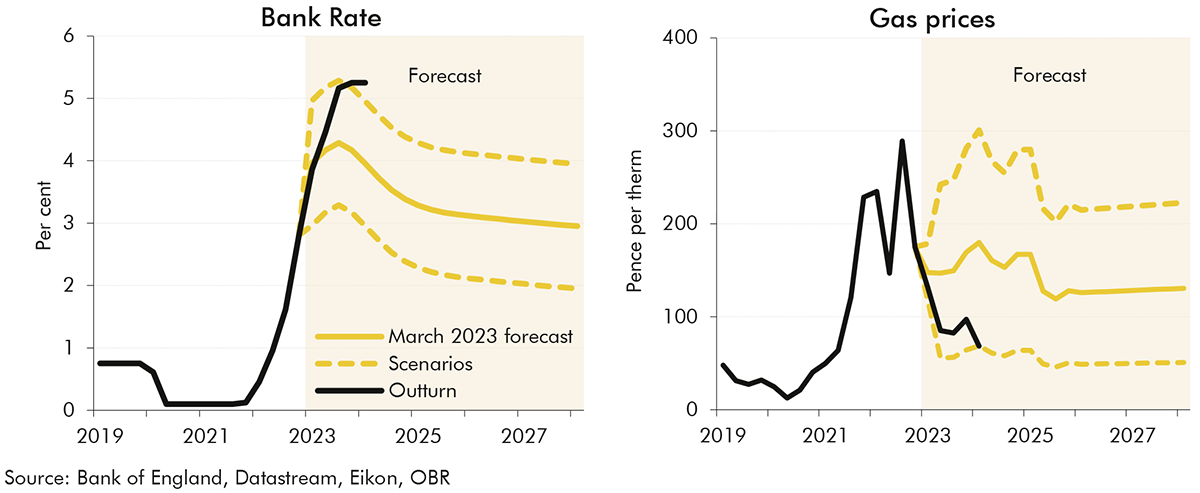
2.5 Other conditioning assumptions turned out to be closer to our March 2023 forecast (Table 2.1). Oil prices were 3.6 per cent higher than forecast, driven by production cuts by OPEC+ members and concerns about the conflict in the Middle East. The stock of assets held in the APF was only £11.6 billion (1.6 per cent) less than we assumed in our forecast. The exchange rate index was 5.6 per cent higher than forecast, likely reflecting higher expected interest rates in the UK compared to the US and euro area.
| Bank Rate (per cent) | Gilt rates (per cent) | Oil price ($ per barrel) | Gas price (pence per therm) | Quantitative easing(1) (£ billion) | Equity prices (FTSE All-share) | Exchange rate (index) | ||
|---|---|---|---|---|---|---|---|---|
| March 2023 forecast | 4.1 | 3.7 | 79.4 | 161.5 | 739.8 | 4,398 | 77.2 | |
| Outturn | 5.0 | 4.3 | 82.2 | 83.4 | 728.1 | 4,139 | 81.5 | |
| Difference | ||||||||
| Absolute | 0.9 | 0.6 | 2.8 | -78.1 | -11.6 | -259.7 | 4.3 | |
| Per cent | 3.6 | -48.3 | -1.6 | -5.9 | 5.6 | |||
| 1) Total asset purchases, including corporate bonds, at the end of the 2023-24 financial year. |
| Source: Bank of England, Datastream, Eikon, Ofgem, ONS, OBR |
2.6 Falling energy prices brought CPI inflation down from 10.1 per cent in 2022-23 to 5.7 per cent in 2023-24. But the decline was slower than expected as inflation was 1.5 percentage points higher in 2023-24 than in our March 2023 forecast. Inflation continued to fall after the final quarter of 2023-24, reaching its 2 per cent target in May 2024. This return to target is about two quarters later than we expected in our March 2023 forecast but in line with our expectation that the spike in inflation would prove to be transitory. RPI inflation, an important determinant of our fiscal forecast, was 1.1 percentage points higher than we expected in March 2023. This is slightly less than the difference in our CPI forecast as we overestimated the weights element of the wedge between RPI and CPI.[4]
| Percentage change on a year earlier | |||||||
|---|---|---|---|---|---|---|---|
| 2023 | 2024 | 2023-24 average | |||||
| Q1 | Q2 | Q3 | Q4 | Q1 | Q2 | ||
| CPI inflation | |||||||
| March 2023 forecast | 9.7 | 6.9 | 5.4 | 2.9 | 1.5 | 0.8 | 4.1 |
| Latest data | 10.2 | 8.4 | 6.7 | 4.2 | 3.6 | 2.1 | 5.7 |
| Difference(1) | 0.5 | 1.5 | 1.2 | 1.3 | 2.1 | 1.3 | 1.5 |
| RPI inflation | |||||||
| March 2023 forecast | 12.9 | 10.1 | 8.1 | 4.9 | 2.7 | 1.6 | 6.4 |
| Latest data | 13.6 | 11.2 | 9.0 | 5.5 | 4.6 | 3.0 | 7.5 |
| Difference(1) | 0.7 | 1.0 | 0.9 | 0.6 | 1.9 | 1.5 | 1.1 |
| 1) Differences in percentage points. Totals may not sum due to rounding. |
| Note: The quarterly figures are calculated as the annual growth in the three-month average of the monthly price indices rounded to one decimal place. |
| Source: ONS, OBR |
2.7 Looking at the drivers of these inflation forecast differences (Table 2.3), the impact of lower wholesale energy prices on utilities was more than offset by higher inflation in other categories due to:
| Percentage point contribution to annual CPI inflation | ||||||
|---|---|---|---|---|---|---|
| Food, beverages and tobacco | Utilities | Fuels | Other tradables | Other non-tradables | Total | |
| March 2023 forecast | 1.2 | 0.2 | -0.4 | 1.5 | 1.7 | 4.1 |
| Latest data | 1.8 | -0.1 | -0.4 | 1.8 | 2.6 | 5.7 |
| Difference(1) | 0.6 | -0.3 | 0.0 | 0.3 | 0.9 | 1.5 |
| 1) Differences in percentage points. Totals may not sum due to rounding. |
| Source: ONS, OBR |
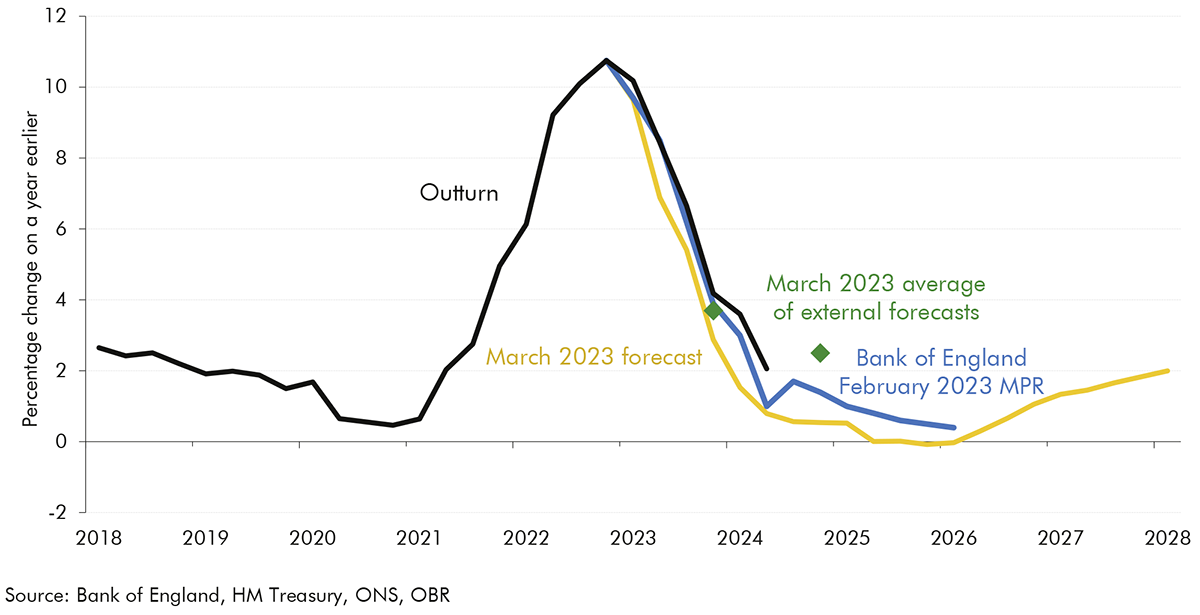
2.8 Chart 2.2 shows how our March 2023 inflation forecast compared to the Bank of England and other forecasters. We generally expected a faster decline in inflation than other forecasters: from 10.8 per cent in the fourth quarter of 2022 to 2.9 per cent in the fourth quarter of 2023. This was roughly 1 percentage point lower than the Bank’s forecast and the average of external forecasters. CPI outturn at the end of 2023 was 4.2 per cent, suggesting that the persistence of higher inflation has surprised other forecasters too, albeit to a lesser extent. CPI inflation fell further in the first and second quarters of 2024 and averaged around 1⅔ percentage points higher than our March 2023 forecast.
The outlook for inflation was highly uncertain at the time of our March 2023 forecast: the UK was experiencing the largest inflation shock since the 1980s, and the first significant shock in the era of independent inflation-targeting central banks. This box reviews our presentation of this uncertainty using fan charts and scenarios in successive EFOs.
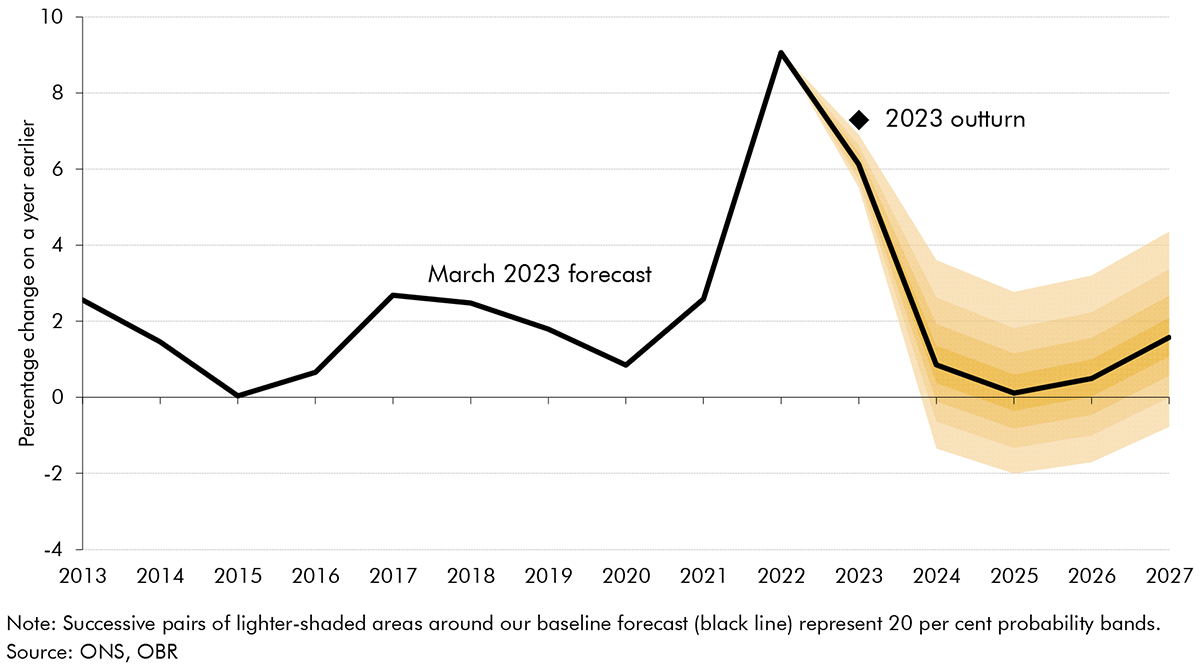
Chart A shows the fan chart included in our March 2023 EFO. The distribution is based on the range of forecast differences from OBR and Treasury inflation forecasts since 2003. This was a period of relatively low and stable inflation, so the forecast differences used to construct the fan charts were relatively small up to 2022. As such, these fan charts do not represent our assessment of specific risks to the central forecast, in particular during periods of high uncertainty. Instead, they show the outcomes that someone might anticipate if they believed that forecast errors in the past 20 years offered a reasonable guide to future forecast errors.
CPI inflation in 2023 was 7.3 per cent, which fell outside the fan chart’s 80 per cent probability bands. The probability bands are narrow in the first year of our forecasts because, historically, differences between forecast and outturn in the first forecast year were typically small. However, the average of past forecast differences is not always a good indicator of the degree of uncertainty, especially following large shocks such as the energy crisis. We noted in our March 2023 EFO that the distribution around our CPI inflation forecast “is likely to understate the degree of uncertainty in the current environment of very high and volatile energy prices”.
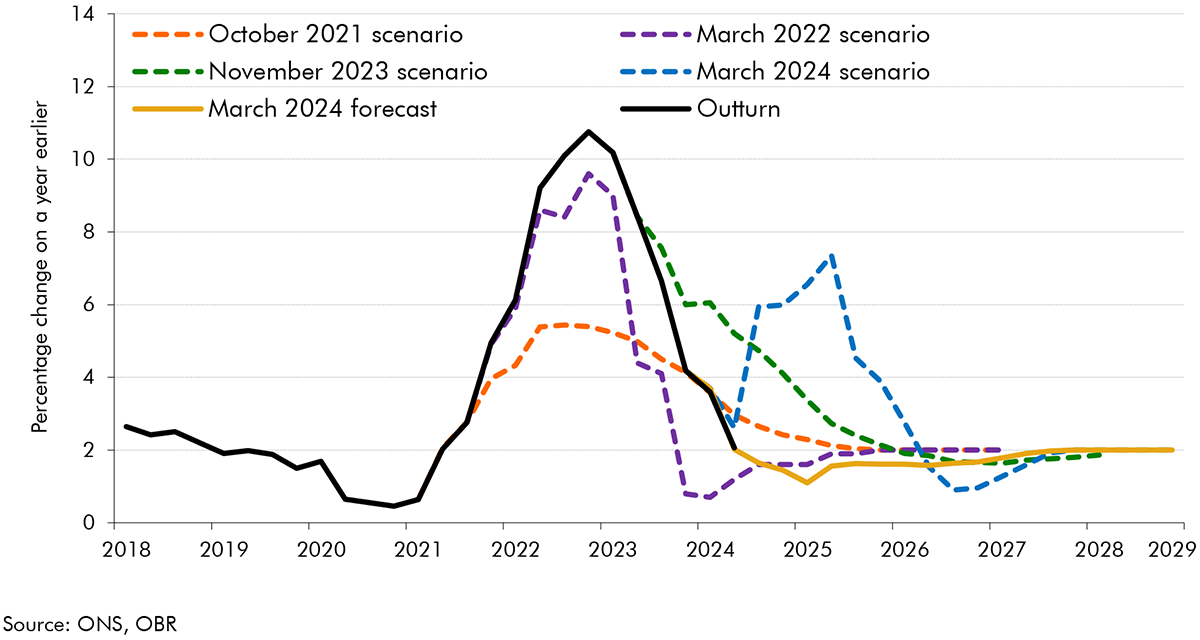
Given the limitations of historical fan charts in capturing the uncertainty around our inflation forecast, our recent forecasts have also presented a range of inflation scenarios (Chart B):
These scenarios illustrated the risks to our central inflation forecast and they turned out to mirror the sources of the eventual forecast differences: (i) the size of the energy price shock and (ii) the extent to which inflation remained an imported energy shock versus passing through to domestically generated inflation. However, inflation often turned out to be somewhat higher than even our high-inflation scenarios, suggesting that we could have better illustrated the risks around our central forecast by using more extreme assumptions.
This assessment suggests that in future we should:
a) Box 3.2 of the October 2021 EFO.
b) We explored stochastic simulations in OBR, Working Paper No. 17, Evaluating forecast uncertainty with stochastic simulations, December 2021.
c) Bank of England, Forecasting for monetary policy making and communication at the Bank of England: a review, April 2024.
d) Our fiscal ready reckoners are available on our website. See The OBR ready reckoner, October 2023.
2.9 Labour market outturns for 2023-24 have been restated following the reweighting of the ONS Labour Force Survey (LFS) in February 2024 with updated estimates of the size and composition of the UK population. This resulted in a larger adult population due to a stronger rise in net migration, which is partially offset by lower labour force participation and average hours worked due to the ageing of the population. While this reweighting has improved the representativeness of the data, challenges with low sample sizes and volatility in recent periods will take longer to resolve and the ONS advises caution when interpreting these numbers.[5] The ONS plans a further update to these estimates by the end of this year so they capture more recent trends in net migration and other demographics.[6] This will be followed with a fuller reweighting and switchover to the Transformed LFS survey in 2025, which may have further implications for our understanding of labour supply over 2023-24.[7] These uncertainties complicate our assessment of the labour market forecast, which we plan to revisit when the final version of the labour market estimates become available.
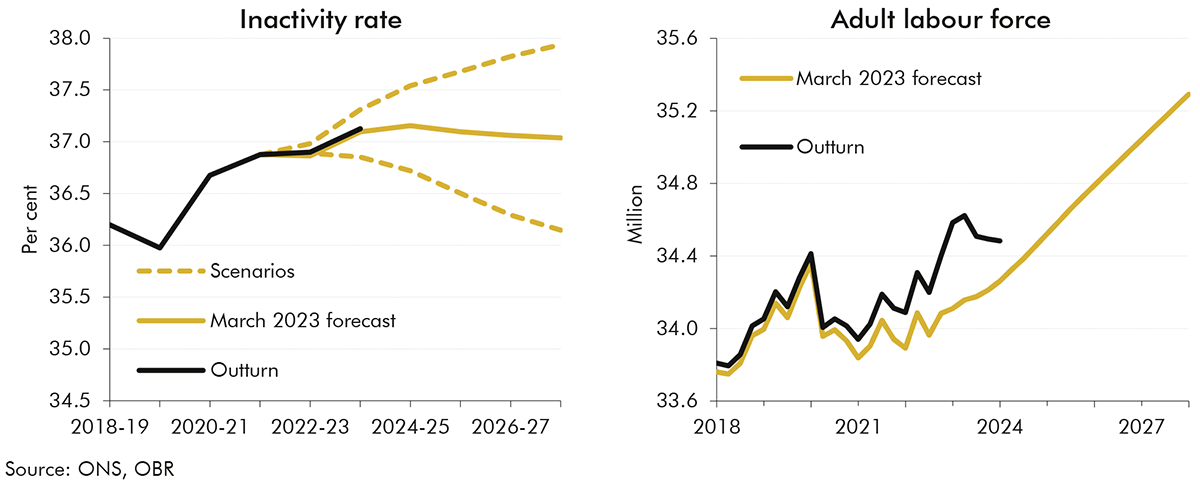
2.10 Labour supply growth in 2023-24, measured in terms of total hours worked, was broadly in line with our March 2023 forecast (Table 2.4). This is despite frozen personal tax thresholds, combined with stronger-than-expected nominal wage growth, weighing on labour supply.[8] Stronger growth in employment and a smaller rise in unemployment suggest that labour market conditions eased by less than expected last year. This was offset by weaker average hours, leaving total hours worked little changed year on year. However, the level of total hours worked in 2023-24 was 0.9 per cent higher than our March 2023 forecast. This was mainly due to an underestimation of the adult labour force, with 2023-24 outturn around 1 per cent (350,000) higher than our forecast. This entirely reflects an upward revision to the population level following the LFS reweighting, while our forecast for the participation rate was in line with outturn.
2.11 The two biggest challenges in forecasting the labour market over the last few years have been the significant uncertainty around net migration and inactivity, which both reached historically high levels in the period since the pandemic:
2.12 Nominal average earnings growth was stronger than we expected in our March 2023 forecast, by 3.1 percentage points. This was driven by a combination of higher-than-expected inflation and continued tightness in the labour market. Furthermore, industrial action, which had begun in 2022 and continued into 2023, posed another uncertainty around our forecasts. This was particularly the case for our public sector pay forecast which is conditioned on announced government policy. Public sector pay growth rose sharply to 8 per cent over 2023-24, substantially above what was implied by government spending forecasts of the pay bill available at the time. The government spending forecast in our March 2023 EFO would not have included subsequent decisions over the course of 2023 on a more generous package of basic pay increases of 5-7 per cent, some of which were backdated, and a number of one-off, lump-sum payments.
2.13 Growth in aggregate real household disposable income (RHDI) was much stronger than we forecast in March 2023, rising by 3.0 per cent in 2023-24, rather than falling by 1.5 per cent. This was partly due to nominal wage growth responding by more than expected to high inflation, as the terms of trade (the ratio of export to import prices and a key driver of income growth) rebounded significantly faster than we anticipated. Non-labour income also grew more quickly than we expected, driven by net interest income and households’ operating surplus. Long fixes on mortgage interest rates mean that households’ interest payments have risen more slowly than the interest they have earned on savings deposits as Bank Rate has risen. While we anticipated some effect from this, the size of the impact has been surprisingly large.[11] Meanwhile, the change in households’ operating surplus is likely due to stronger-than-expected rents,[12] though it is also a volatile series subject to significant revisions. Finally, stronger-than-expected population growth also meant that employment growth was above our forecast, pushing up aggregate RHDI.
2.14 Productivity growth in 2023-24 was 0.1 per cent, close to our forecast of 0.2 per cent. Productivity growth has been weak since the financial crisis, and this has been compounded in recent years with disruptions from the pandemic, Brexit and the higher cost of energy. Trend productivity growth has averaged ⅔ per cent in the decade following the financial crisis, well below the average of around 2¼ per cent in the decade before.
| Total hours (million) | Average hours (hours) | Total employment (thousand) | Labour force (thousand) | Unemployment rate(2) | Average earnings | Productivity per hour | |
|---|---|---|---|---|---|---|---|
| Per cent change from previous year | |||||||
| March 2023 forecast | 0.0 | 0.1 | -0.1 | 0.4 | 0.5 | 4.1 | 0.2 |
| Latest data | 0.0 | -0.4 | 0.2 | 0.4 | 0.2 | 7.2 | 0.1 |
| Difference(1) | -0.1 | -0.5 | 0.3 | 0.0 | -0.3 | 3.1 | -0.1 |
| Levels change from previous year | |||||||
| March 2023 forecast | 0.2 | 0.0 | -26 | 141 | 167 | ||
| Latest data | -0.4 | -0.1 | 74 | 154 | 81 | ||
| Difference(1) | -0.7 | -0.2 | 100 | 13 | -87 | ||
| 1) Difference in unrounded numbers. |
| 2) Levels changes are in thousands of unemployed people. |
| Source: ONS, OBR |
2.15 Real GDP growth over 2023-24 was 0.1 per cent, only 0.1 percentage points lower than we forecast in March 2023. While our forecast of GDP growth over this period was close to outturn, its composition was different (Table 2.5):
| Percentage points | |||||||
|---|---|---|---|---|---|---|---|
| Private consumption | Business investment | Net trade | Private residential investment | Total government | Other | GDP | |
| March 2023 forecast | -0.4 | -0.4 | -1.4 | -0.4 | 1.3 | 1.4 | 0.2 |
| Latest data | 0.1 | 0.3 | -0.5 | -0.4 | 0.7 | -0.2 | 0.1 |
| Difference(1) | 0.5 | 0.7 | 0.9 | 0.0 | -0.5 | -1.6 | -0.1 |
| 1) Difference in unrounded numbers. |
| Source: ONS, OBR |
2.16 In each of our EFOs, we present our central forecast for the economy against a backdrop of the range of uncertainty surrounding any point estimate forecast. In our March 2023 EFO, we presented our GDP growth forecast in the context of a fan chart that illustrates the probability of a range of possible outcomes conditioned on the size of past differences in official forecasts. Under these assumptions, we assessed there was approximately a 50 per cent chance that real GDP growth in 2023 was positive which turned out to be the case. But past forecast errors may not always be a guide for future economic shocks. For this reason, we also presented alternative upside and downside scenarios to illustrate further the uncertainty around our assessment.
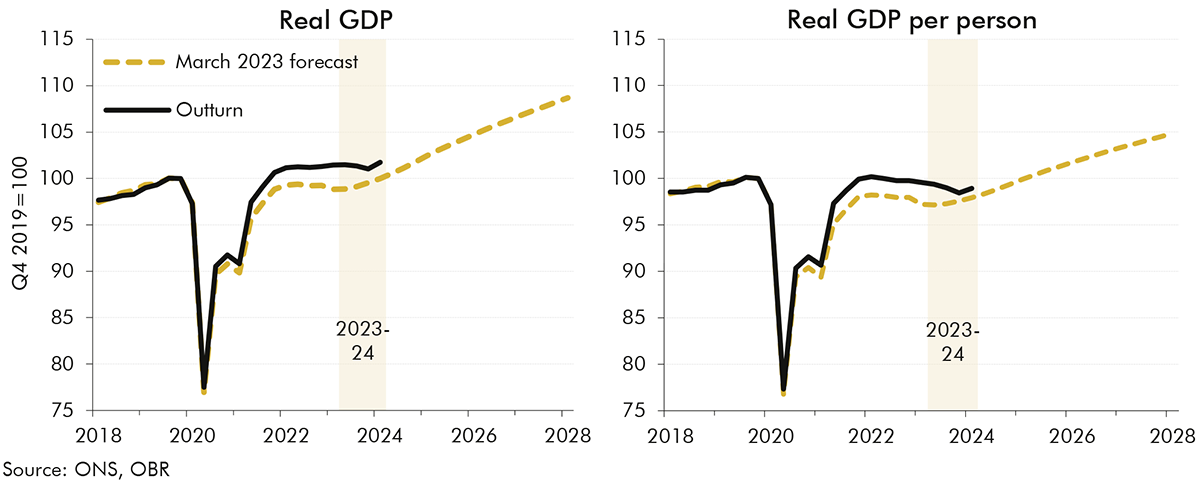
2.17 Despite the similar GDP growth forecast, the level of real GDP was higher in outturn than in our forecast (Chart 2.5, left panel). GDP revisions released after our March 2023 forecast suggested that the economy recovered more quickly and more fully from the pandemic than previously estimated. In the Quarterly National Accounts consistent with Blue Book 2023, the ONS revised up GDP growth between 2020 and 2022, leaving the level at the end of 2022 around 2 per cent higher than the data available at our March 2023 forecast. This meant that in 2023-24 the GDP level was also around 2 per cent higher than our forecast. In terms of components, business investment was revised up, so the level was 2.3 per cent higher at the end of 2022 than the vintage of data used in our March 2023 forecast. The level of consumption was revised down so it was 0.7 lower at the end of 2022 and the level of exports and imports were both revised up by the ONS.
2.18 In per-person terms, real GDP fell by 0.8 per cent in 2023-24 compared to our March 2023 forecast of a 0.3 per cent decline (Chart 2.5, right panel). Real GDP per person fell in each quarter between the first quarter of 2022 and the end of 2023, driven by weak productivity growth and rises in inactivity. However, the overall level is higher than in our March 2023 forecast due to the historical revisions to GDP.
2.19 Our economy forecast provides the basis for the fiscal forecasts that we use to assess the Government’s performance against its fiscal targets. The most fiscally important elements of the economy forecast are those that drive the major tax bases, namely the income and expenditure components of nominal rather than real GDP. Stronger-than-expected growth in the GDP deflator meant our March 2023 forecast underestimated growth in nominal GDP in 2023-24, despite real GDP growth outturn being close to our forecast. The GDP deflator grew by 6.2 per cent in 2023-24, 3.7 percentage points higher than in our forecast. This difference is more than twice our CPI inflation forecast error.[14] The GDP deflator includes the change in the relative price of exports to imports, which recovered much faster than we expected largely due to much lower gas prices than assumed in our forecast. In addition, the implied price of government consumption and investment were higher than our forecast.
2.20 Chart 2.6 shows the composition of nominal GDP growth:
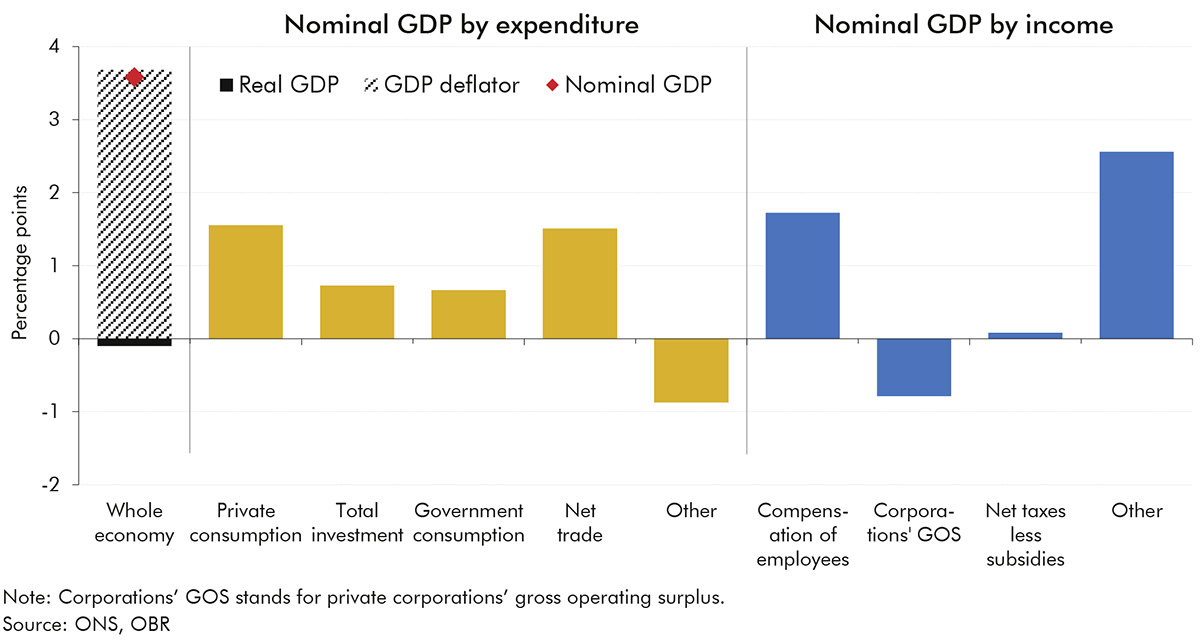
2.21 The combination of the higher level of real GDP, due to ONS revisions, and the higher-than-expected growth in the GDP deflator meant that the level of nominal GDP in 2023-24 was 5.6 per cent higher than in our March 2023 forecast. This meant that although receipts and spending outturns for 2023-24 were both higher than we forecast in March 2023 in nominal terms, when presented as a share of GDP, they were each lower than expected. As we explore in the following chapter, the receipts and spending forecast differences were smaller than that for nominal GDP because revisions to the historical level of GDP did not influence these. In addition, departmental spending and welfare benefit rates were already fixed for 2023-24 by the time of our March 2023 forecast.
3.1 This chapter assesses the performance of our March 2023 fiscal forecast for the 2023-24 financial year. We explore the differences between our forecast and the latest outturn data for:
3.2 Our usual approach in Forecast evaluation reports (FERs) is to break down differences between outturn data and our fiscal forecasts into four categories:
3.3 We have taken this approach to analysing the performance of our March 2023 receipts forecast. For public sector expenditure, as discussed in the Foreword, at the time this report was prepared the available outturn data source was the ONS’s (‘PSAT’) economic categories of expenditure, rather than the full ‘total managed expenditure’ (‘TME’) breakdown that we focus on in our forecast and would normally analyse in FERs. This means we have had to classify the major forecast differences into groups that approximate closely to ‘economic’ and ‘other fiscal forecasting’ factors, plus the impact of policy. We are confident the broad results are nevertheless robust.
3.4 PSNB in 2023-24 was £120.3 billion (4.4 per cent of GDP). In March 2023, we expected it to be £131.6 billion (5.1 per cent of GDP) – an £11.2 billion (8.5 per cent) overestimate. As we discuss in detail below, this largely reflects higher-than-anticipated inflation and nominal earnings in 2023-24, which increased receipts by more than it increased spending.
3.5 Our earlier March 2022 forecast for 2023-24 substantially underestimated borrowing by £70.1 billion, with our subsequent three forecasts in November 2022, March 2023 and November 2023 coming in much closer to outturn (Chart 3.1). This path is also reflected in the average of contemporaneous independent forecasts (also shown in Chart 3.1). Forecasters became substantially more pessimistic about the outlook for the economy and government borrowing during autumn 2022, due to the steep rise in energy costs, inflation and interest rates that took place in the wake of the energy crisis and so-called ‘mini-Budget’ (discussed in more detail in our October 2023 FER).
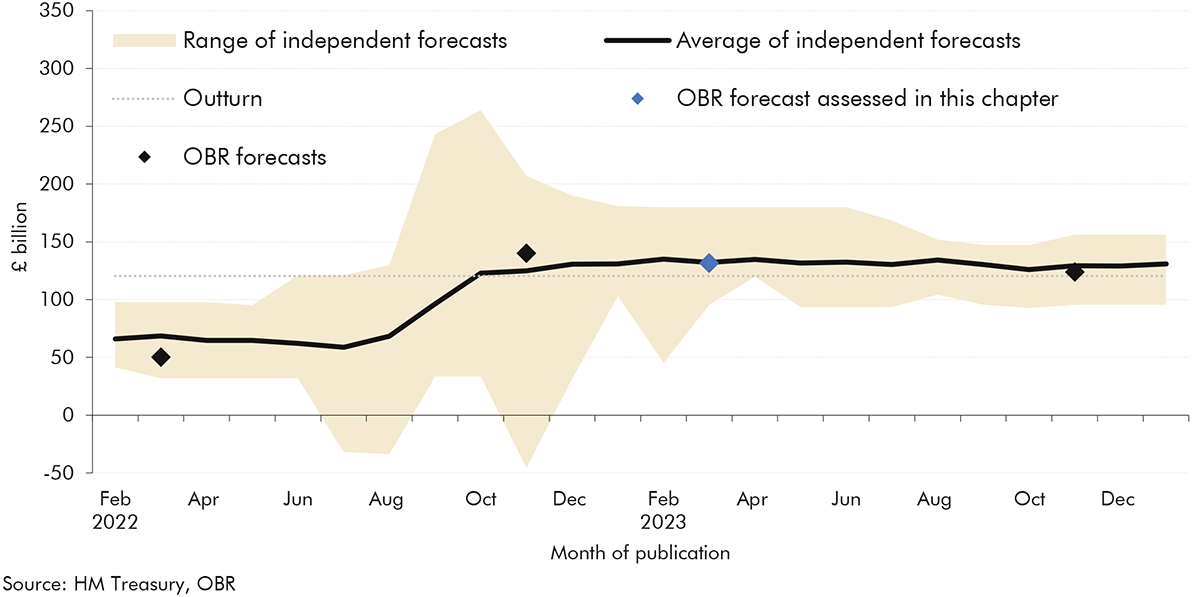
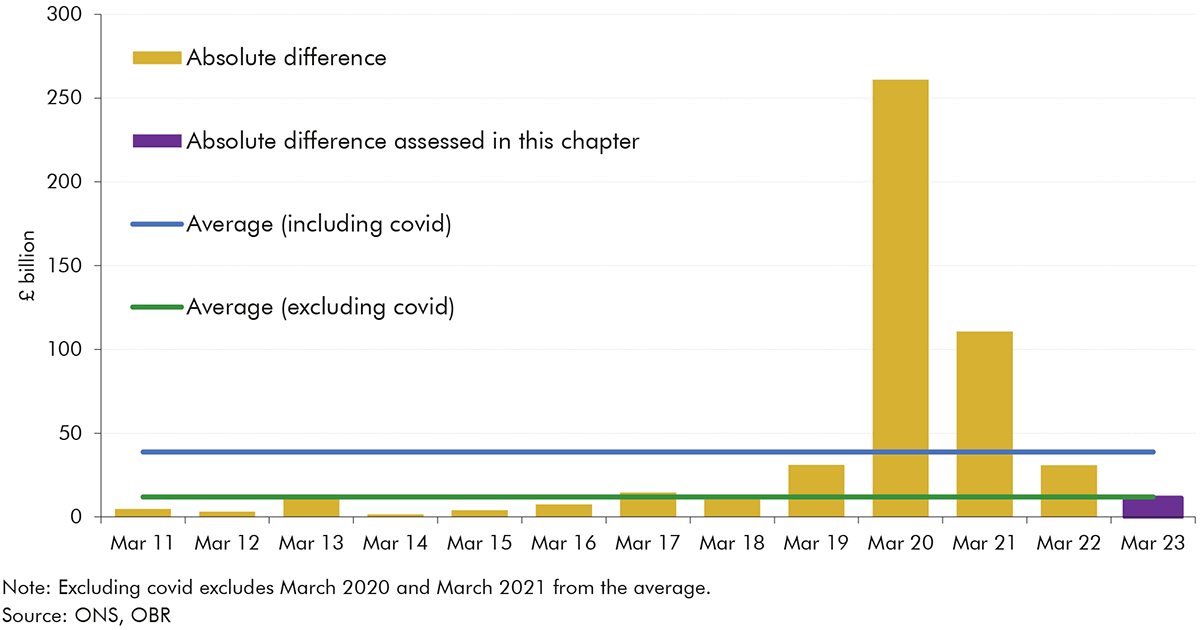
3.6 Our March 2023 one-year-ahead PSNB forecast difference was smaller than average past differences. Chart 3.2 below shows the absolute values of our historic one-year-ahead PSNB forecast differences, with averages including (£38.8 billion) and excluding (£12.0 billion) those forecasts that were affected by the Covid pandemic. Both averages are higher than the £11.2 billion March 2023 forecast difference. This below-average forecast difference is despite the significant risks to our March 2023 forecasts from the uncertainty at that time around the outlook for inflation, gas prices, and interest rates. Reflecting these risks, the March 2023 Economic and fiscal outlook (EFO) set out alternative scenarios for gas prices and interest rates, which included the impact these could have on the central PSNB forecast. The risks from inflation were further assessed in the November 2023 EFO, which showed that higher domestically generated inflation will tend to reduce PSNB, largely by boosting the major nominal tax receipts by more than it boosts nominal expenditure. This is consistent with the finding in this report that a large portion of the lower-than-forecast PSNB in 2023-24 was driven by more domestically generated inflation. Full analysis of the drivers of inflation in 2023-24 compared to our EFO economy forecasts and risk analysis is provided in Chapter 2 of this report.
3.7 Chart 3.3 summarises the drivers of the £11.2 billion difference between the March 2023 forecast for PSNB in 2023-24 and outturn. It shows that:
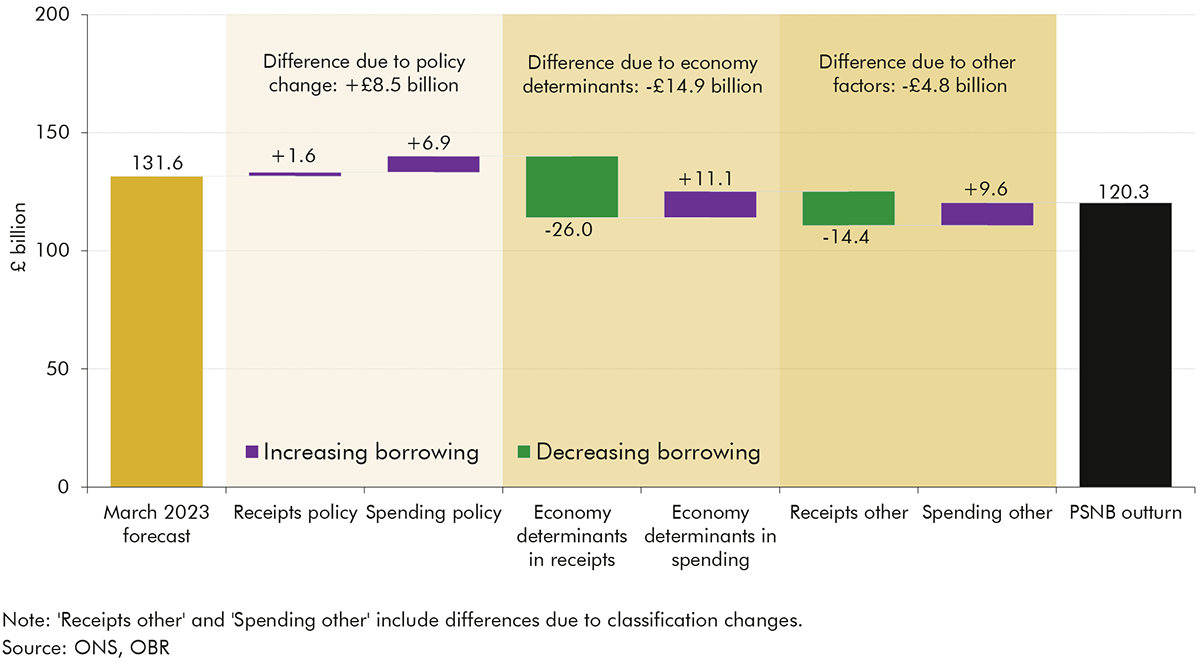
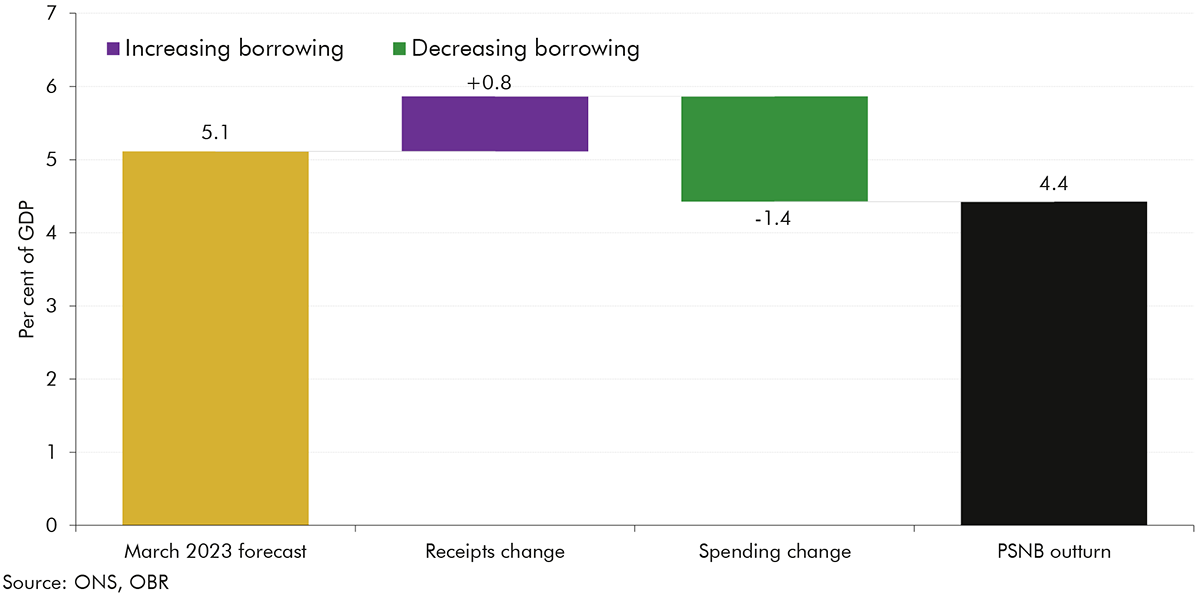
3.8 Receipts and spending were both higher than forecast in nominal terms, but lower than forecast as a share of GDP, by 0.8 percentage points and 1.4 percentage points respectively. In both cases this largely reflects the higher-than-forecast level of nominal GDP in 2023-24 arising from the ONS’ 2023 Blue Book revisions that were released after we had produced the forecast. These increased 2020-to-2022 GDP growth, as discussed in paragraph 2.17 of Chapter 2. By raising the level of nominal GDP in 2023-24, this reduced both tax and spending as a share of GDP in that year. Lower-than-forecast spending as a share of GDP also reflects departmental spending and welfare benefit rates being fixed in cash terms despite higher-than-anticipated nominal GDP growth in 2023-24. The resulting larger undershoot for spending as a share of GDP led to borrowing as a share of GDP being 0.7 per cent of GDP below forecast (Chart 3.4). In the remainder of this chapter, we focus on the nominal differences in receipts and spending.
3.9 Public sector current receipts (PSCR) in 2023-24 were £38.8 billion higher than we anticipated in the March 2023 forecast. This was primarily due to a £26.0 billion difference relating to economic factors, largely as a result of the effects of higher-than-anticipated inflation and nominal earnings (£18.4 billion). This is summarised in Chart 3.5 and discussed in detail in the sections below.
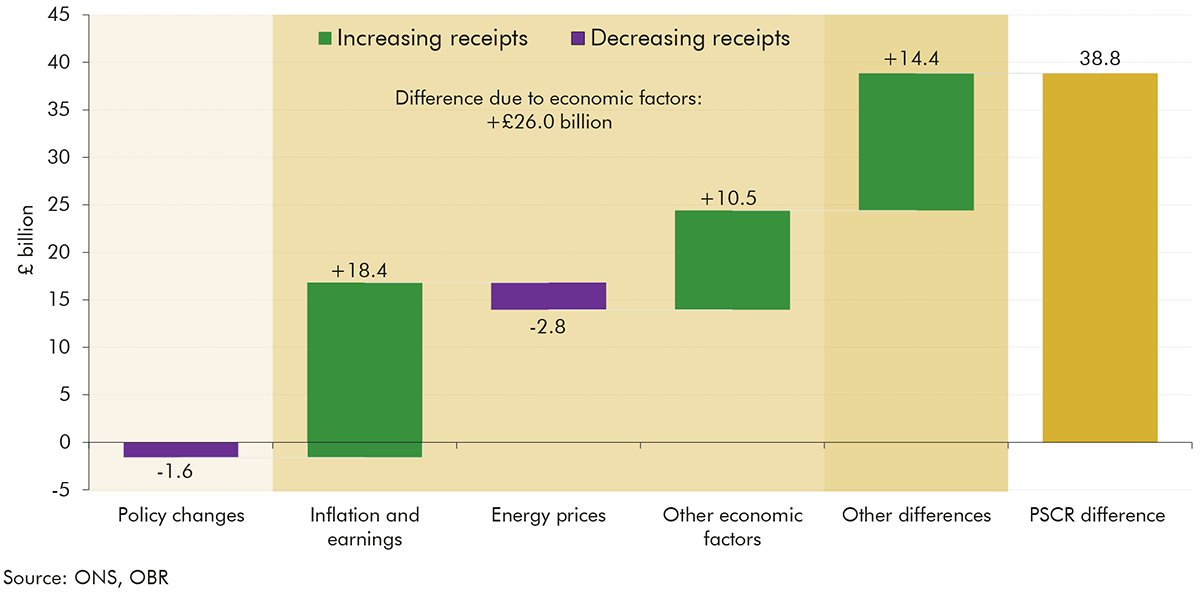
3.10 Policy changes announced after March 2023 but with a receipts effect during 2023-24 added £1.6 billion to borrowing. These included:
3.11 Higher domestically generated inflation tends to boost tax receipts because the majority of taxes are levied as a proportion of the nominal value of the tax bases, for example, earnings, company profits, or retail sales. A smaller portion of receipts come from taxes levied in volume terms – such as fuel duty, levied per litre of fuel – which tend to not rise as a result of inflation in the short term.[15]
3.12 Higher-than-forecast inflation and nominal earnings increased receipts in 2023-24 by £18.4 billion relative to the forecast. This is mainly driven by the 3.1 per cent overshoot in nominal earnings increasing income tax and NICs receipts, and the 2.6 per cent nominal consumption overshoot increasing VAT receipts. Chart 3.6 below compares the rise in nominal earnings and consumption relative to the forecast with the rise in income tax, NICs, and VAT receipts resulting from changes to nominal earnings, consumption, and other economic and non-economic factors.
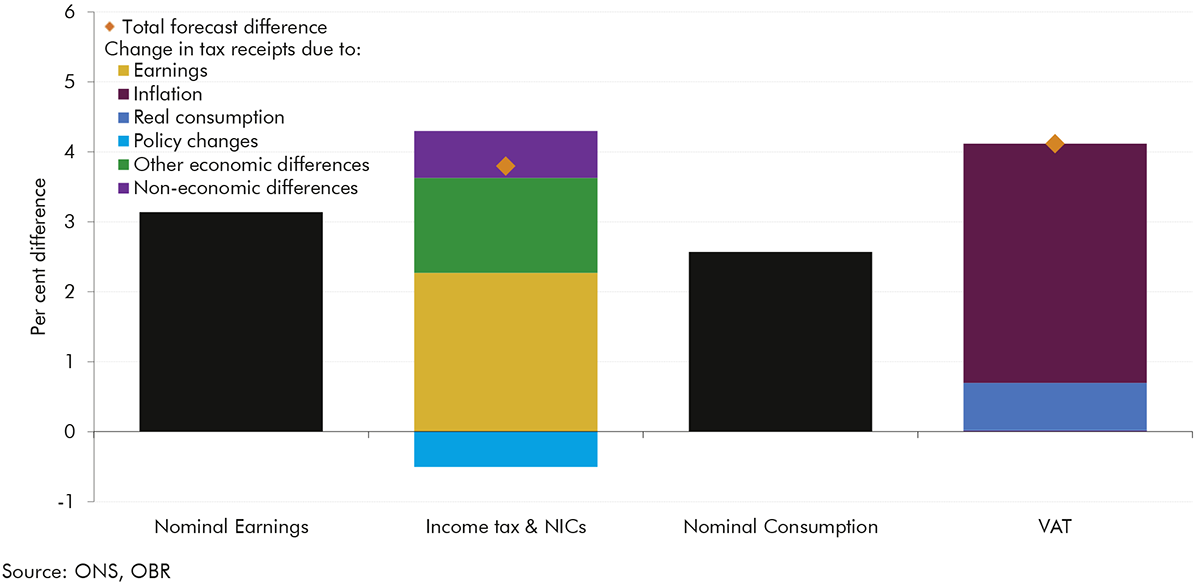
3.13 Higher nominal average earnings explain £10.0 billion of the total £16.0 billion overshoot in income tax and NICs receipts resulting from economic factors. The remaining impact from economic factors is mainly due to higher employment levels – discussed below – which are shown in the green bar in Chart 3.6. The rise in income tax and NICs receipts related to earnings was proportionately smaller than the rise in earnings, as the overshoot in 2023-24 earnings did not affect self-assessment receipts, which were based on 2022-23 liabilities. However, the overall impact was amplified because, since April 2021, most tax thresholds, which typically increase with inflation each year, have been frozen (for more details see paragraphs 3.38 to 3.41 in the March 2024 EFO). This created significant ‘fiscal drag’, where more of taxpayers’ income is taxed and taxed at higher rates.
3.14 Higher inflation explains £5.5 billion of the £6.6 billion overshoot in in VAT receipts resulting from economic factors. The remaining impact is from the share of the nominal consumption overshoot that results from higher real consumption rather than inflation.[16] The prices of VAT-intensive goods exceeded our forecasts more significantly than consumer prices overall, causing £1.1 billion of the higher-than-expected VAT receipts from the inflation surprise. This is why, as shown in Chart 3.6, the overall overshoot in VAT receipts was greater than the overshoot in nominal consumption. Table 2.3 in Chapter 2 shows that most of the CPI overshoot came from higher prices in ‘other tradeables’ and ‘other non-tradeables’, primarily consisting of goods subject to the 20 per cent standard rate of VAT. The less VAT-intensive categories of fuels and utilities (domestic electricity and gas paying only the 5 per cent reduced rate of VAT) contributed less to CPI inflation than anticipated.
3.15 Higher inflation increased other receipts lines by £2.9 billion. Of this, £1.3 billion relates to onshore corporation tax, where inflation increased non-financial companies’ profits, £0.9 billion relates to higher PSNB-neutral VAT refunds that are offset in spending, and £0.7 billion relates to smaller tax lines that increased with the larger nominal economy.
3.16 Lower-than-anticipated energy prices drove a net decrease in receipts of £2.8 billion – lower oil, gas and electricity receipts partially offset by higher Contracts for Difference (CfDs) receipts. Wholesale electricity and gas prices were both around half our central estimate, due to a combination of lower demand, higher-than-anticipated renewable electricity penetration, and a milder winter. Lower energy prices drove £4.8 billion of the £7.5 billion (64.3 per cent) undershoot in revenues from taxes on oil, gas, and electricity generation: oil and gas revenues by £2.6 billion and electricity generator levy revenues by £2.2 billion.[17] These were partially offset by lower electricity prices boosting CfDs receipts by £2.0 billion, but this is fiscally neutral as it is fully offset in spending.
3.17 Economic factors other than earnings, inflation and energy prices led to our 2023-24 receipts forecast coming in £10.5 billion higher than anticipated. Some of the main drivers of this overshoot included:
3.18 The capacity markets and the green gas support schemes were included in our environmental levies forecast but not in ONS outturn, reducing outturn receipts relative to our forecast by £1.1 billion. This is entirely offset in spending and so is neutral for borrowing. These schemes have now been classified by the ONS but are not yet included in their data.
3.19 The remaining £15.5 billion of the receipts forecast difference was due to other tax-specific differences, of which £7.6 billion was from fiscally neutral changes that are offset in spending. In particular:
| £ billion | |||||||
|---|---|---|---|---|---|---|---|
| Forecast | Outturn | Difference | of which: | ||||
| Policy changes | Economic factors | Classification changes | Fiscal forecast difference | ||||
| Income tax and NICs | 440.3 | 457.0 | 16.7 | -2.2 | 16.0 | 0.0 | 3.0 |
| Value added tax (VAT) | 162.2 | 168.9 | 6.7 | 0.0 | 6.6 | 0.0 | 0.0 |
| Onshore corporation tax | 76.9 | 91.6 | 14.7 | 0.7 | 3.1 | 0.0 | 10.9 |
| Fuel duties | 24.3 | 24.8 | 0.5 | 0.0 | 0.0 | 0.0 | 0.5 |
| UK Oil and Gas revenues(2) | 10.4 | 5.1 | -5.4 | 0.0 | -2.6 | 0.0 | -2.8 |
| Electricity generator levy | 3.3 | 1.2 | -2.1 | 0.0 | -2.2 | 0.0 | 0.1 |
| Business rates | 29.9 | 30.6 | 0.7 | 0.0 | 0.0 | 0.0 | 0.7 |
| Stamp duty land tax(1) | 11.5 | 11.6 | 0.2 | 0.0 | -0.2 | 0.0 | 0.4 |
| Tobacco duties | 10.4 | 9.0 | -1.5 | 0.0 | 0.1 | 0.0 | -1.6 |
| Alcohol duties | 13.1 | 12.5 | -0.6 | -0.1 | 0.2 | 0.0 | -0.7 |
| Environmental levies | 7.6 | 9.5 | 1.9 | 0.0 | 2.0 | -1.1 | 1.0 |
| ETS auction receipts | 6.2 | 6.0 | -0.2 | 0.0 | 0.0 | 0.0 | -0.2 |
| Capital gains tax | 17.8 | 14.5 | -3.3 | -0.1 | -0.2 | 0.0 | -3.0 |
| Other taxes | 136.6 | 138.6 | 2.0 | 0.0 | 1.8 | 0.0 | 0.2 |
| National Accounts taxes | 950.5 | 980.9 | 30.4 | -1.6 | 24.5 | -1.1 | 8.6 |
| Interest and dividends | 40.5 | 39.5 | -1.0 | 0.0 | 1.5 | 0.0 | -2.6 |
| Gross operating surplus | 64.4 | 73.6 | 9.2 | 0.0 | 0.0 | 0.0 | 9.2 |
| Other non-tax receipts | 2.1 | 2.5 | 0.3 | 0.0 | 0.0 | 0.0 | 0.3 |
| Current receipts | 1,057.6 | 1,096.5 | 38.8 | -1.6 | 26.0 | -1.1 | 15.5 |
| 1) Excludes Scottish LBTT and Welsh LTT. |
| 2) Includes Offshore Corporation Tax, Petroleum Revenue Tax and the Energy Profits Levy. |
| Source: ONS, OBR |
3.20 Total managed expenditure in 2023-24 was £1,217 billion, or £27.6 billion (2.3 per cent) higher than the March 2023 forecast of £1,189 billion. As explained above, spending data availability has meant we have not been able to apply our usual breakdowns in line with our forecast categories. The approach we have used instead, based on ONS PSAT data, shows that the largest contribution to the increase came from economic factors, which explain £11.1 billion of the difference, with policy decisions contributing £6.9 billion, and the remainder explained by other fiscal forecasting differences, as shown in Chart 3.7.
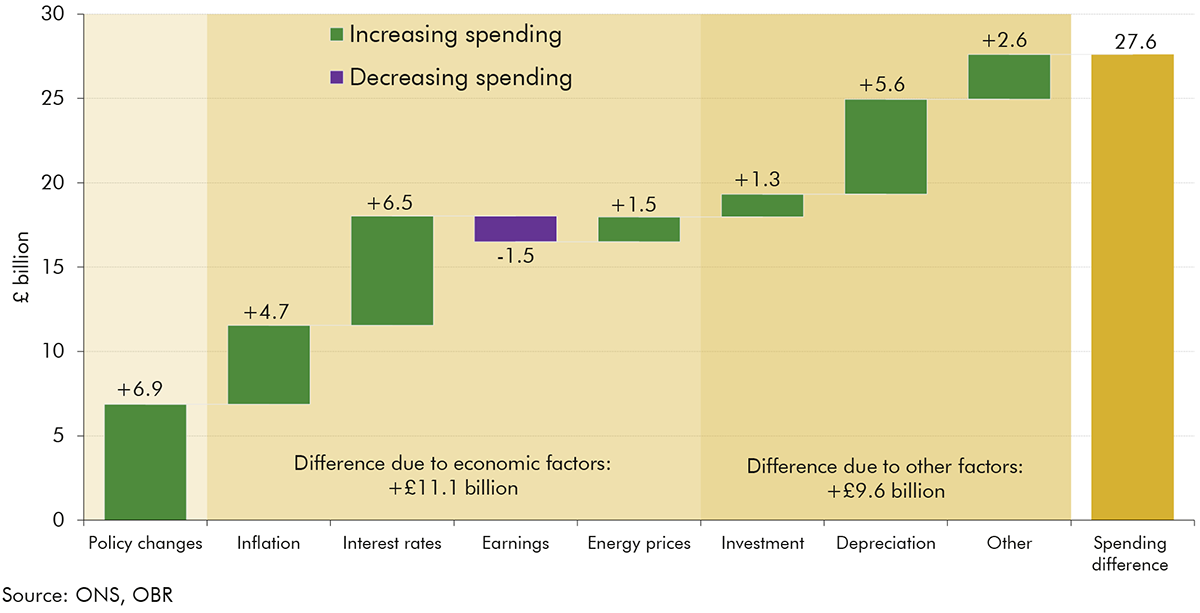
3.21 Policy decisions taken after the March 2023 EFO increased spending by £6.9 billion. The largest policy decision was the £4.4 billion of higher resource departmental spending to fund 2023-24 pay settlements. Of this, £3.9 billion went to fund the NHS 2023-24 pay settlement with the remaining £0.4 billion funding pay settlements across other departments. Other policy decisions included a £1.0 billion increase to departmental capital spending in 2023-24.
3.22 Higher-than-anticipated inflation and interest rates explain £11.2 billion of the difference between our March 2023 forecast for 2023-24 expenditure and outturn. The largest contribution to this came from a £6.8 billion increase in debt interest spending (Table 3.2). Changes to RPI inflation increased the costs of index-linked gilts by £3.7 billion. Interest rates (Bank Rate and gilt rates) further increased debt interest costs by £6.5 billion. These differences were only partly offset by financing and other factors, such as a lower-than-forecast average interest payable on newly issued debt in 2023-24, resulting in debt interest spending being £6.8 billion higher than forecast overall.[21]
3.23 The impact of higher-than-anticipated inflation on other areas of spending was more limited. Departmental spending limits were fixed in nominal terms other than for the policy changes set out above. Welfare benefit rates were uprated in April 2023 but, as is normal practice, using CPI from the previous September.
| £ billion | |||
|---|---|---|---|
| Forecast | Outturn | Difference | |
| Central government debt interest, net of APF | 94.0 | 100.8 | 6.8 |
| of which: | |||
| RPI inflation | 3.7 | ||
| Bank Rate | 5.3 | ||
| Gilt rate | 1.2 | ||
| Financing and other | -3.4 | ||
| Source: ONS, OBR |
3.24 Slightly offsetting these increases, higher wage growth resulted in higher employee and employer contributions to unfunded pension schemes which reduced the net cost of these schemes in 2023-24. Set against fixed department budgets for employer contributions, this reduced overall spending by £1.5 billion relative to forecast.[22]
3.25 Lower-than-anticipated energy prices resulted in spending being £1.5 billion higher than forecast. This was due to £2.0 billion of higher spending on subsidies from the Contracts for Difference scheme (this is fiscally neutral as it is offset by higher receipts), offset by £0.5 billion lower spending on the energy bill relief scheme.
3.26 Other fiscal forecasting differences explain the remaining £9.6 billion difference between our March 2023 forecast and outturn for spending, of which £7.7 billion is from fiscally neutral changes that are offset in receipts. The major drivers of this difference were:
3.27 Public sector net debt (PSND) was 5.0 per cent of GDP lower in 2023-24 than we forecast in March 2023. This largely reflects an upwards revision to nominal GDP, which reduced debt by 4.7 per cent of GDP compared to forecast. The remainder is explained by a £7.9 billion (0.3 per cent of GDP) downwards revision to the cash level of debt. This is a small forecasting difference for the overall cash level of debt, but reflects a set of larger, but broadly offsetting, changes:
| March 2023 forecast | 2023-24 Outturn | Difference | |
|---|---|---|---|
| Per cent of GDP | 103.1 | 98.1 | -5.0 |
| of which: | |||
| Nominal GDP | -4.7 | ||
| Change in cash debt | -0.3 | ||
| £ billion | 2,702.0 | 2,694.1 | -7.9 |
| of which: | |||
| PSNB | -11.2 | ||
| Bank of England Schemes | -22.6 | ||
| Gilt premia | 20.0 | ||
| Other | 6.0 | ||
| Memo: Public sector net debt ex BoE | 2,421 | 2,453 | |
| Source: ONS, OBR |
4.1 We strive to provide transparency around our forecasts to facilitate understanding, inform policymaking, and ensure that we can be held to account for the judgements we make. Transparency requires us to scrutinise our forecasts in detail, examining and explaining the inevitable differences between those forecasts and subsequent outturns. This will help people gauge whether our forecasts are based on impartial professional judgement, rather than politically motivated wishful thinking. The process also affords an opportunity to learn lessons that can be applied to future forecasts, which we summarise in this chapter.
4.2 As discussed in Chapter 2, our March 2023 forecast was prepared during the economy’s recovery from two external shocks: the 2020 pandemic and 2022 energy crisis. As with forecasting the initial impact of the pandemic (discussed in our December 2021 Forecast evaluation report (FER)) and energy shock (discussed in our October 2023 FER), predicting how these shocks would unwind and the economy recover presented challenges. Key differences between our economy central forecast and outturn relate to the pace of the decline in inflation, resilience in real household incomes, and levels of net migration in the wake of successive shocks.
4.3 The key lessons we have learned include:
4.4 More generally, given the more volatile macroeconomic environment we have experienced in recent years, there are important lessons about the presentation of uncertainty around our central forecast. We plan to:
4.5 As discussed in Chapter 3, the main cause of our £11.2 overestimate of borrowing in 2023-24 was higher-than-anticipated inflation and earnings. The lessons set out in paragraph 4.3 should therefore also help improve our fiscal forecasts. In addition, we have significantly re-developed our forecast model for VAT to better capture changes to inflation and energy prices. Different categories of consumption, subject to different VAT rates, are now forecast separately using the splits in our economy forecast for nominal consumption. This allows for different rates of inflation across the economy to be properly captured in our VAT forecast. The forecast should therefore respond more accurately to high levels of inflation.
4.6 In addition to the differences due to inflation, Chapter 3 identifies a set of other fiscal forecasting issues. The lessons we draw from the fiscal forecast differences in 2023-24, that are now being reflected in our forecast models, include:
4.7 Beyond the specific fiscal forecast issues identified in Chapter 3 of this FER, we have made wider modelling improvements to our welfare forecast over the past year, including:
Alongside most Forecast evaluation reports we publish a model assessment database. This provides information on priorities for model development informed by forecasting issues highlighted in the FER. Given the time constraints in compiling this report, we have not published a full database this time and will instead update it alongside the next FER.
A.1 As explained in Chapter 3, the outturn data available when this report was finalised means we are not able to provide the usual breakdown of differences against the forecast categories in our EFOs. Instead, we have compared the forecast to outturn from the ONS’s expenditure categories as reported in the national accounts (PSAT). Chapter 3 explains the £27.6 billion forecast difference for spending based on the key economic and policy drivers. In this annex Table A.1 summarises the differences by PSAT category:
| £ billion | ||||||
|---|---|---|---|---|---|---|
| Forecast | Outturn | Difference, of which: | ||||
| Total | Classification changes | Policy changes | Other | |||
| Consumption and other current grants | 574.1 | 588.2 | 14.2 | 0.0 | 5.8 | 8.6 |
| Subsidies | 36.3 | 38.0 | 1.7 | -1.1 | 0.0 | 2.8 |
| Net social benefits(1) | 316.0 | 319.4 | 3.4 | 0.0 | 0.0 | 3.4 |
| Net current grants abroad | 13.5 | 14.0 | 0.6 | 0.0 | 0.0 | 0.5 |
| Interest and dividends paid | 115.7 | 121.1 | 5.3 | 0.0 | 0.0 | 5.3 |
| Public sector current expenditure | 1,055.6 | 1,080.8 | 25.2 | 0.0 | 5.8 | 19.4 |
| Public sector gross investment | 133.6 | 136.0 | 2.4 | 0.0 | 1.1 | 1.3 |
| Less depreciation | -59.9 | -65.1 | -5.2 | 0.0 | 0.0 | -5.2 |
| Public sector net investment | 73.6 | 70.9 | -2.8 | 0.0 | 1.1 | -3.9 |
| Total managed expenditure | 1,189.2 | 1,216.8 | 27.6 | 0.0 | 6.9 | 20.7 |
| 1) This includes adjustments for pension entitlements. |
| Note: Economic factors are not separated out in this table as the necessary data was not available at the time of publication. We have instead aimed to draw out these differences in the chart and text in Chapter 3. |
(1) These include income from pensions, dividends, land and property, and capital formation.
(2) This FER assesses public sector net borrowing in 2023-24. Departmental spending in 2024-25 is the subject of an OBR review that is outside the scope of this FER and is ongoing at the time of publication of this report.
(3) We have not taken on the subsequent Blue Book revisions, which were released as aggregates on 7 August 2024 but not fully incorporated into Quarterly National Accounts until 30 September 2024.
(4) We forecast RPI by adding our forecast for the wedge between CPI and RPI inflation to our CPI inflation forecast. In our March 2023 forecast we mainly overestimated the weights element of this wedge, driven by lower-than-expected energy prices which have a higher weight in RPI than in CPI.
(5) ONS, Impact of reweighting on Labour Force Survey key indicators, 2024.
(6) The population on which the reweighted LFS is based does not fully capture the recent rise in migration, so is likely to still be an underestimate. This means the latest data presented in Table 2.4 are likely to underestimate the error for the size of the labour force and the level of employment.
(7) ONS, Labour market transformation – update on progress and plans, July 2024.
(8) See Box 3.2 in our March 2024 EFO.
(9) The ONS produced this interim update in January 2023 to assist with the publication of the Spring Budget 2023. Their projections aimed to reflect the latest evidence and expert views suggesting higher-than-previously-expected net migration. This resulted in a slight upward revision of the medium-term level of net migration, based on a past 22-year average, along with a slightly higher near-term path for the first three years of the projection period.
(10) See Chapter 3: Inactivity and health of the 2023 FRS and Chapter 3: Long-term health trends of the 2024 FRS.
(11) See Box 2.2 of the October 2023 Forecast evaluation report for more detail.
(12) Household’s operating surplus is dominated by imputed rent, which is a national accounts adjustment that represents the rental income that owner occupiers would be receiving on their property if they were to rent it out. There is an offsetting effect in private consumption so it does not affect the saving rate.
(13) ONS, Understanding the latest changes to UK trade figures with the EU, March 2022.
(14) The GDP deflator covers the price of all products produced in the UK. CPI covers the price of products consumed by households.
(15) Unit taxes often have their rates increased by inflation, which can mean revenues will increase with higher inflation. However, by the time of the March 2023 forecast, rates had already been set for 2023-24 for taxes such as fuel duties, air passenger duty, and vehicle excise duties. This means revenue from these taxes were affected subsequently only by volumes consumed rather than changes in their price due to higher inflation. Alcohol duties, by contrast, had their rates set after March 2023, meaning that changes to the inflation forecast did affect receipts.
(16) Of the 2.6 per cent overshoot in nominal consumption relative to the forecast, around 1.8 per cent is a result of higher-than-anticipated inflation. The remaining 0.8 per cent represents increased real consumption.
(17) Oil and gas revenues comprise the offshore corporation tax regime, the energy profits levy, and petroleum revenue tax.
(18) NICs receipts are more closely related to the WFJ measures as NICs is levied per job worked, and employers do not need to consider pay from other employments when calculating employer NICs. Income tax is levied on an individual’s total income so is more closely related to the LFS measure.
(19) See, for example, Resolution Foundation, Measuring up? Exploring data discrepancies in the Labour Force Survey, August 2024.
(20) The earnings distribution we assume in our personal tax forecasts are explained in: Nash, A., Income tax and the earnings distribution, July 2024.
(21) This reflects the difference between the actual interest paid on newly issued debt and that implied by the gilt yield curve.
(22) At the time of publication outturn for unfunded pensions were not available, so this estimate is based on forecast changes.
(23) Nash, A., Income tax and the earnings distribution, July 2024.