"It is the duty of the Office to examine and report on the sustainability of the public finances"
Forecast evaluation report – July 2025
Our annual Forecast evaluation report (FER) examines how our forecasts compare to subsequent outturn data and identifies lessons for future forecasts.
This report focuses on the performance of our March 2019, March 2022, and March 2023 economic and fiscal forecasts for the fiscal year 2023-24 against the latest outturn data.
The Office for Budget Responsibility was created in 2010 to provide independent and authoritative analysis of the UK public finances. Twice a year – usually at the time of each Budget and Autumn or Spring Statement – we publish a set of forecasts for the economy and public finances over the coming five years in our Economic and fiscal outlook (EFO). We use these forecasts to assess the Government’s progress against its fiscal targets.
In each EFO, we stress the uncertainty that lies around all such forecasts. We compare our central forecasts to those of other forecasters. We highlight the limited confidence that should be placed in our central forecast given the scale of shocks that inevitably drive a wedge between any central predictions and subsequent outcomes. We use sensitivity and scenario analysis to show how the public finances could be affected by alternative economic outcomes. And we highlight the residual uncertainties in the public finances, even if one were confident about the path for the economy – for example, because of uncertain estimates of the cost of policy measures.
Notwithstanding these uncertainties, we believe that to ensure transparency it is important to set out our forecast in detail. It is also important to examine regularly how our forecasts compare to outturn data and to explain any discrepancies so that we can learn from our experience.
Our annual Forecast evaluation report (FER) enables us to assess how our successive forecasts for a given year compare against outturns and to reflect on the reasons for any divergence between the two. Differences between outturns and forecasts are inevitable given the inherent uncertainty around any economic and fiscal forecast. This has particularly been the case given the series of large unanticipated shocks the UK and global economy and public finances have faced in recent years. But some differences are due to factors that could have been anticipated through improved modelling techniques, looking at alternative data sources, or using different assumptions. Genuine errors, which would have been corrected before the forecast was finalised if we had spotted them, can also be a source of forecast differences, and we identify these as errors where applicable. We use our FERs to identify, understand, and learn from these differences and errors, and then to set out our plans for improving the way in which we forecast.
Having reviewed our approach to assessing the accuracy of our forecasts, this fifteenth FER represents a significant departure from previous reports. Specifically, we have revised the format and content of the report to:
evaluate the most recent fiscal year for which outturn data are comprehensively available;
regularly update the evaluation of the accuracy of OBR forecasts going back to 2010;
look not only at the accuracy of our one- and two-year ahead forecasts but also our five-year ahead forecasts;
compare the accuracy of our forecasts with those produced by other external forecasters;
discuss how our successive forecasts for the same year adjusted to shocks and developments in the interim;
provide a more focused assessment of the most challenging areas of the forecast; and
more systematically feed the lessons from the evaluation into improvements in our economic and fiscal modelling infrastructure.
In line with this new approach, this year’s FER analyses the performance of our March 2019, March 2022 and March 2023 economic and fiscal forecasts for the 2023-24 financial year. This is the same financial year that we assessed in the 2024 FER, allowing usto move to our new timetable. It will ensure that this and future evaluations are based on final or near-final outturn data, rather than on the often-revised and provisional outturn data that we used in previous FERs. This will help to ensure that this and future FERs are picking up the underlying ‘signals’ rather than ‘noise’ from these evaluations.
For this FER, economy outturn data is taken from the ONS’s first quarterly estimate data released on 13 February as used in our March 2025 forecast, which includes Blue Book 2024 revisions not incorporated in our previous FER due to time constraints following the election. For public sector receipts and expenditure, the outturn data used is from the ONS’s Public Sector Finances publication released on 20 June. When classifying forecast differences arising from economic factors, we used economic data consistent with the economy outturn data used in our March 2025 forecast, as outlined above.
In line with our Memorandum of Understanding, we provided a final copy of this report to the Treasury two working days in advance of publication.
We would be pleased to receive feedback on the new approaches taken in this FER as well as on any aspect of the content or presentation of our analysis. This can be sent to [email protected].
The Budget Responsibility Committee
Richard Hughes, Professor David Miles CBE, and Tom Josephs
Chapter 1: Executive summary
1.1Since the OBR was established in 2010, we have been committed to transparent evaluation of our performance as the government’s official economic and fiscal forecaster. The 2011 Budget Responsibility and National Audit Act requires the OBR to undertake at least once a year “an assessment of the accuracy of fiscal and economic forecasts previously prepared by it.” Over the past 15 years, the OBR has produced an annual Forecast evaluation report (FER) which evaluates how successive forecasts have compared against outturn. In our 2023 Working paper No.19:The OBR’s forecast performance, we took a more comprehensive look at the OBR’s overall forecasting record since we were established in 2010.[1]
1.2Regular transparent evaluation of our forecast performance serves a number of important purposes. First, it ensures the OBR is accountable for the accuracy of its forecasts. Second, it helps us to identify potential sources of persistent forecast difference or bias in our forecasting models, methods, or judgement and take action to address them in future forecasts. Third, it helps to illustrate the economic and fiscal impact of shocks that may arise between when our forecasts are made and when final outturn data is available, and to use this to improve our analysis of the risks and uncertainties around the forecasts. This has been especially relevant over the past five years, which have seen a series of large shocks from the Covid pandemic, the energy price spikes following the Russian invasion of Ukraine, and the rise in inflation and interest rates that followed.
1.3Having reviewed our approach to assessing the accuracy of our forecasts, this fifteenth Forecast evaluation report represents a significant departure from previous reports. Specifically, we have revised the format and content of the report to:
evaluate the most recent fiscal year for which outturn data are comprehensively available. In practice this means evaluating the forecasts for the year which is two fiscal years prior to publication date of the FER, rather than for the previous year as has been the case in previous FERs. This helps to minimise the extent to which the findings of the evaluation are contradicted by subsequent revisions to provisional outturns;
regularly update the evaluation of the accuracy of OBR forecasts going back to 2010. In this FER, to do this we have extended Working paper No.19’s analysis of GDP and borrowing forecasts by two years. This helps us understand whether there are persistent biases or inaccuracies in our forecasts, and to compare forecast performance for the latest assessed year with our historical average performance;
look not only at the accuracy of our one or two-year ahead forecasts but also our five-year ahead forecasts. This helps to abstract from some of the ‘noise’ inherent in shorter-term forecasts, elucidate possible structural biases in our medium-term economic or fiscal forecasts, and better align the time-horizon of our evaluation with the period over which the Government’s fiscal rules have been set;
compare the accuracy of our forecasts with those produced by other external forecasters. This helps to benchmark our forecasts performance against that of our contemporaries, recognising respective legal and informational constraints;
discuss how our successive forecasts for the same year adjusted to shocks and developments in the interim. This helps to improve our assessment of the risk and uncertainty around the forecasts, and to explore how effectively successive forecasts have been adjusted as we have learnt more about the nature of the shocks;
provide a more focused assessment of the most challenging areas of the forecast. The full detail of our forecast performance data will be made available online, with the FERdocument providing a more targeted summary than in the past of the most important and material issues identifiedin each exercise; and
more systematically feeds the lessons from the evaluation into improvements in our economic and fiscal modelling infrastructure. This responds to a key recommendation of our third external review regarding the need to strengthening the links between these evaluations and our model maintenance and development programme.[2]
1.4We would welcome feedback on this new approach, in particular:
whether our new approach has achieved the objectives set out above;
whether there are other objectives, forecast performance metrics, or methodologies that we should consider incorporating; and
whether there are particular special topics related to forecast performance that we should examine in future reports.
Assessing the centrality and accuracy of our forecasts
1.5The updated assessment of our forecasting record since 2010, detailed in Chapter 2, shows that the OBR’s economic and fiscal forecasts have tended to be somewhat pessimistic in the near-term and optimistic in the medium term. On average, our forecasts have underestimated annual real GDP growth at the one-year horizon by 0.4 percentage points but overestimated it by an average of 0.7 percentage points at the five-year horizon. Our short-term forecasts for government borrowing have overestimated one-year ahead borrowing by on average 0.2 per cent of GDP but underestimated five-year ahead borrowing by 3.1 per cent of GDP. The medium-term underestimate of borrowing primarily reflects both (i) the cumulative effect over five years of the average overoptimism in our forecasts for GDP and (ii) the legal requirement that we condition our spending forecast on government plans for medium-term departmental spending levels, which were subsequently significantly increased several times over this period.
1.6The OBR’s forecast performance over the past twelve years has been similar to that of other UK external forecasters, which exhibit a common pattern of near-term pessimism and medium-term optimism. The average external forecaster has underestimated one-year ahead GDP growth by 0.5 percentage points (0.1 percentage points more than the OBR) and overestimated five-year ahead GDP growth by 0.6 percentage points (0.1 percentage points less than the OBR). And the average external forecaster overestimated one-year ahead borrowing by 0.3 per cent of GDP (0.1 per cent of GDP more than the OBR) but underestimated five-year ahead borrowing by 2.9 per cent of GDP (0.2 per cent of GDP less than the OBR).
1.7The volatility of the UK and global economy has increased the uncertainty around all forecasts in recent years. Point forecasts such as those that the OBR is required to produce are highly unlikely to ever be very accurate relative to measured outturns, and the series of very large economic shocks experienced in recent years has made forecasting accurately a particular challenge over this period. Assessing forecasting performance in the context of the economic volatility and shocks seen over the relevant periods is important. For instance, the average one-year ahead GDP growth differences to outturn of around ½ a percentage point for both our and externals’ forecasts were dwarfed by the swing in GDP growth over the pandemic from -12 per cent in 2020-21 to +14 per cent in 2021-22.
1.8For this reason, in our Economic and fiscal outlooks we always place a high level of emphasis on illustrating the uncertainty surrounding the forecasts. In Chapter 2 of this FER we discuss how we present the plausible scale of uncertainty around our forecasts, including through the use of fan charts, sensitivities, and scenarios. Box 2.1 discusses how we also explore these uncertainties for individual tax and spending lines as part of the fiscal forecasting process via our interactions with government departments and through our own internal processes and procedures.
Evaluating our forecasts for 2023-24
1.9The forecasts evaluated in this report were produced for the fiscal year 2023-24 in March 2019 (five-years ahead), March 2022 (two-years ahead), and March 2023 (one-year ahead). They were therefore produced either before or in the midst of a turbulent period in the UK’s post-war economic history. The pandemic, the inflation shock following the Russian invasion of Ukraine, and the subsequent rise in global interest rates, have all had very large effects on the economy and public finances and have prompted significant fiscal and monetary policy responses.
1.10The Covid, energy, and interest rates shocks are important context for interpreting the differences between outturn and the three economy forecasts considered in this report. Over 2023-24, our forecasts two- and five-years ahead overestimated real GDP growth, driven by the impact of the shocks and subsequent very low productivity growth, but all three underestimated inflation, primarily due to the unanticipated impacts of the energy price shock. This had important implications for the forecasts of nominal GDP, a key driver of the fiscal forecast:
The March 2019 five-year forecast for cumulative nominal GDP growth over the five years to 2023-24 underestimated the outturn of 27 per cent by 8 percentage points. Cumulative real growth over this period was 4 percentage points weaker than the forecast for 8 per cent growth, largely because productivity did not pick up to historical averages in the aftermath of the large shocks outlined above. However, this was more than offset in nominal GDP by 12 percentage points higher-than-forecast economy-wide inflation, primarily driven by the energy price shock.
The March 2022 two-year forecast underestimated cumulative nominal GDP growth in the two years to 2023-24 by 5½ percentage points. This forecast overestimated cumulative real growth again but by only 1½ percentage points. Cumulative economy-wide inflation was 7 percentage points higher than forecast, again more than explaining the difference in nominal GDP growth.
The March 2023 one-year forecast underestimated nominal GDP growth by 3½ percentage points. The real GDP growth forecast was broadly in line with outturn, so the upside surprise reflected further shocks to economy-wide inflation.
1.11Our fiscal forecast performance for 2023-24 was also, in large part, a reflection of the extraordinary shocks that hit the economy in recent years and the very large policy responses to them. Public sector net borrowing in 2023-24 was £131.1 billion (4.8 per cent of GDP). Looking at the differences between outturn borrowing and each of the forecasts analysed in this report in more detail:
In the March 2019 five-year ahead forecast, made before the Covid pandemic, we expected that borrowing in 2023-24 would be £13.5 billion (0.5 per cent of GDP). This was £117.6 billion (4.2 per cent of GDP) lower than outturn. Public spending in 2023-24 was much higher than forecast in March 2019 due to higher levels of departmental spending after the pandemic and the impact of the inflation shock on debt interest and welfare spending. This was only partly offset by a boost to receipts from the larger-than-expected nominal economy, described above, and tax policy changes.
The March 2022 two-year ahead forecast for borrowing in 2023-24 was £50.2 billion (1.9 per cent of GDP), which was £80.9 billion (2.9 per cent of GDP) lower than outturn. At this point we expected the large spike in borrowing seen during the pandemic to fall back relatively quickly. However, the subsequent energy price shock led to higher and more persistent inflation than we had anticipated, which pushed up spending on debt interest and welfare, again only partially offset by the impact of higher-than-expected nominal GDP on receipts.
The March 2023 one-year ahead forecast for borrowing in 2023-24 was £131.6 billion (5.1 per cent of GDP), very close to final outturn, though within this more persistent inflation than expected led this time to broadly offsetting increases in spending and receipts.
Chart 1.1: Contributions to the changes in borrowing forecast and 2023-24 outturn
Source: ONS, OBR
1.12Breaking the fiscal forecast differences for 2023-24 down into those caused by changes in economy, policy, classification and fiscal forecast differences shows that, for the £117.6 billion (4.2 per cent of GDP) five-year forecast difference compared to our March 2019 EFO:
Changes in the economy forecast, generally the most important driver of receipts forecast performance, reduced borrowing by £9.5 billion. In particular, over this period, the larger-than-expected nominal economy, as described above, boosted income tax and National Insurance contributions (NICs) and several other receipts streams. However, this was partially offset by the impact of these economic drivers on debt interest and inflation-linked welfare spending.
There are also substantial forecast differences due to policy changes that were introduced in the period after the forecasts were published, accounting for £92.3 billion of the five-year ahead difference. The most material of these in this period were substantial increases to departmental expenditure limits (DELs) made at the September 2019 Spending Round and October 2021 Budget and Spending Review. There were also several material tax policies in this period that significantly changed receipts outturn compared to forecast, including the rise in the main rate of corporation tax, the freeze to income tax thresholds, and the introduction and then removal of the Health and Social Care Levy.
Classification changes to both receipts and spending accountfor £20.7 billion of the five-year ahead borrowing difference.
Fiscal forecast differences, explain £14.1 billion of the five-year forecast difference for borrowing. These differences are those remaining that cannot be explained by the other categories and are a particularly important part of the analysis in this FER. On spending, substantial and persistent fiscal forecast differences have been identified in this report for local authority borrowing and national accounts adjustments. For receipts this was most notable for income tax and NICs and onshore corporation tax, differences which have narrowed at recent forecasts. The analysis of these differences is particularly important for identifying potential areas of inaccuracy and bias within the fiscal forecast and so informing future fiscal forecast modelling priorities.
Lessons learned
1.13Over the five-year period leading up to 2023-24 the economy was buffeted by three large shocks, which had very large effects on fiscal deficits and therefore the stock of debt. By definition, economic shocks are events that will not be reflected in contemporaneous central point forecasts of the economic and fiscal outturns. So, while it is important for us to systematically analyse and explain differences to outturn, it is also the case that we should not seek to judge our forecast performance by solely looking how our forecasts compared to outturn. Alongside this, we will continue to develop our analysis and communication of risk and uncertainty alongside the forecast.
1.14Other lessons learned from the analysis in this report have also helped us to identify the following priorities for refining our forecast methodologies and modelling approaches over the coming year which are outlined in Chapter 4 of this report:
Our new economic forecast development priorities: we are currently conducting our regular summer supply stocktake, which involves research into our potential output forecast and its components. In addition, for the first time we have published a new online database alongside this report which sets out our modelling development priorities. New key priorities since our previous FER include working with the relevant departments to expand our ability to undertake analysis of developments in global trade and trade policy. We intend to refine how we construct and decompose our housing supply forecast, in light of the large increase in housing supply that we expect to occur in response to the Government’s planning reforms. We will also report on the progress of ongoing workstreams such as the implementation of our new overlapping generations model to analyse demographic changes; and on the drivers of inflation, an important theme in our model development given the experience of recent years. Finally, over the coming years we will take forward the external review recommendation to more transparently set out our macroeconomic modelling infrastructure and approaches.
Our new fiscal forecast development priorities have been informed by the analysis of differences between our forecast and outturn that cannot be explained by the economy or policy and classification decisions. On spending, the priorities are the persistent differences between the local authority and national accounts adjustments forecasts and outturns across all three of the forecasts considered in this report. The analysis also underscores our commitment to implementing the recommendations of the DEL review given the importance of this source of forecast difference. Our new approach has highlighted new areas of focus for development among several of the smaller receipts lines in our fiscal forecast. Finally, we intend to improve elements of our income, corporation, and inheritance tax forecasts as well as aspects of the welfare spending forecasts.
Chapter 2: Assessing forecast performance and uncertainty
Introduction
2.1 This chapter explains how we evaluate the performance of our forecasts and analyse the uncertainty around them. It sets out how we assess the centrality and accuracy of our forecasts and explains some changes of approach that we are implementing in this and future Forecast evaluation reports(FERs). It also provides an update to analysis published in Working paper No.19: The OBR’s forecast performance,[3] which provided a full assessment of the OBR’s forecasting record since 2010. These evaluations and the lessons drawn from them provide an important input into improving our forecast performance in future.
2.2 Another reason for analysing differences between forecast and outturn is to improve our understanding of the uncertainties around our central forecasts. Explaining these uncertainties is an important part of the transparency we provide around our forecasts, and we have a legal obligation to explain the main risks to the economic and fiscal outlook. In this chapter, we therefore also summarise the main approaches we use to assess the risk and uncertainties around our forecasts.
2.3 Point forecasts, such as those that the OBR is required to produce, are highly unlikely to ever be fully accurate and the series of very large economic shocks experienced in recent years has made forecasting accurately a particular challenge over this period. The OBR’s forecast accuracy can also be affected by the legal requirement on us to condition forecasts on stated government policy and to produce forecasts when the Government requests them rather than when the latest data is available.
2.4 It is nevertheless important that we are fully transparent in disclosing, explaining, and understanding the differences between our forecasts and outturn, and that we learn lessons from these exercises so we can improve our forecasting methods. This is particularly the case where differences between forecasts and outturn do not only reflect the effects of large external shocks or changes to government policies, but also the models, assumptions, or judgements that underpin our economic or fiscal forecasts.
Measuring the centrality and accuracy of our forecasts
2.5 We use the averageand average absolutedifferences between outturn data and forecast for a given variable to provide measures of, respectively, the centrality and accuracy of our forecasts for that variable.[4] In more detail:
The average forecast difference measures how close the central point forecast is to outturn, taking into account whether the difference is positive or negative, and is therefore a summary measure of how central or unbiased the forecasts are.
The average absolute forecast difference is calculated by taking the average of the absolute values of differences between outturns and the central (point) forecasts, ignoring whether the differences are positive or negative.[5] This indicates the absolute size of forecast differences and therefore is a measure of how accurate the forecasts are.
2.6 It is also informative to compare our forecast performance to the average of contemporaneous external forecasts. This can be particularly useful during periods of unusual shocks and uncertainty, as we have experienced in recent years, allowing us to assess whether the OBR made more or less accurate predictions than other forecasters with similar information available at the time. It is important to note that these comparisons to the performance of contemporaneous external forecasters are not completely like-for-like, for the following reasons:
forecasts will vary simply due to the timing of their release through the year as they incorporate new information and outturn data. OBR forecasts are typically published alongside fiscal events – the timing of which is decided by the Chancellor. The requirement to produce a forecast which includes new policy announcements also means that the pre-measures forecast is typically finalised some weeks ahead of release, meaning we are not always able to incorporate the most timely news and data;[6]
the OBR is required to condition forecasts on announced government policy. Other forecasters are free to anticipate future policy changes, which can make their forecasts a better predictor of future outturns; and
the OBR sometimes has access to some confidential information, such as pre-release access to ONS data and aggregated administrative in-year tax and spending data, that external forecasters do not.
2.7 The OBR has now produced forecasts for fifteen years, meaning we now have a reasonably long forecasting track record that we can assess. We also recently underwent the third of the five-yearly external reviews that are required under the OBR’s founding legislation, which made recommendations on our approach to presenting uncertainty and on forecast model development.[7] On the basis of these developments we have reviewed our approach to assessing forecast performance and in this FER have introduced the following changes compared to previous reports:
the evaluation now focuses on the latest year for which near-final outturn data is available. This helps to minimise the risk that the findings of the evaluation are later contradicted by subsequent revisions to provisional outturns;
we will now look at the accuracy of our one-year, two-year and five-year ahead forecasts, rather than the previous focus on the one-year ahead forecast. This helps to abstract from the ‘noise’ inherent in shorter-term forecasts and elucidate possible structural biases in our medium-term economic or fiscal forecasts;
we will include more comparisons of the accuracy of our forecasts with those produced by other external forecasters. This helps to benchmark our forecasts performance against that of our contemporaries. The Congressional Budget Office in the US adopts a similar methodology, assessing its performance against both its own historical averages and the average of external forecasts;[8] and
we will more systematically feed the lessons from the FERinto improvements in our economic and fiscal modelling infrastructure. To support this, published alongside this FERfor the first time is an online annex which contains more detailed information about the economy and fiscal forecast differences that we assess in FERs.[9] This will be published on our website and updated each year to allow us to more systematically track, assess, and learn from the performance of our forecasts over time.
2.8 In the next section, we provide an updated analysis of the OBR’s overall forecasting record since 2010 which provides the basis for the new historical and relative comparisons used in Chapter 3 of this FER.
The centrality and accuracy of our forecasts
2.9 This section assesses the centrality and accuracy of all the OBR’s forecasts for real GDP growth, inflation, and public sector net borrowing (PSNB) since 2010 by updating the analysis in the August 2023 Working Paper No. 19. Alongside this, in the new online annex, we provide more detailed breakdowns of our average forecasting differences across a wider range of variables, as well as comparisons with external forecasters. The annex also explains in detail the methodology we have used to calculate these numbers.
Real GDP growth
2.10 On average, OBR central (point) forecasts have underestimated annual real GDP growth at the one-year horizon (by 0.4 percentage points) and overestimated it at longer horizons, by an average of 0.3 and 0.7 percentage points at the two- and five-year horizons, respectively (top row in Table 2.1). External forecasters, on average, have also underestimated GDP growth at the one-year horizon (by 0.5 percentage points) and also overestimated it at the five-year horizon, albeit by a slightly smaller margin of 0.6 percentage points.
2.11 On a cumulative basis, we have overestimated five-year cumulative real GDP growth, on average, by 2.2 percentage points, with all but two of our cumulative five-year GDP forecasts exceeding eventual outturn. The median external forecaster also overestimated five-year cumulative real GDP growth by 3.4 percentage points on average.[10] Our average 0.7 percentage point overoptimism on five-year ahead medium-term GDP growth rates – which is slightly higher than external forecasters’ – in large part reflects our persistent overestimate of the post-financial crisis recovery in productivity in the early 2010s. We responded to this by revising down our expectation for medium-term GDP growth in 2017 by around 0.5 percentage points relative to the initial OBR assumption.
2.12 The OBR’s average absolute forecast difference for real GDP growth, a measure of overall forecast accuracy, is in line with the external average at the one- and two-year horizons but larger at the five-year horizon, driven by the more optimistic medium-term assumptions explained above (second row in Table 2.1). As explored in our 2023 working paper, the OBR’s (and external forecasters’) forecasting differences for real GDP growth are small relative to the significant variation in outturn during the period covered.[11]
Table 2.1: Average forecast differences: Real GDP growth
Annual growth
Five-year cumulative growth
One-year ahead
Two-year ahead
Five-year ahead
OBR
External average
OBR
External average
OBR
External average
OBR
External average
Median forecast difference
0.4
0.5
-0.3
-0.1
-0.7
-0.6
-2.2
-3.4
Median absolute forecast difference
0.6
0.6
0.4
0.4
1.1
0.8
2.2
3.7
Note: Numbers show percentage point differences calculated by subtracting the forecast from outturn. All figures are in calendar years. External averages use the median values of external forecasts compiled by HM Treasury. Five-year ahead and five-year cumulative external forecast averages are based on spring forecasts only while the OBR averages always include both spring and autumn forecasts.
Source: HM Treasury, ONS, OBR
One-year ahead forecasts
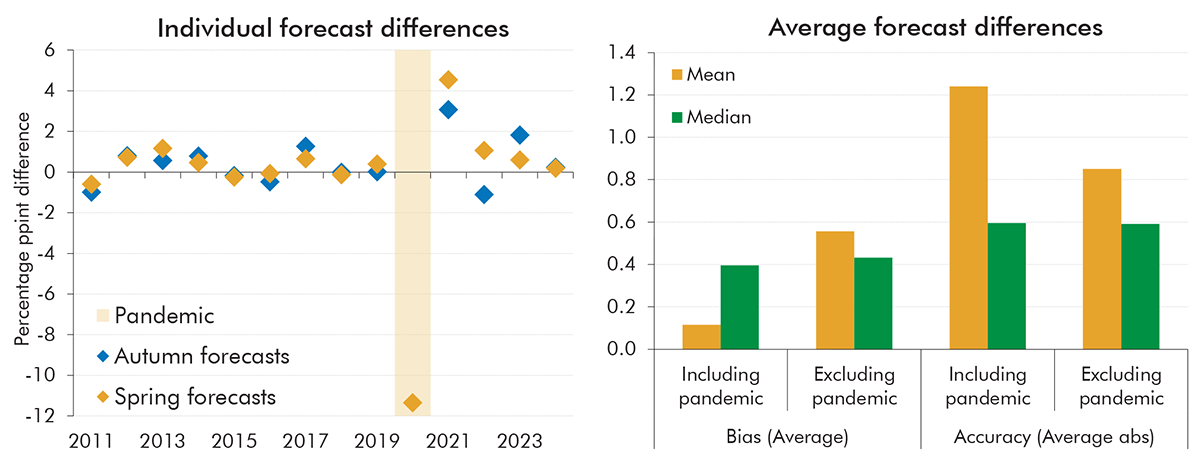
2.13 Looking further into our near-term forecasts (left panel of Chart 2.1), the largest one-year ahead forecast differences (in absolute terms) since 2010 unsurprisingly relate to the Covid pandemic. Our March 2020 forecast was produced before lockdown started and did not incorporate any significant impacts from the pandemic, and, as a result, overestimated GDP growth in 2020 by 11.4 percentage points. Estimates of the expected impact of the pandemic were included in the subsequent November 2020 and March 2021 forecasts, but there was still at those points significant uncertainty around the duration of restrictions on activity and their impact on the economy, meaning these forecasts underestimated the pace of recovery in 2021.
2.14 The right panel of Chart 2.1 shows the average forecast differences for the forecasts in the left panel based on mean and median measures. The mean forecast difference (the measure of bias) was 0.1 percentage points including the pandemic and 0.6 percentage points excluding the pandemic. The median forecast difference was 0.4 percentage points both including and excluding the pandemic. The mean absolute forecast difference (the measure of accuracy) was 1.2 percentage points (0.9 percentage points excluding the pandemic) and the median was 0.6 percentage points. In this report we focus on the median forecast differences as they are less skewed by outliers, but in our online annex we report both mean and median figures for completeness.[12]
Chart 2.1: One-year ahead OBR forecasts for annual GDP growth
Note: Forecast differences are calculated by subtracting the forecast from outturn. The years correspond to the calendar years for the one-year ahead forecasts. The spring forecasts are produced in the spring of the same year while the autumn forecasts are produced in the autumn of the previous year. Averages excluding the pandemic only exclude the 2020 forecast difference (the March 2020 forecast). The restated March 2019 forecast published in December 2019 is not included. Bias measures the average forecast difference whereas accuracy measures the average absolute forecast difference.
Source: ONS, OBR
Five-year ahead forecasts
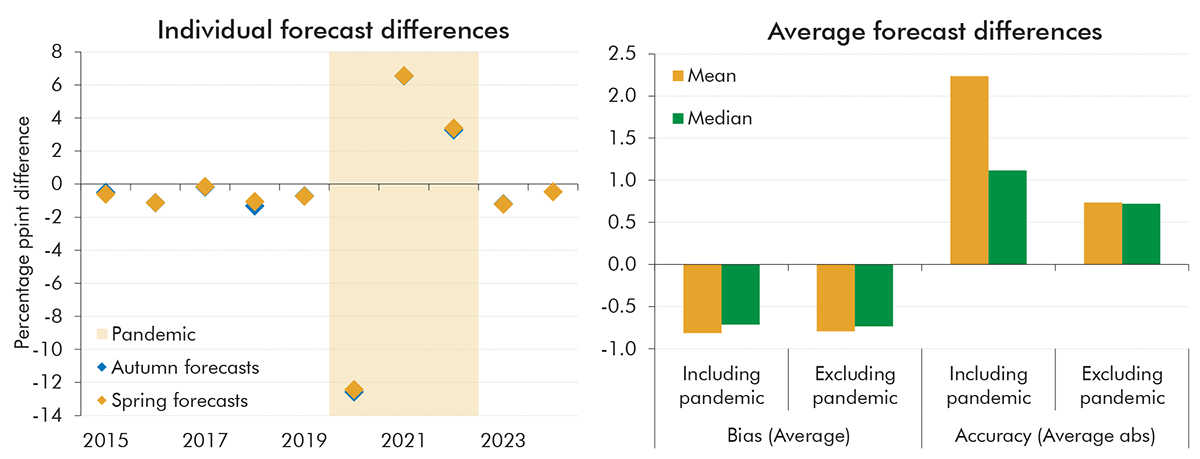
2.15 Turning to the medium-term forecasts, the left panel of Chart 2.2 shows that the largest forecast differences for real GDP growth (in absolute terms) since 2010 were again driven by the pandemic years. Neither the substantial fall in output in 2020 nor the subsequent recovery in 2021 and 2022 was foreseen five years ahead (in the forecasts made between the autumn of 2015 and the spring of 2018).
2.16 The right-panel of Chart 2.2 shows that the mean and median forecast difference (the measures of bias) were negative 0.8 and negative 0.7 percentage points, respectively. The only times where we underestimated five-year ahead GDP growth was in the forecasts for 2021 and 2022, where growth was strong due to the recovery from the pandemic. Excluding the pandemic makes no significant difference to average forecast differences (the measure of bias) as the positive and negative forecast differences broadly offset each other. Excluding the pandemic does make a difference to the mean absolute forecast difference (the measure of accuracy) which is 2.2 percentage points including the pandemic shock but only 0.7 percentage points excluding it. Similarly to the one-year ahead forecasts, the median absolute forecast difference is less affected by the pandemic shock and is 1.1 percentage points including the pandemic years and 0.7 percentage points excluding it.
Chart 2.2: Five-year ahead OBR forecasts for annual GDP growth
Note: Forecast difference is calculated by subtracting the forecast from outturn. The years correspond to the calendar years for the five-year ahead forecasts. The spring forecasts are produced in the spring five years before while the autumn forecasts are produced in the autumn six years before. Averages excluding the pandemic exclude 2020, 2021 and 2022 as these years correspond to the five-year ahead forecasts made between the autumn of 2015 and the spring of 2018, none of which could have accounted for the pandemic. The restated March 2019 forecast published in December 2019 is not included. Bias measures the average forecast difference whereas accuracy measures the average absolute forecast difference.
Source: ONS, OBR
CPI inflation
2.17 Table 2.2 shows that one-year ahead OBR forecasts for CPI inflation have, on average, been in-line with outturn, while two- and five-year ahead forecasts have, underestimated inflation by 0.3 and 0.5 percentage points, respectively. External forecasters have, on average, tended to overestimate inflation at the one- and two-year horizon and to underestimate it at the five-year horizon to a similar extent as the OBR forecasts. Our forecasts are, on average, similarly accurate to external forecasts at the one- and two-year horizons (as measured by the median absolute forecast difference) but are less accurate at the five-year horizon. This difference in accuracy at the five-year horizon stems from our medium-term assumption for CPI inflation converging back to the Bank of England’s 2 per cent target.
Table 2.2: Average forecast differences: annual CPI inflation
One-year ahead
Two-year ahead
Five-year ahead
OBR
External average
OBR
External average
OBR
External average
Median forecast difference
0.0
-0.1
0.3
-0.2
0.5
0.4
Median absolute forecast difference
0.3
0.3
0.9
0.9
1.1
0.9
Note: Numbers show percentage point differences calculated by subtracting the forecast from outturn, for a given calendar year. External averages use the median values of external forecasts compiled by HM Treasury. Five-year ahead external forecast average is based on spring forecasts only while the OBR averages always include both spring and autumn forecasts.
Source: HM Treasury, ONS, OBR
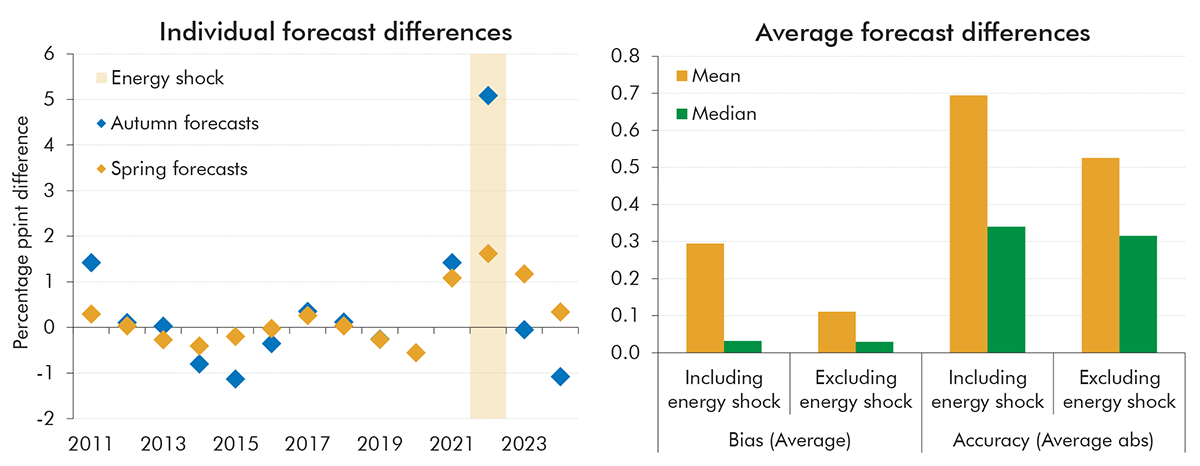
2.18 The left panel of Chart 2.3 shows that our one-year ahead forecast mostly overestimated CPI inflation in the 2010s, when inflation was low, and mostly underestimated it in the 2020s when inflation picked up. The biggest differences were driven by the inflation shock following the Russian invasion of Ukraine in 2022.[13] The mean forecast difference (the measure of bias) was 0.3 percentage points including all forecasts and 0.1 percentage points excluding the October 2021 forecast, which did not foresee the Russian invasion of Ukraine and subsequent inflation shock (right panel of Chart 2.3). The median forecast difference is close to zero and is not affected by excluding the outlier associated with the unexpected Russian invasion. The mean absolute forecast difference (the measure of accuracy) is 0.7 percentage points (0.5 percentage points excluding October 2021) and median absolute forecast difference is 0.3 percentage points.
Chart 2.3: One-year ahead OBR forecasts for CPI inflation
Note: Forecast difference is calculated by subtracting the forecast from outturn. The years correspond to the calendar years for the one-year ahead forecasts. The spring forecasts are produced in the spring of the same year while the autumn forecasts are produced in the autumn of the previous year. Averages excluding the energy shock only exclude the October 2021 forecast for 2022. The restated March 2019 forecast published in December 2019 is not included. Bias measures the average forecast difference whereas accuracy measures the average absolute forecast difference.
Source: OBR
Public sector net borrowing
2.19 On average, the OBR has tended to slightly overestimate borrowing in one-year ahead forecasts but then underestimate borrowing at the two-year and five-year ahead horizons. For these forecasts the OBR assumes that government spending over the five-year period coincides with its latest plans. External forecaster performance is similar to the OBR’s but, on average, more inaccurate in the near-term and more accurate for five-year ahead forecasts.[14] These averages include the very significant unexpected increases in borrowing due to the pandemic and inflation shock following the Russian invasion of Ukraine (Table 2.2) which led to historic increases in borrowing.
2.20 The larger medium-term differences for borrowing as a share of GDP reflect two main factors that were highlighted in the 2023 Working Paper No.19. The cumulative effect over five years of the average overoptimism in our forecasts for real GDP growth, discussed above accounts for some of the lower forecast for borrowing than the outturns. Further, and as noted above, we condition our forecasts on government plans for medium-term departmental spending levels which have, in practice, been subsequently increased significantly on several occasions over this period.
2.21 Public sector borrowing is the difference between two very large numbers – public sector spending minus receipts which each currently amount to over £1 trillion. This means relatively small percentage differences in the outturn for either spending or receipts compared to forecast can lead to large percentage differences in the borrowing forecast. Analysis in the 2023 Working Paper No.19 showed that the absolute forecast differences for the receipts and spending forecast are smaller than for borrowing.
Table 2.3: Average forecast differences: annual PSNB as a share of GDP
One-year ahead
Two-year ahead
Five-year ahead
OBR
External average
OBR
External average
OBR
External average
Median forecast difference
-0.2
-0.3
0.5
0.3
3.1
2.9
Median absolute forecast difference
0.4
0.6
0.6
0.6
3.1
2.9
Note: Numbers show percentage point differences calculated by subtracting the forecast from outturn for a given fiscal year. External averages use the median values of external forecasts compiled by HM Treasury. Public sector net borrowing has been adjusted for classification changes between the original forecast and the latest outturn. Five-year ahead external forecast average is based on spring forecasts only while the OBR averages always include both spring and autumn forecasts.
Source: HM Treasury, ONS, OBR
Approach to analysing the uncertainty around forecasts
2.22 In addition to improving our overall forecast performance through the actions outlined in this and previous FERs, part of the reason for analysing the divergences between outturn and forecasts is to improve our understanding and explanation of the uncertainties around our central forecasts. Assessing and communicating these uncertainties is a central feature of the OBR’s approach to delivering against its legal obligation to explain the main risks to the economic and fiscal outlook. We examine medium-term risks extensively in the Economic and fiscal outlook (EFO) document which accompanies each forecast. We also produce an annual Fiscal risks and sustainability (FRS) report which provides an in-depth assessment of longer-term risks to the public finances. The analysis in this FER of where there may be historic bias and inaccuracy within individual forecast areas will also help us in highlighting particular uncertainties in our forecasts.
2.23 In the EFOs, we analyse and present medium-term risks and uncertainties in several ways:
We use fan charts to illustrate the probability of different outcomes around key forecast variables, based on the distribution of historical shocks and forecast differences.
Our sensitivity analysis illustrates what would need to happen to key forecast parameters and judgements to reduce the headroom against the Government’s fiscal targets to zero (a ‘test to failure’ or ‘reverse stress test’).
We make extensive use of alternative scenarios around our central forecast. More recent EFOs looked at the impact on our forecasts of alternative paths for productivity, migration, interest rates, and global trade policy. A lesson from the 2024 FER was that we should consider more extreme assumptions to make sure we capture a wider range of possible outcomes.
We also explore and use other ways of communicating uncertainty such as drawing on examples from economic history, making greater use of fiscal ready reckoners to conduct analysis of the sensitivity of the fiscal forecasts to changes in the economy, and illustrating the impact on the forecast of volatility in market expectations for key parameters such as interest rates and energy prices.
2.24 The uncertainties we capture using these techniques can arise exogenously, for example due to unforeseen macroeconomic shocks, or endogenously due to changes in government policy. However, there are also uncertainties inherent in the myriads of judgements and modelling approaches we use to produce the individual tax and spending forecasts that are collated to produce our overall fiscal forecast. Box 2.1 sets out in more detail how we take account of these types of risks and uncertainty in the preparation of our fiscal forecasts.
Box 2.1: Consideration of uncertainty in OBR fiscal forecasts
In each Economic and fiscal outlook (EFO) we consider the risks and uncertainties around the forecasts of key fiscal aggregates – such as borrowing and debt – through the use, as set out above, of fan charts, alternative scenarios, sensitivity analysis, and specific risk assessment sections. This often builds on analysis produced for the economy forecast and explains how aggregate level macroeconomic risks could affect the overall fiscal forecast. In addition, the forecasts of the fiscal aggregates are built up through forecasts produced by government departments for all the individual elements of tax and spending. We engage continuously with these departments to understand the uncertainties in their forecasts that are not related to those that we consider at the aggregate level. Throughout the forecast process we use several approaches, in conjunction with departments, to understand these uncertainties:
Challenge meetings are held for most tax and spending forecasts at least once during a forecast process, where departmental analysts present their central forecasts and the key uncertainties and risks around these for the OBR to scrutinise. We take a proportional approach to assessing these risks based on the complexity and size of the individual forecast components.
Model returns are often compared against ready reckoner tools to test the sensitivity of a forecast to key economic assumptions. Where there are material deviations from what we would expect given economic changes, we will highlight and explain the reasons disaggregated into individual fiscal forecast factors.
Sensitivity analysis is presented around some individual tax and spend forecasts to explain the impact of material fiscal forecast judgements. Examples of this have included the impact different electric vehicle uptake assumptions on the transport taxes forecasts and different scenarios for the underspend assumption within the departmental expenditure limits (DELs) forecast.
We work closely with departments on in-year monitoring of tax and spend data to track the performance of our forecast against latest outturn data, based on our published monthly profiles. We hold regular meetings throughout the year to understand if differences are temporary or structural and the uncertainty that these differences may create for individual forecast areas at our next forecast. We also use tools such as the FER to analyse overall differences from outturn.
We also with work with departments to make further assessments of risk and uncertainty when we incorporate the fiscal impact of new policy announcements into the forecast:
Costing notes written by the responsible departments provide a detailed analysis and assessment of the fiscal impact of each new policy and contain a section on the key assumptions and uncertainties, maintaining a proportional approach to the size and complexity of the policy. Departmental analysts will also often provide sensitivity analysis of key assumptions and the impact of alternative assumptions.
Based on costing notes and engagement with departments we assign an uncertainty rating to all policy costings supplied to us following the costings engagement outlined above.a We assign uncertainty rankings for each of three components of the costing – data, behaviour and modelling – highlighting the largest concern of these three components and assigning an overall uncertainty rating. In the EFO we specifically highlight the measures that we have deemed to have an overall ‘high’ or ‘very high’ uncertainty rating.
a) See our policy costings uncertainty ratings database for a measure-by-measure breakdown of uncertainty ratings for all policy costings since December 2014.
Chapter 3: Evaluating forecasts for 2023-24
Introduction
3.1 This chapter analyses the performance of the economy and fiscal forecasts for financial year 2023-24 that were made one (March 2023), two (March 2022) and five years (March 2019) ahead. We also compare the OBR’s forecast performance with that of external forecasters. A new online annex accompanying this report contains more detailed forecast comparisons for a wider set of economic and fiscal variables.
3.2 As set out in the Foreword, this report again assesses 2023-24 (as in the 2024 report) to allow us to move the Forecast evaluation reports (FERs) to a new timetable that ensures this and future evaluations are based on final or near-final outturn data, rather than on the often-revised, provisional outturn data that has been used in previous FERs. In this report, economy outturn data is from the ONS’s first quarterly estimate data released on 13 February, as used in our March 2025 economic forecast (this therefore incorporates the ONS 2024 Blue Book consistent National Accounts data that was released on 30 September 2024). Fiscal outturn data is taken from the ONS’s 20 June Public Sector Finances release.[15]
The context for forecasts of 2023-24
3.3 The forecasts evaluated in this report were made in 2019, 2022, and 2023 for the fiscal year 2023-24. As such they were conducted prior to, and then during, a particularly turbulent period in the UK’s post-war economic history, due to:
the Covid pandemic, which began in 2020 and precipitated the largest peacetime contraction in GDP;
the Russian invasion of Ukraine and subsequent energy crisis, which pushed inflation up to its highest level in over four decades in 2022; and
rising global interest rates, which reached their highest level in over 15 years in 2023 in the UK.
3.4 These unexpected shocks explain a large portion of the short- and medium-term differences between forecasts and final and near-final outturn for 2023-24. While shocks such as these are impossible to foresee, there are nevertheless important lessons that can be learnt from analysing how they caused subsequent outcomes to diverge from central forecasts. This helps understand how the economy responds to shocks, the impact that such shocks have on the public finances, and on how to calibrate and present risks around future forecasts. Further, as this chapter sets out, there are a set of forecast differences for 2023-24 that do not relate directly to these shocks but are due to issues relating to wider forecast judgements and modelling approaches, that we will aim to address in our forecast development programme.[16]
Economy forecast
3.5 This section evaluates the performance of our economic forecasts for 2023-24. The 2024 FER, which, as set out above, also assessed 2023-24,focused on the impact on the forecast of the inflation shock following the Russian invasion of Ukraine and also assessed the performance of the scenarios we used to illustrate the risks from inflation in the 2023 forecast. In this FER, we revisit this analysis based on the latest outturn data and also examine how forecast differences for this year compare to our average forecast performance since 2010 and to forecasts made by external analysts.
Conditioning assumptions
3.6 We condition our forecast on market expectations of interest rates and energy prices. Actual interest rates in 2023-24 were significantly higher than the expectations we used (Chart 3.1 and Table 3.1). This was, in large part, the result of the monetary policy response to the significant inflation shock in 2022 following the Russian invasion of Ukraine. Energy prices were a large contributor to this inflation shock, with oil prices nearly 30 per cent higher in 2023-24 than forecast in 2019.[17] Oil prices remained elevated over 2023-24 though this was broadly in line with our March 2022 and 2023 forecasts – only 0.4 per cent higher and 3.6 per cent lower respectively.
Chart 3.1: Bank rate and oil prices
Note: The shaded area marks 2023-24.
Source: Bank of England, Datastream, OBR
Table 3.1: Bank rate and oil prices
Bank rate (per cent)
Oil prices ($ per barrel)
One-year ahead
Two-year ahead
Five-year ahead
One-year ahead
Two-year ahead
Five-year ahead
Outturn in 2023-24
5.0
5.0
5.0
82.2
82.2
82.2
Forecast
4.1
1.8
1.1
79.4
81.8
64.8
Difference
0.9
3.2
3.9
2.8
0.4
17.4
Difference (per cent)
3.6
0.4
26.8
Source: Bank of England, Datastream, OBR
Real GDP
3.7 Our real GDP growth forecasts for 2023-24 two-years and five-years ahead were less accurate than our past average forecast performance due to the impact of the large Covid and inflation shocks. However, the overall pattern set out in Chapter 2 for the centrality of our forecast differences since 2010 – on average underestimating short-term GDP growth and overestimating medium term growth – occurred again over this period (Chart 3.2 and Table 3.2). Looking at successive forecasts we made:
As the March 2019 five-year ahead forecast for 2023-24 did not anticipate the impact of the Covid or inflation shocks, cumulative real growth over the five-year period was 3.8 per cent lower than forecast (Table 3.2), and 1.6 percentage points greater than our average five-year ahead overshoot. Chart 3.2 shows that the level of real GDP in 2023-24 was around 3 per cent lower than our March 2019 forecast.
The March 2022 two-year ahead forecast included the expectation that there would be a short duration spike in inflation following the Russian invasion of Ukraine, which had begun the previous month. However, inflation turned out to be higher and more persistent than we expected and so, together with higher interest rates, weighed more heavily on growth than expected. Real GDP grew by just 0.3 per cent in 2023-24, 1.6 percentage points lower than forecast, with quarterly growth declining particularly markedly over the second half of the year as incomes did not keep pace with higher prices, eroding real consumer purchasing power.
The March 2023 one-year ahead forecast for growth in real GDP over 2023-24 was broadly in line with outturn, with a forecast difference of only 0.1 percentage points (this is somewhat below the average one-year ahead forecast difference of 0.4 percentage points shown in Chapter 2). However, the profile of growth over 2023-24 (Chart 3.2) differed from expectations, with higher prices taking longer to constrain real growth than expected. Despite only a small difference in our growth forecast in 2023-24, Chart 3.2 shows that our forecast underestimated the level of real GDP by around 3 per cent, mostly due to ONS revisions to the post-pandemic recovery prior to 2023-24.
Chart 3.2: Quarterly real GDP level
Note: The shaded area marks 2023-24.
Source: ONS, OBR
Table 3.2: Real GDP growth
One-year ahead
Two-year ahead
Five-year ahead
Annual growth in 2023-24 (per cent)
Outturn
0.3
0.3
0.3
Forecast
0.2
1.9
1.6
Difference (percentage point)
0.1
-1.6
-1.3
Cumulative growth to 2023-24 (per cent)
Outturn
0.3
2.6
3.9
Forecast
0.2
4.1
7.7
Difference (percentage point)
0.1
-1.5
-3.8
Source: ONS, OBR
Inflation
3.8 Chapter 2 showed that on average our forecasts have tended to underestimate inflation, particularly beyond the one-year horizon at which we employ our detailed short-term inflation forecast model. All three of the forecasts considered here significantly underestimated inflation in 2023-24, though the forecasts made after the pandemic and Russian invasion of Ukraine were more accurate (Chart 3.3 and Table 3.3):
The March 2019 five-year ahead forecast was made when CPI inflation was just under the 2 per cent target, and was based on our standard assumption that the Bank of England will act to keep inflation close to target in the medium term. However, in practice the inflation shock following the pandemic and the Russian invasion of Ukraine resulted in a significant deviation from this forecast in 2023-24 (left panel, Chart 3.3). In 2019, we forecast that prices would rise cumulatively by around 10 per cent over the subsequent five years (an average of 2 per cent each year), but prices actually rose by nearly 25 per cent over this period (right panel, Chart 3.3).
The March 2022 two-year ahead forecast underestimated both the peak and persistence of inflation following the spike in energy prices in 2022. Inflation in 2023-24 was 5.7 per cent, which was 3.3 percentage points above forecast. Inflation did fall over this year temporarily reaching the 2 per cent target in May 2024, broadly in line with our expectation that the spike would be in large part transitory, but this was nearly a year later than we had forecast in March 2022. Box 2.1 of our October 2023 FER explored the reasons why the knock-on effects of higher energy prices on CPI inflation might have been higher than we originally assumed, while Chapter 4 of that report described how in response we have expanded the statistical and econometric equations used to inform our short-term inflation forecast and reviewed the models used to inform the forecasts for tradables inflation and wage growth.
The March 2023 one-year forecast also underestimated the persistence of inflationary pressures, though to a less significant degree. Inflation in 2023-24 was 1.5 percentage points higher than forecast, driven by the increased pass-through of previous energy price rises into the components of inflation as well as higher-than-expected nominal earnings boosting domestic inflation.
Chart 3.3: CPI inflation rate and level
Note: The shaded area marks 2023-24.
Source: ONS, OBR
Table 3.3: CPI inflation
One-year ahead
Two-year ahead
Five-year ahead
Annual growth in 2023-24 (per cent)
Outturn
5.7
5.7
5.7
Forecast
4.1
2.4
2.0
Difference (percentage point)
1.5
3.3
3.7
Cumulative growth to 2023-24 (per cent)
Outturn
5.7
16.3
23.7
Forecast
4.1
10.6
10.3
Difference (percentage point)
1.5
5.7
13.4
Source: ONS, OBR
Labour market
3.9 Our forecasts for the employment rate in 2023-24 were subject to particular uncertainty after earlier forecasts missed the rapid fall and partial recovery in employment in the wake of the pandemic. The two-year and five-year ahead forecasts both overestimated the rate by just 0.4 percentage points, which are below the relevant historical average absolute forecast differences (0.9 and 1.4 percentage points respectively). Our March 2023 one-year ahead forecast underestimated the employment rate by a very small margin, likely due to overestimating the shock to real economic activity as a result of higher inflation and interest rates. During this period, the UK labour market saw record levels of net migration that increased the population and number of people in employment, rising inactivity levels particularly among those with health problems, and increased uncertainty about the quality of the statistics in the ONS Labour Force Survey. All these factors contributed to a particularly uncertain outlook.
Chart 3.4: Employment rate
Note: The shaded area marks 2023-24.
Source: ONS, OBR
3.10 Our forecasts for nominal earnings in 2023-24 underestimated the pace of growth over 2023-24 by between 2.8 and 4.5 percentage points, reflecting elevated inflation and tighter labour market conditions. We also underestimated growth in real earnings by between 0.9 and 1.7 percentage points. The stronger-than-expected outturn for real earnings growth reflects a lag between high inflation in 2022 and pass-through into higher-than-anticipated nominal pay growth, which, coupled with falling inflation (albeit from an elevated level) amid a tight labour market, meant real earnings grew by 1.6 per cent in 2023-24.
Table 3.4: Nominal and real earnings growth
Nominal earnings
Real earnings
One-year ahead
Two-year ahead
Five-year ahead
One-year ahead
Two-year ahead
Five-year ahead
Annual growth in 2023-24 (per cent)
Outturn
6.9
6.9
6.9
1.6
1.6
1.6
Forecast
4.1
2.4
3.3
0.7
-0.1
1.3
Difference (percentage point)
2.8
4.5
3.6
0.9
1.7
0.3
Cumulative growth to 2023-24 (per cent)
Outturn
6.9
13.8
23.4
1.6
-1.0
1.7
Forecast
4.1
7.7
16.6
0.7
-1.2
5.6
Difference (percentage point)
2.8
6.1
6.8
0.9
0.2
-3.9
Source: ONS, OBR
Nominal GDP
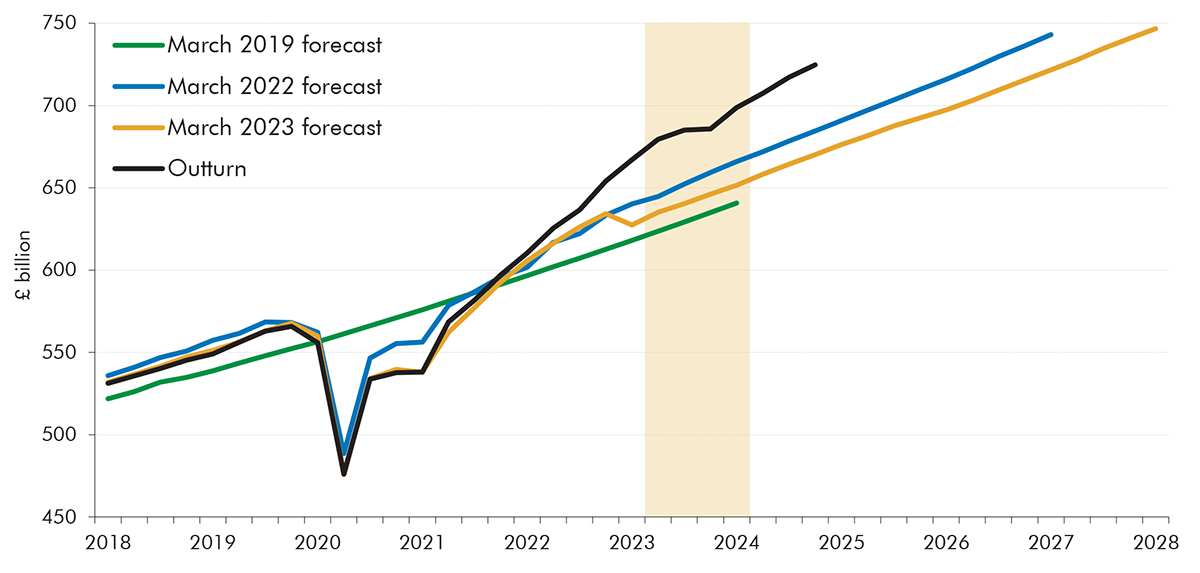
3.11 The net result of over-forecasting medium-term real GDP growth and under-forecasting inflation was a significant under-forecasting of cumulative nominal GDP growth – the most important driver of the fiscal forecast – over the five years since 2019, as shown in Chart 3.5:
The March 2019 five-year forecast for cumulative nominal GDP growth over the five years to 2023-24 was 19 per cent (8 percentage points below outturn), and for the deflator, 10 per cent (12 points below) (Table 3.5). High energy prices over 2022 and 2023 led to larger-than-expected increases in the GDP deflator, which cumulatively rose by 22 per cent over five years.
The March 2022 two-year forecast underestimated nominal GDP growth in 2023-24 (which grew by 6 per cent) by 2 percentage points. This was due to underestimating the GDP deflator by around 4 percentage points but overestimating real GDP growth.
The March 2023 one-year forecast underestimated nominal GDP by 4 percentage points due to the greater persistence of inflation increasing the GDP deflator relative to expectations. GDP deflator growth was lower than CPI inflation in 2023-24, due to a fall in the terms of trade as the price of energy, food, and other tradable goods rose relative to the price of goods and services for which the UK is a net exporter. But growth in the deflator was still more than enough to offset the low real GDP growth.
Chart 3.5: Nominal GDP level
Note: The shaded area marks 2023-24.
Source: ONS, OBR
Table 3.5: Nominal GDP growth and GDP deflator inflation
Nominal GDP
GDP deflator
One-year ahead
Two-year ahead
Five-year ahead
One-year ahead
Two-year ahead
Five-year ahead
Annual growth in 2023-24 (per cent)
Outturn
6.4
6.4
6.4
6.1
6.1
6.1
Forecast
2.8
4.4
3.6
2.5
2.4
2.0
Difference (percentage point)
3.7
2.1
2.8
3.6
3.7
4.1
Cumulative growth to 2023-24 (per cent)
Outturn
6.4
16.6
26.7
6.1
13.6
21.9
Forecast
2.8
11.0
18.6
2.5
6.6
10.1
Difference (percentage point)
3.7
5.6
8.0
3.6
7.1
11.8
Source: ONS, OBR
Fiscal forecasts for 2023-24
3.12 This section assesses the performance of the fiscal forecasts for the 2023-24 financial year that were made in March 2019, March 2022 and March 2023. We explore the differences between each forecast and the latest outturn data for:
public sector netborrowing (PSNB);
the receipts and spending forecasts that underpinned this borrowing forecast; and
public sector netdebt (PSND).
3.13 Where possible we use the standard approach taken in FERs and break down differences between outturn data and fiscal forecasts into four categories:[18]
economic factors – differences due to the changes in underlying economic conditions relative to our initial forecast;
policy changes – differences due to the cost of policies announced after the publication of the forecast;
classification changes – differences due to items being reclassified into or out of the public sector, or from changes to accounting methodology, following the forecast; and
fiscal forecasting differences – any remaining differences that cannot be explained by the other categories, such as those due to the performance of fiscal forecast models, the off-model judgements that we impose on the fiscal forecasts, or the impact of recosting policies between forecasts.
Borrowing
3.14Public sector net borrowing in 2023-24 was £131.1 billion (4.8 per cent of GDP). This was significantly higher than our March 2019 and March 2022 forecasts, in large part due to the shocks discussed in paragraph 3.3, but was in line with our March 2023 forecast. Breaking down the changes between forecasts in more detail:
In the March 2019 five-year ahead forecast, made before the Covid pandemic, we expected that borrowing in 2023-24 would be £13.5 billion (0.5 per cent of GDP). At that point we had expected borrowing to fall over the forecast period based on the then Government’s plans to reduce the deficit and the steady expansion in real output we expected, as shown in Chart 3.2 above. However, in practice outturn in 2023-24 was £117.6 billion higher (4.2 per cent of GDP) than this forecast, largely due to the impact of the Covid and inflation shocks on the economy and the Government’s policy response to both.
The March 2022two-year aheadforecast for borrowing in 2023-24 was £50.2 billion (1.9 per cent of GDP), which was £80.9 billion (2.9 per cent of GDP) lower than outturn. In March 2022 we expected borrowing in 2023-24 to have fallen from the peak during Covid but nevertheless to be higher than expected prior to the pandemic, largely due to higher levels of departmental spending after the pandemic. However, we did not anticipate the full impact of the subsequent energy crisis which led to higher-than-forecast borrowing, largely due to higher spending on debt interest (Table 3.9) and welfare (Table 3.8).
The March 2023 one-year ahead forecast for borrowing in 2023-24 was £131.6 billion (5.1 per cent of GDP), very close to final outturn of £131.1 billion (4.8 per cent of GDP). Within this were offsetting differences in receipts and spending. Persistent inflation led to higher-than-expected debt interest and welfare spending, almost exactly offset by a boost to receipts largely from stronger-than-expected nominal earnings.
Chart 3.6: Borrowing as a share of GDP
Note: PSNB is shown as the share of GDP forecast at the time. The shaded area marks 2023-24.
Source: ONS, OBR
Chart 3.7: Contributions to the changes in borrowing forecast and 2023-24 outturn
Source: ONS, OBR
Receipts
3.15Public sector current receipts (PSCR) in 2023-24 were £1,098 billion (40.0) per cent of GDP. This was higher than expected in each of the forecasts analysed in this chapter, by £156.4 billion (16.6 per cent) compared to the March 2019 forecast, £47.8 billion (4.6 per cent) compared to March 2022, and £40.3 billion (3.8 per cent) compared to March 2023. As a share of GDP, PSCR was 2.7 per cent of GDP higher than our March 2019 forecast but 0.1 per cent of GDP and 1.1 per cent of GDP lower than our March 2022 and March 2023 forecasts respectively. The contributions to these forecast differences can be categorised, as set out above, into differences due to economic determinants, policy, classification changes, and other fiscal forecasting factors.
3.16 The largest differences due to economic determinants were:
Higher-than-expected nominal earnings, largely driven by the high and persistent inflation explained above, made the largest contribution by significantly boosting income tax and National Insurance contributions (NICs). This accounts for a fifth of the overall difference between the March 2019 forecast and outturn, over two-thirds of the difference for the March 2022 forecast and one-half for the March 2023 forecast.
Higher-than-expected nominal consumption, also driven by the higher-than-expected inflation, accounts for £9.1 billion and £8.5 billion of the March 2022 and March 2023 forecast differences, respectively, mainly through higher value added tax (VAT) receipts than forecast.
The rise in Bank Rate accounts for £12.9 billion of the forecast difference compared to the March 2019 forecast and £10.4 billion compared to the March 2022 forecast, through higher-than-expected returns on interest-rate-sensitive elements such as the Government’s bank deposits.
A set of other economic factors including company profits, employment and the size of the nominal economy have also made a significant contribution to the overall forecast difference for 2023-24, in particular accounting for £44.2 billion of the forecast difference with the March 2019 forecast. This is likely to largely reflect the significant underestimate of cumulative nominal GDP growth made in March 2019, described above, leading to lower-than-expected revenues across a wide range of tax streams, including a number of smaller receipts lines.
3.17 There were several significant tax policy changes introduced after the March 2019 forecast that affected receipts in 2023-24:
Overall, these subsequent policy changes contributed £11.1 billion to the forecast difference compared to the March 2019 forecast. The increase to the main rate of corporation tax to 25 per cent and the freezing of income tax thresholds first announced in March 2021 were initially estimated to raise £11.8 billion and £4.2 billion, respectively, in 2023-24. The energy profits levy (EPL) announced in May 2022 was expected to raise a further £10.8 billion. This was partly offset by the full expensing of capital allowances announced in March 2023 which was estimated to reduce corporation tax yield by £7.9 billion. The differences in the actual yield from these measures compared to the initial costing are captured in fiscal forecast differences, explained below.
The March 2022 forecast was also impacted by the EPL and capital allowance measures. However, policy changes overall resulted in 2023-24 receipts being £20.4 billion less than this forecast. This is because this forecast incorporated the expected yield in 2023-24 from the Health and Social Care Levy announced in September 2021. This policy was subsequently dropped in October 2022 leading to £18.0 billion lower receipts than forecast.
3.18Classification changes account for £28.5 billion of the under-forecast of 2023-24 receipts made in March 2019. The ONS made subsequent decisions to include in public sector receipts the interest received on funded public sector pension schemes, and to change its estimate of the size of the public sector capital stock, which increases the gross operating surplus recorded in receipts. This was partly offset by a reduction in accrued student loans interest, a correction to corporation tax data and the recording of some environmental levies. Further, in our November 2020 forecast we incorporated a reclassification of visa fees that fully offset in receipts and spending. In total there were £37.8 billion of classification changes to receipts that were not incorporated in the March 2019 forecast.[19] These had no impact on borrowing due to offsetting changes in spending, as outlined further in paragraph 3.29.
3.19 After accounting for differences due to economic factors, policy and classification there is a substantial remaining fiscal forecast difference between the March 2019 forecast and outturn of around £26.9 billion. This is predominantly due to higher-than-expected income tax and NICs receipts, the reasons for which are discussed in more detail in paragraph 3.20 below. Fiscal forecast differences for the March 2022 and 2023 forecasts are relatively small and reduced the overall forecast difference by £4.1 billion and £1.5 billion, respectively.
Chart 3.8: Receipts as a share of GDP
Note: PSCR is shown as the share of GDP forecast at the time. The shaded area marks 2023-24.
Source: ONS, OBR
Chart 3.9: Contributions to the forecast difference for PSCR by tax and determinant
Source: ONS, OBR
3.20 As outlined above, changes due to the economy, policy, and classification changes more than explain the differences between outturn and the March 2022 and March 2023 forecasts for receipts, but only explain around four-fifths of the difference with the March 2019 forecast. We can also decompose forecast differences by individual tax stream, which is also helpful in focusing in on the most significant of the remaining fiscal forecasting differences:
Income tax and NICs are the largest contributor to overall receipts forecast differences, mainly driven by higher-than-expected nominal earnings. However, it is also the revenue stream with the largest impact on the fiscal forecast difference for March 2019. Of this, £12.9 billion can be explained by higher-than-expected yield from the freezes to personal tax thresholds announced at fiscal events between March 2021 and November 2022. Because nominal earnings growth was subsequently much higher-than-expected, many more taxpayers than forecast saw their earnings cross over the personal tax allowance or into higher tax bands, and so the yield from these measures was £8.7 billion higher than in the original costing that is included in the policy category in Table 3.6.[20]
VAT receipts were boosted compared to forecast by strong nominal consumption, which more than accounted for the overall difference between VAT outturn and the March 2022 and March 2023 forecasts.[21] A negative fiscal forecast difference for both the March 2022 and March 2023 forecasts reflects a lower-than-expected standard VAT-rated share of consumer spending. This reflects stronger-than-forecast spending on food, energy and rents (which pay zero or lower rate VAT) crowding out spending on standard VAT rated goods. In response to this, as outlined in the 2024 FER, we have redeveloped the forecast model for VAT so that different inflation rates across these components of consumption can be modelled in the forecast.
Onshore corporation tax (onshore CT) was underestimated at each forecast with profits in both the financial and non-financial sectors subsequently proving more resilient than expected. In addition, the effective tax rate paid on these profits has been higher than expected, which is categorised as a fiscal forecasting difference, in sectors that are historically big payers of corporation tax such as financial services, retail and professional services. In response to this we increased the effective tax rate in more recent forecasts and there was a smaller CT fiscal forecast difference in the March 2023 forecast.
Excise and fuel taxes were overestimated at each forecast. Successive policy decisions to freeze fuel duty rates have largely offset the higher-than-forecast revenue we would have expected from higher fuel prices. Fiscal forecast differences in these taxes are largely due to a persistent underestimation of the take up of electric vehicles (EV) and lower-than-expected consumption of alcohol and tobacco (partly due to increased substitution to vaping). Since March 2023 we have adjusted the fuel duty forecast for a revised EV take-up assumption and amended the price elasticities used in the tobacco model.
Capital taxes were also overestimated at each forecast. Fiscal forecasting differences in the March 2022 and 2023 forecasts can be partly explained by an assumption that capital gains tax (CGT) strength in 2022-23 would be more structural than it proved in outturn. Subsequent data showed that this strength was driven by very high payments from the top one per cent of payers and turned out to be more temporary than assumed as CGT receipts then fell back in 2023-24. This highlights the importance of separately identifying and assessing the temporary and permanent factors driving changes in these tax bases.
Other receipts were underestimated at each forecast. Higher-than-expected interest rates increased interest and dividend receipts, and the larger-than-expected nominal economy boosted many of the receipt streams in this category. The large classification changes implemented by the ONS in September 2019 and outlined above in paragraph 3.18 account for one third of the March 2019 other receipts forecast difference. There are several new receipt streams that were introduced after the March 2019 forecast that also contribute to the large March 2019 forecast difference.
Table 3.6: PSCR forecast differences for 2023-24 by receipts stream
£ billion
of which:
Outturn
Forecast
Difference
Economic factors
Policy changes
Classification changes
Fiscal forecasting difference
Income tax and NICs
March 2019
456.5
401.7
54.8
35.3
-0.9
0.0
20.4
March 2022
456.5
418.6
37.9
37.0
2.5
0.0
-1.7
March 2023
456.5
440.3
16.2
23.9
-2.2
0.0
-5.5
Value added tax
March 2019
168.4
155.6
12.8
6.4
0.8
0.0
5.7
March 2022
168.4
160.0
8.4
10.5
0.1
0.0
-2.1
March 2023
168.4
162.2
6.2
8.6
0.0
0.0
-2.4
Onshore corporation tax
March 2019
87.9
63.5
24.4
1.5
8.1
-4.8
19.6
March 2022
87.9
77.5
10.4
5.9
-7.7
0.0
12.3
March 2023
87.9
76.9
11.0
8.8
0.5
0.0
1.8
Excise and fuel taxes(1)
March 2019
46.3
55.6
-9.3
6.1
-8.0
0.0
-7.4
March 2022
46.3
54.2
-7.9
4.4
-5.3
0.0
-6.9
March 2023
46.3
47.8
-1.5
0.6
-0.1
0.0
-2.0
Capital taxes(2)
March 2019
38.0
38.8
-0.8
4.0
0.7
0.0
-5.5
March 2022
38.0
44.4
-6.5
-5.7
-1.0
0.0
0.2
March 2023
38.0
40.6
-2.6
-0.5
-0.1
0.0
-2.1
Other receipts
March 2019
300.9
226.3
74.6
36.6
10.4
33.3
-5.8
March 2022
300.9
295.3
5.5
20.7
-8.8
-0.5
-5.9
March 2023
300.9
289.8
11.1
2.8
0.3
-0.6
8.6
1) Includes fuel, alcohol and tobacco duties.
2) Includes capital gains tax, inheritance tax, and stamp duties.
Source: ONS, OBR
Spending
3.21Total managed expenditure (TME) in 2023-24 was £1,229 billion (44.7 per cent of GDP). This was higher than expected in each of the forecasts analysed in this report, by £274.0 billion (29 per cent) compared to the March 2019 forecast, by £128.7 billion (12 per cent) compared to the March 2022 forecast, and by £39.8 billion (3 per cent) compared to the March 2023 forecast. TME was 7.0 and 2.8 per cent of GDP higher than our March 2019 and March 2022 forecasts respectively. It was 1.5 per cent of GDP lower than our March 2023 forecast, as our underestimate of spending was more than offset by the underestimate of nominal GDP discussed in 3.11.
3.22 The largest contributions to these forecast differences are in the following areas which are explained further in the sections below:
Departmental expenditure limit (DEL) spending was £87.1 billion higher than forecast in March 2019, mainly reflecting large increases to departmental spending allocations made by the previous Government at the September 2019 Spending Round and October 2021 Budget and Spending Review;
Debt interest spending was £64.6 billion higher than forecast in March 2019 and £56.3 billion higher than forecast in March 2022, due to high inflation increasing spending on index-linked gilts, higher-than-expected Bank Rate increasing the cost of reserves, higher bond yields increasing the cost of conventional gilts, and a higher level of debt issuance at elevated interest rates;
£35.9 billion higher welfare spending than forecast in March 2019, reflecting above-forecast benefit uprating, increases in incapacity spending, and the introduction of one-off cost-of-living payments to benefit claimants incorporated at the November 2022 fiscal event; and
£86.5 billion higher otherannually managed expenditure (AME) spending than forecast in March 2019, explained in greater detail below.
Chart 3.10: Spending as a share of GDP
Note: TME is shown as the share of GDP forecast at the time. The shaded area marks 2023-24.
Source: ONS, OBR
Chart 3.11: Contributions to overall forecast differences for TME
Source: HMT, ONS, OBR
Departmental spending
3.23 Total spending within DEL was £519.3 billion in 2023-24. Within this departmental current spending (public sector current expenditure in resource DEL (PSCE in RDEL)) was £422.7 billion while departmental capital spending (public sector gross investment in capital DEL (PSGI in CDEL)) was £96.6 billion. Relative to each of the forecasts assessed in this report overall DEL spending was underestimated largely due to subsequent policy announcements to increase both current and capital spending limits, as set out below. This is consistent with the finding in Working paper No. 19: The OBR’s forecast performance 2023, that our tendency to underestimate the medium-term level of government spending is largely because we have to condition our forecasts on the Government’s stated plans for departmental spending, which are then subsequently increased.
Table 3.7: Sources of difference in the March 2019, March 2022, and March 2023 RDEL and CDEL forecasts for 2023-24.
£ billion
of which:
Outturn
Forecast
Difference
Classification changes and other
Policy changes
Actual spend judgement
March 2019 forecast
PSCE in RDEL
422.7
356.8
65.9
-2.8
71.1
-2.4
PSGI in CDEL
96.6
75.4
21.2
3.7
18.3
-0.8
March 2022 forecast
PSCE in RDEL
422.7
408.0
14.7
-6.9
22.8
-1.2
PSGI in CDEL
96.6
94.6
1.9
-1.1
-0.9
3.9
March 2023 forecast
PSCE in RDEL
422.7
421.7
1.0
-6.7
8.8
-1.1
PSGI in CDEL
96.6
96.1
0.5
-1.1
-2.5
4.1
Source: ONS, OBR
3.24PSCE in RDEL was underestimated in all three forecasts mainly due to subsequent policy decisions to increase RDEL limits. The largest policy changes occurred at the September 2019 Spending Round and October 2021 Budget and Spending Review, which increased the RDEL limit by £34.9 billion and £28.5 billion, respectively. Increases in departmental expenditure limits to address the impacts of Covid were even larger in the preceding years (£110 billion in RDEL spend in 2020-21) but had largely been withdrawn by 2023-24. The £12.7 billion reduction in RDEL pencilled in at the November 2020 Spending Review for 2023-24 was more than reversed by successive increases to the RDEL limits after the October 2021 Spending Review.
3.25 These increases were partially offset within PSCE in RDEL by classification changes, which reduced PSCE in RDEL but were offset in higher AME and receipts and so had no impact on overall borrowing. In addition, the degree to which departments underspent against DEL plans was lower than we forecast by between £1.1 billion and £2.4 billion.
3.26PSGI in CDEL was also underestimated in all three forecasts. Again, this was mainly due to policy decisions to increase CDEL plans, in particular at the September 2019 Spending Round and March 2020 Budget, which together increased CDEL plans by £16.1 billion. In the March 2022 and March 2023 forecasts we expected departments to underspend against these limits by £3.9 and £4.1 billion, respectively, more than was actually the case. That departments spent more of their CDEL budgets than expected could reflect the higher-than-expected inflation experienced after the budgets were set.
Welfare spending
3.27Welfare spending in 2023-24 was £296.4 billion. This was £35.9 billion (13.8 per cent) higher than forecast in March 2019 forecast, £25.6 billion (9.4 per cent) higher than forecast in March 2022, and £1.8 billion (0.6 per cent) higher than forecast in March 2023. Compared to March 2019 forecast, the largest differences are due to:
Higher-than-expected inflation and earnings growth increased the cost of benefit uprating by £19.4 billion compared to the March 2019 forecast. Just over half of this was explained by a higher cost of the triple lock uprating for the state pension (£10.5 billion), with the remainder nearly all explained by higher working-age uprating (£8.9 billion).
The introduction of one-off cost-of-living payments to benefit claimants in 2023-24 incorporated at November 2022 increased spending by £10.3 billion. This was partially offset by the one-year ‘double-lock’ on state pension uprating announced at October 2021, which reduced spending and the forecast difference due to policy compared to the March 2019 forecast.
A £16.9 billion fiscal forecasting difference in March 2019, nearly all explained by the forecast underestimate in universal credit (UC) and legacy benefits (£15.7 billion). Roughly two thirds of this increase is due to higher spending on incapacity benefits across the March and November 2020 forecasts, reflecting significant increases in the caseloads on these benefits. As set out in our 2024 Welfare Trends Report, these increases are likely to reflect a wide range of factors including changes in underlying population health, the economy and labour market, and the structure of the benefits system.
Table 3.8: Sources of differences in the March 2019, March 2022, and March 2023 welfare forecasts for 2023-24
£ billion
of which:
Outturn
Forecast
Difference
Economic factors
Policy and classification changes
Fiscal forecasting difference
Total welfare spending
March 2019
296.4
260.5
35.9
16.0
3.0
16.9
March 2022
296.4
270.8
25.6
4.7
11.4
9.5
March 2023
296.4
294.5
1.8
-0.3
0.0
2.1
Pensioner spending
March 2019
141.9
131.0
10.9
12.8
-4.0
2.1
March 2022
141.9
133.7
8.2
2.8
4.4
1.0
March 2023
141.9
141.6
0.3
0.0
0.0
0.3
UC and legacy equivalents
March 2019
87.3
67.1
20.3
-0.2
4.8
15.7
March 2022
87.3
75.2
12.2
0.7
5.7
5.8
March 2023
87.3
86.0
1.3
-0.1
0.0
1.5
Disability benefits
March 2019
36.3
32.0
4.3
2.2
-3.3
5.4
March 2022
36.3
32.2
4.1
0.8
1.3
2.1
March 2023
36.3
36.3
0.1
0.0
0.0
0.0
Child benefit
March 2019
12.5
12.7
-0.1
0.8
-0.1
-0.9
March 2022
12.5
12.3
0.2
0.1
0.0
0.1
March 2023
12.5
12.6
-0.1
-0.1
0.0
0.0
Other welfare spending
March 2019
18.3
17.7
0.5
0.3
5.6
-5.4
March 2022
18.3
17.4
0.8
0.3
0.1
0.5
March 2023
18.3
18.1
0.2
-0.1
0.0
0.3
Source: DWP, OBR
Debt interest spending
3.28Debt interest spending in 2023-24 was £106.9 billion. This was £64.6 billion (152.8 per cent) higher than forecast compared to the March 2019 forecast, by £56.3 billion (111.1 per cent) compared to the March 2022 forecast, and by £12.9 billion (13.8 per cent) compared to the March 2023 forecast. These differences can be decomposed into the following factors:
Asset Purchase Facility (APF) interest losses account for around half of the difference between each forecast and outturn.[22] This is due to the combination of the size of the APF increasing by over £450 billion since our March 2019 forecast to a peak value of £875 billion in January 2022 in response to the Covid crisis, and Bank Rate rising from 0.1 per cent in December 2021 to 5.25 per cent in August 2023. As the interest paid by the APF (Bank Rate) rose above the average yield received on the gilts held, the APF began to make large losses from October 2022, rather than the profits expected in both the March 2019 and March 2022 forecasts.
Higher-than-expected RPI inflation led to higher-than-forecast spending on index-linked gilts for each forecast analysed, accounting for around 70 per cent of the overall difference for the March 2023 forecast. The UK was particularly exposed to this fiscal impact of the inflation shock due to its comparatively high level of index-linked debt internationally.
The overall rise in interest rates over this period also led to central government debt interest spending being higher than forecast. For the March 2019 forecast both Bank rate and gilt yields were initially below forecast as interest rates reached record lows during Covid, but higher-than-expected Bank Rate in 2022-23 and 2023-24 then increased spending on short-term financing and National Savings and Investments (NS&I) interest. The post-Covid increases in Bank rate and gilt yields also drove higher debt interest spending compared to the March 2022 and 2023 forecasts, by £6.9 billion and £4.2 billion respectively.[23]
Central government (CG) financing and other factors led to higher debt interest spending than forecast compared to the March 2019 and March 2022 forecasts, by £9.2 billion and £7.9 billion respectively. This is primarily due to higher-than-forecast debt issuance and will also capture some of the impact of higher interest rates on this new issuance. A lower overall government financing requirement and model corrections relating to debt that redeemed within the forecast horizon led to lower debt interest spending of £7.3 billion compared to the March 2023 forecast.
Table 3.9: Sources of differences in the March 2019, March 2022, and March 2023 debt interest forecasts for 2023-24
£ billion
of which:
Outturn
Forecast
Difference
APF interest losses
RPI inflation
Interest rates
Financing and other
March 2019
106.9
42.3
64.6
31.3
16.0
8.1
9.2
March 2022
106.9
50.6
56.3
24.8
16.7
6.9
7.9
March 2023
106.9
94.0
12.9
6.8
9.1
4.2
-7.3
Source: Bank of England, ONS, OBR
Other spending
3.29Other spending was £306.4 billion in 2023-24 of which £268.5 billion was current and £37.9 billion was capital spending. This was higher than each of the forecasts with most of the difference explained by higher current spending. Other current spending was underestimated by £74.4 (38.3 per cent), £29.2 (12.2 per cent), and £23.1 billion (9.4 per cent) in the March 2019, March 2022 and March 2023 forecasts respectively. Compared to March 2019, the largest sources of difference were:
Classification changes led to £40.7 billion higher spending than forecast. The ONS’s incorporation of funded pensions into the public sector, the ONS’ exclusion of certain environmental levies from outturn, and improvements to the measurement of capital stocks increasing depreciation in September 2019 increased TME by £33.7 billion. Of these changes, £33.6 billion were offset in receipts and so are neutral for overall borrowing, as outlined in paragraph 3.18. Treasury reclassifications shifted a further £7.0 billion of various DEL items to AME in a fiscally neutral way, as set out in paragraph 3.25 above.[24]
Policy changes led to £12.9 billion higher spending than forecast, primarily due to a £6.2 billion increase in Scottish government spending,[25] and £3.8 billion from the Energy Price Guarantee which subsidised gas and electricity bills for households.
A £20.8 billion fiscal forecast difference with the March 2019 forecast, where the largest forecast underestimates were for current VAT refunds (£5.6 billion), the EU financial settlement forecast (£5.5 billion), Scottish government current spending (£3.8 billion), and company tax credits (£3.7 billion).[26]
3.30 In addition to the differences at the five-year horizon above, a fiscal forecast difference across other current spending of £14.9 billion accounted for around 40 per cent of the £39.8 billion overall difference between the March 2023 forecast and outturn. Given the significant size of this fiscal forecast difference in the one-year ahead forecast, we explore its possible explanations and the lessons we draw for forecast methodology in more detail in Box 3.1.
Table 3.10: Sources of difference in the March 2019, March 2022, and March 2023 other current spending forecasts for 2023-24
£ billion
of which:
Outturn
Forecast
Difference
Classification changes
Policy
Fiscal forecast
Other current spending
March 2019
268.5
194.2
74.4
40.7
12.9
20.8
March 2022
268.5
239.3
29.2
7.9
15.6
5.7
March 2023
268.5
245.4
23.1
7.9
0.4
14.9
Source: HM Treasury, ONS, OBR
Box 3.1: Differences in successive current spending forecasts
The March 2023 forecast underestimated other current spending in 2023-24 by £23.1 billion. Of this, £7.9 billion reflects classification changes which are neutral for overall spending (see Table 3.10), while £0.4 billion is explained by policy changes to Scottish government spending. However, this leaves a substantial remaining fiscal forecast difference of £14.9 billion, comprising:
a £2.9 billion underestimate of environmental levies, primarily reflecting lower-than-forecast electricity prices, and a £1.9 billion underestimate of current VAT refunds. Both of these are largely fiscally neutral as they are offset by an equal receipts forecast difference.
a £1.2 billion underestimate of the EU financial settlement, mostly explained by a change in the timing of payments, and so is partially offset in later years of the forecast.
a £2.0 billion underestimate of locally financed current spending, most of which (£1.4 billion) is due to higher-than-expected use of reserves by local authorities, and a £1.1 billion underestimate of Scottish government current spending.
a £4.1 billion underestimate of National Accounts adjustments. These adjustments align the forecasts of spending items as defined in the Treasury’s spending control framework, to the definitions of current and capital expenditure used in the public sector finances.
Initial ONS outturn data also suggests a significant underestimate of £13.3 billion in the March 2024 forecast of other current spending for 2024-25. Revisions to some areas of this outturn data are likely later in the year when additional data on spending and local authority borrowing becomes available. Nonetheless, provisional analysis at this point suggests that the forecast underestimate for this year is concentrated in some similar areas to the 2023-24 forecast underestimate. In particular, against the initial outturn data for 2024-25 there is a £6.1 billion fiscal forecast difference in the National Accounts adjustments forecast, and a £1.2 billion difference in the locally financed current spending forecast. It is also the case that there are initial forecast differences in these areas between the in-year forecast for 2024-25 made in March 2025, and the initial ONS outturn estimates. As a result, we are, as a priority, reviewing the forecast methodologies and data sources used in these areas:
National Accounts adjustments: we are, with the Treasury, reviewing the methodologies used to produce this forecast including assessing the sources of the residuals between ONS outturn and the Treasury’s estimates of accounting adjustments. The aim is to minimise these residuals so that we have a fuller understanding of each element of the forecast.
Locally financed spending and local authority net borrowing: we are reviewing these forecasts to further decompose the recent series of underestimates. We have started work with the Treasury and ONS to better understand how the ONS produces estimates of local authority outturn with the aim of better aligning methodologies. We will also consider the scope for improving the supply to the OBR, ONS and the Treasury of in-year data on local authorities.
Chart A: Sources of difference in the March 2023 forecast for other current spending in 2023-24
Source: HMT, ONS, OBR
Chart B: Preliminary analysis of sources of difference in the March 2024 forecast for other current spending in 2024-25
Source: HMT, ONS, OBR
Debt
3.31Public sector net debt (PSND) in 2023-24 was £2.7 trillion or 95.6 per cent of GDP. This was higher than expected in our March 2019 and March 2022 forecasts, in large part due to the shocks discussed in paragraph 3.3, but lower than our March 2023 forecast. Breaking down the changes between forecasts in more detail:
In March 2019, before the Covid pandemic, we expected PSND to be 73.0 per cent of GDP in 2023-24, which is 22.6 per cent of GDP lower than the latest outturn.
Between March 2019 and March 2022 we increased the forecast for debt in 2023-24 by 21.1 per cent of GDP to 94.1 per cent of GDP, 1.5 per cent of GDP lower than latest outturn. This primarily reflected the significant increase in cash debt accumulated between the March 2019 and March 2022 forecasts, equal to 24.8 per cent of GDP, largely due the historic increase in borrowing due to Covid. There was a partial offset to this from an increase to the size of the nominal economy compared to the forecast in March 2019 which was driven by the higher-than-expected increase in the GDP deflator, rather than real economy growth.
Between our March 2022 and March 2023 forecast we increased our projection for debt by a further 9.0 per cent of GDP to 103.1 per cent of GDP, largely driven by a further increase in borrowing due mainly to higher spending, notably on debt interest payments and welfare.
The latest outturn for debt as a share of GDP is 7.5 per cent of GDP lower than the March 2023 forecast. This is mostly due to a larger-than-expected nominal economy driven by a higher GDP deflator, with a small contribution also from a lower accumulation of cash debt than expected.
Chart 3.12: Debt as a share of GDP
Note: PSND is shown as the share of GDP forecast at the time. The shaded area marks 2023-24.
Source: ONS, OBR
Chart 3.13: Contributions to the changes in debt forecasts and 2023-24 outturn
Source: ONS, OBR
External forecasts for the UK economy and public finances
3.32 In each Economic and fiscal outlook, we compare our forecasts with contemporaneous external forecasts for the UK economy, providing an indication of the uncertainty around our central projections due to differing forecast judgements and conditioning assumptions. While it is not always possible to pinpoint the exact reasons for these differences, this comparison helps contextualise our forecasts within the range of projections made around the same time.
3.33 We have not previously systematically reviewed the accuracy of our forecasts relative to the external average once near-final or final outturn data become available. In this FER we undertake this exercise for the first time, in Chapter 2 for forecasts over the period since 2010, and in this section for the three forecasts for 2023-24 assessed in the previous section. Chapter 2 sets out a number of institutional factors which could explain the differences between our forecasts and those of external forecasters. Notwithstanding these factors, where our forecast differences diverge significantly from those of external forecasters this should prompt us to review the modelling approaches and judgements we have made for the relevant variables.
3.34 The average of external forecasts used in this section uses forecasts taken from Forecasts for the UK economy, a publication detailing forecasts from City and non-City organisations up to five years ahead, published by HM Treasury four times a year. To evaluate the relative accuracy of OBR projections, we consider the median average external forecast for GDP growth and CPI inflation in 2023 and for PSNB as a percentage of GDP in 2023-24. Comparisons to additional variables and a comprehensive guide to our methodology can be found in our online annexes to this publication on our website.
Real GDP growth
3.35 Both the OBR and the external average forecast overestimated real GDP growth in 2023 in their two-year ahead forecasts, but underestimated real GDP growth one-year ahead (Table 3.11). In 2022, the OBR projected real GDP growth of 1.8 per cent and the external average projected 2.3 per cent in 2023, compared to the actual outturn of 0.4 per cent. These forecast differences are in line with historical accuracy, as measured by the average absolute forecast difference one year and five years ahead as set out in Chapter 2, but less accurate than the average over the two-year horizon. In 2023, both the OBR and the average external forecaster revised expectations downwards, and both ultimately underestimated real GDP growth with the OBR forecasting a fall of 0.2 per cent and the external average a fall of 0.7 per cent.
Table 3.11: OBR and external forecasts for GDP growth in 2023
One-year ahead
Two-year ahead
Five-year ahead
OBR
External average
OBR
External average
OBR
External average
Outturn (per cent)
0.4
0.4
0.4
0.4
0.4
0.4
Forecast
-0.2
-0.7
1.8
2.3
1.6
1.7
Difference (percentage point)
0.6
1.1
-1.4
-1.9
-1.2
-1.3
Note: External averages use the median values of external forecasts compiled by HM Treasury.
Source: HM Treasury, ONS, OBR
Inflation
3.36 Forecasts produced by both the OBR and external forecasters underestimated the degree of inflation in 2023 (Table 3.12). At the five-year horizon this reflected the common failure to anticipate the Russian invasion of Ukraine, so both forecasts were 5.3 percentage points away from outturn. Shorter horizon forecasts did not fully reflect the magnitude or persistence of inflationary pressures following the large spike in gas prices that then occurred: the OBR’s one-year ahead forecast was 0.8 percentage points further away from what transpired than the average external forecaster’s, but its two-year ahead forecast was 1.6 percentage points closer. As we show in Chapter 2, the differences to outturn that would normally be expected at all three horizons are much smaller than what happened, reflecting a challenging period for inflation forecasting.[27]
Table 3.12: OBR and external forecasts for CPI inflation in 2023
One-year ahead
Two-year ahead
Five-year ahead
OBR
External average
OBR
External average
OBR
External average
Outturn (per cent)
7.3
7.3
7.3
7.3
7.3
7.3
Forecast
6.1
6.9
4.0
2.5
2.0
2.0
Difference (percentage point)
1.2
0.4
3.3
4.9
5.3
5.3
Note: External averages use the median values of external forecasts compiled by HM Treasury.
Source: HM Treasury, ONS, OBR
Public sector net borrowing (PSNB)
3.37 One-year ahead, the forecasts of both the OBR and the average of external forecasters were very close to outturn for public sector net borrowing as a share of GDP (Table 3.13). In the two-year ahead forecasts, the OBR and the average external forecast both underestimated borrowing in 2023-24, by 3.0 per cent of GDP and 2.6 per cent of GDP, respectively, largely due to the large spike in inflation that led to much higher-than-expected debt interest and other spending. For the five-year ahead forecast, both the OBR and the average external forecast significantly underestimated borrowing, by 4.3 per cent of GDP and 3.7 per cent of GDP, respectively. This trend of underestimating five-year ahead borrowing is in line with the general historic trend in Table 2.3 but the forecast difference in 2023-24 is higher than the average, driven in large part by the shocks that we discuss earlier in this Chapter.
Table 3.13: OBR and external forecasts for PSNB in 2023-24
One-year ahead
Two-year ahead
Five-year ahead
OBR
External average
OBR
External average
OBR
External average
Outturn (per cent of GDP)
4.8
4.8
4.8
4.8
4.8
4.8
Forecast
4.8
4.9
1.8
2.2
0.5
1.1
Difference (percentage point)
0.0
-0.1
3.0
2.6
4.3
3.7
Note: Numbers are based on fiscal years. External average uses the external forecasts compiled by HM Treasury. Nominal public sector net borrowing has been adjusted for classification changes between the original forecast and the latest outturn and then divided by the latest outturn for nominal GDP in 2023-24.
Source: HM Treasury, ONS, OBR
Chapter 4: Refining our forecasts
4.1 The scrutiny of our forecast performance in Forecast evaluation reports (FERs) is an important part of our commitment to transparency. It facilitates greater understanding of our forecasts and helps ensure we can be held to account for the judgements we make. It is also important that we use it to learn lessons, with the aim of improving future forecasts. In this chapter, we therefore summarise the most important lessons we have learnt as well as actual and planned improvements to our models for economic and fiscal forecasting. Further details on these plans are provided in updated model assessment databases, published alongside this FER.
Economic forecasting improvements
4.2 With limited resources to continuously update, develop, and explain the tools we use in economic modelling, we concentrate our efforts in areas of the forecast that are the most material. In each FER, we have covered the progress against previously identified economic modelling priorities and research areas, and following conclusions in this and previous FERs, associated priorities for model development. In line with the recommendations of our third external review,[28] published in February 2025, alongside this FER we have published a new database on our website.[29] This outlines more systematically the recent and ongoing work to improve the models and tools used in our economic forecasting and analysis. In April 2025, in conjunction with the Treasury (HMT), we also published our Memorandum of Understanding for macroeconomic models which establishes a framework for the joint governance, management and development of the OBR and HMT’s shared macroeconomic modelling infrastructure. We will continue to report on economy modelling progress and priorities for development in future Economic and fiscal outlooks (EFOs), FERs and our economic modelling development database.
New priorities since our last Forecast evaluation report
4.3 Since our last FER, we have identified areas of our forecast that we hope to develop, which are outlined in this section. Inevitably, this represents a current snapshot. New priorities are likely to emerge as events unfold, the structure of the economy changes and policies are announced. We will continue to highlight prospective changes in future FERs and model development databases in the interest of public transparency and accountability. Five notable new priorities discussed include:
We are conducting our usual annual supply stocktake over the summer months. This involves research into our potential output forecast and its components to review the validity of the assumptions used in this forecast’s construction. We will be engaging with our advisory panel and other experts as part of this process.
Given significant uncertainty surrounding the global trade environment, in conjunction with HMT, the Department for Business and Trade, and the Bank of England we will be expanding our trade modelling capabilities, drawing on these departments’ expertise alongside our own work. We are exploring the use of various economic models and their suitability for modelling trade to complement our existing models.
To improve both our scenario modelling capability and ability to capture interest rate responses to fiscal policy announcements, we are reviewing the parameters used in our ‘small model’ as published in Working paper No. 4: A small model of the UK economy in 2012.[30] The model follows a New Keynesian framework involving four linear simultaneous equations: an investment-savings (IS) relation, Philips curve, Taylor rule and uncovered interest parity relation.
In light of the increase in residential investment that we expect to occur following the measures announced by the Government to boost housing supply, including in particular December’s revised National Planning Policy Framework, we are reviewing how we construct and decompose our housing supply forecast to better understand its key sectoral and other drivers.
We will be responding to the recommendations in our external review to improve the transparency, communication and scrutiny of our economic modelling. Over the past few years, the OBR has expanded its range of publications including indirect effects notes and staff-led articles which provide more detail on the analysis and modelling we undertake. One recommendation in our recent external review was to improve our communications around our modelling infrastructure and put more of it into the public domain. We plan to continue updating these publications in several areas, including publishing more information on the small model (described above) and cohort model (that captures the influence of demographics and the state pension age changes on employment and participation by single year of age and gender). We will also review our experience to date in estimating the supply-side effects of policy. As recommended by our third external review, we will take stock of the lessons that we have learned from our more systematic and transparent approach to capturing the impact of government policy measures on our forecast for potential output.[31]
Progress against previously identified modelling priorities
4.4 The process of refining our models and the judgements underpinning our economic forecasts is a continuous one that draws on analysis prepared in forecasting rounds and for our FERs. This section builds on existing processes and is published to aid public transparency. Some model development that has already been factored into our forecasts and has been discussed in past FERs (or other publications) include:
A key theme of our October 2024 FER was our response to our underestimate of the persistence in inflation following the energy price shock precipitated by Russian invasion of Ukraine. We have highlighted in recent FERsthe methodological changes we have made to address these issues, including exactly how we update our assumptions regarding the degree of pass-through associated with energy price shocks – a judgement based on, among other things, the development of a vector error correction model. We are updating our wage and non-tradable inflation forecasting equations, and hope to review our output gap models that we use to analyse the degree of economic slack.
Having developed a model to assess the effect of public investment on potential output, we deployed it in the October 2024 forecast to calculate the effect of the expansion in public capital. In doing so, we updated our modelling approach, following feedback, to incorporate the endogenous response of business investment to a larger private sector capital stock, with the uncertainties around this judgement and implications it had for the Government’s ‘rate of return’ detailed in Box 3.3 of that report. We discussed our responses to this and other feedback on our approach to modelling changes in public investment in another recent release.[32]
We have now completed our overlapping generations (OLG) model, described in detail in our recent working paper in conjunction with HMT.[33] This model was developed to analyse structural shocks and the long-run impacts of government policy. We intend to use this model in our upcoming Fiscal risks and sustainability report to analyse the potential implications of demographic shifts for future demand for assets, interest rates, and other economic variables.
We also discussed in our 2024 FERBox 2.1 the need to convey the heightened degree of uncertainty around our central forecasts through use of more extreme scenarios, sensitivity analysis, fan charts and stochastic simulations, particularly during periods when the economy is hit with ‘out-of-sample’ shocks. In our recent EFO, we modelled a scenario with a 20 percentage point tariff shock, which was at the upper range of other scenarios by externals. We also undertook sensitivity analysis around our productivity and interest rate assumptions given uncertainty around the future path for productivity and continued volatility in interest rates expectations.
Fiscal forecast improvements
4.5 We review our fiscal forecasting modelling priorities and progress alongside each FER, with the results published in a database on our website.[34] A new development in this FER is the database that we have published in an online annex of past fiscal forecasting differences for receipts to show the historical size of this residual component across the forecasts. We intend to develop this further in future FERs to include a broader range of receipts and some areas of spending, and plan to make greater use of the database in setting future model development priorities.
New priorities since our previous model assessment database
4.6 Using this approach, we have identified the following new priorities for fiscal forecast development based on the analysis in this report:
Our new approach has highlighted unusually large differences from other economic factors across many smaller receipts lines (Chart 3.9). We intend to investigate the drivers of these receipts in more detail, review our current forecasting methods and explore the links with the size of the nominal economy. We will further investigate the smaller components of the interest and dividend receipts forecast and will also implement a new ready-reckoning approach to enable a greater understanding of the sensitivity of this forecast to key economic assumptions.
The analysis in this FER shows that policy decisions on departmental spending (DEL) continue to be one of the most material sources of difference between spending forecasts and outturn. In October 2024 we published a review which made a set of recommendations for enhancing the information provided by HMT that will allow us to improve our assessment of the risks to DEL. The recommendations were all agreed to by the Treasury and we intend to complete their implementation in the Autumn 2025 forecast.[35]
The analysis in this FER shows that we underestimated one-year-ahead locally financed spending in our March 2023 and March 2024 forecasts (see Box 3.1). Our in-year forecasts for local authority net borrowing also underestimated outturn for 2022-23, 2023-24, and initial outturn for 2024-25. It can be difficult to compare our forecast to the categories in which the ONS reports outturn and so to track the accuracy of the in-year forecasts. We have therefore started work with HMT and the ONS to better understand how the ONS produces estimates of local authority outturn, with the aim of better aligning methodologies. We will also consider the scope for improving the supply to the OBR, ONS and HMT of in-year data on local authorities.
The analysis in this FER shows that we underestimated one-year-ahead ‘National Accounts adjustments’ in our March 2023 and March 2024 forecasts. As a result, we are, with HMT, reviewing the methodologies used to produce this forecast, including assessing the source of the residuals between ONS outturn and HMT’s estimates of accounting adjustments. The aim is to minimise these residuals so that we have a fuller understanding of each element of the forecast.
4.7 In addition, we have identified a further set of modelling priorities based on wider analysis and issues we have identified through the process of producing recent forecasts:
Based on the analysis of the year-ahead forecast differences for 2023-24 and the initial assessment of the 2024-25 in-year forecast compared to initial outturn estimates, we are evaluating our approach to in-year estimates across the receipts forecasts. Currently we have several different techniques for using in-year tax receipts data as the basis for the forecasts for receipts for the full year and year-ahead. We will assess the relative performance of these approaches and consider the case for using the best-performing more systematically across the forecast.
On income tax we intend to use a greater range of data sources, sectoral information, and analysis of in-year patterns to inform the judgements on bonuses. We will also look further into the shortfall in self-assessment income tax against forecast in 2024-25, particularly the lower-than-expected partnership and dividend income that was a large contributor to the overall weakness.
We will develop the approach used to forecast the income and deduction components of onshore corporation tax, with a particular focus on improving the accuracy of the forecast of small company corporation tax. Where possible we will also look to simplify the forecast model for smaller components.
We are assessing whether the inheritance tax forecast methodology needs to be amended to more fully capture potential cohort effects due to wealth increasing across generations.
There are several aspects of the welfare spending forecast that we are reviewing, including a simplification of the housing benefit model to account for the end of legacy cases, and how to best model the impacts of employment, unemployment and inactivity on universal credit spending given the changing relationship between these variables and welfare spending in recent years.
Progress against previously identified priorities
4.8 The updated model assessment database on our website outlines progress against the priorities set out in the October 2023 FER in full detail. Progress on key areas not covered elsewhere in this FER is as follows:
A review of the relationship between financial liability growth and equity prices was completed in summer 2024 and led to changes to the regression equation used in the capital gains tax model.
In 2023 we implemented changes to the air passenger duty forecast model based on the updated passenger banding structure.
There is also a set of other previously identified model developments that we intend to further progress over the coming period. For receipts this includes updating the regressions underlying several income and deduction components of the onshore corporation tax forecast, updating the assumptions on achieved and future gas prices in the oil and gas revenues forecast, and reviewing the determinants underpinning other property in the capital gains tax forecast. For spending this includes a review of overpayments and of the ‘INFORM2’ modelling of unemployment for the universal credit forecast.
(1) Atkins, G., and L. Lanskey, Working paper No.19: The OBR’s forecast performance, August 2023.
(2) Van Geest, L., External Review of the Office for Budget Responsibility, February 2025.
(3) Atkins, G., and L. Lanskey, Working paper No.19: The OBR’s forecast performance, August 2023.
(4)Unless otherwise stated, we report the median (not mean) average forecast differences in this report as they are less skewed by shocks such as the Covid pandemic (as shown below in the right panel of Chart 2.1). In the online annex, we also report the mean differences and mean absolute differences at the one- to five-year forecast horizons.
(5) To calculate forecast differences, we always subtract forecast data from outturn data. Positive values therefore indicate higher-than-expected outcomes, while negative values indicate lower-than-expected outcomes.
(6) The OBR prepares forecasts on the basis of stated government policy. During fiscal events, the OBR prepares a ‘pre-measures’ forecast on the basis of existing policy onto which new policies to be announced alongside the fiscal event are then incorporated. In the absence of major changes to the state of the world, no new outturn data or judgements (other than that of policy) are taken on between pre- and post-measures forecasts.
(7) Van Geest, L., External Review of the Office for Budget Responsibility, February 2025. The review’s eighth recommendation is that “The OBR should focus more explicitly on highlighting uncertainty around its medium-term forecasts in a user-friendly manner.“ The review’s fourth recommendation is that “The OBR should establish a clear policy and workplan for model maintenance and development across the breadth of its work, with an initial emphasis on its economy forecasting.“
(8) See for example: CBO, CBO’s Economic Forecasting Record: 2023 Update, 2023.
(9) The annex tables are available on our website on the same page as this report.
(10) The -3.4 per cent figure shown in Table 2.1 is produced by taking the median across all the years in our sample of the median external forecaster’s cumulative growth forecast for that year. (The difference produced using an average cumulative five-year external forecast constructed by simply splicing together the median external prediction in each of the individual years as if they had been produced by a single forecaster, is smaller than this at only -0.9 per cent.) Part of the difference between the OBR and external forecasters’ figures reflects the smaller sample size for external forecasts at the 5-year horizon as autumn forecasts from externals do not extend to the fifth year comparable to OBR Autumn forecasts. Comparing only the spring OBR forecasts, the OBR median difference would be -2.7 per cent. Taking the means instead of the medians, the OBR and external averages would be similar: -3.7 per cent and -3.5 per cent, respectively.
(11) Atkins, G., and L. Lanskey, OBR working paper No.19: The OBR’s forecast performance, August 2023.
(12) The median provides the central value so is less skewed by outliers or extreme values because it depends only on the ordering of values, not their magnitude. The mean, as an average of all values, is highly sensitive to skewness and outliers.
(13) Box 2.1 in our 2024 Forecast evaluation report explores how we presented the high uncertainty around our inflation forecasts in the period following the Russian invasion of Ukraine.
(14) The values presented in Table 2.3 are different to those presented in Atkins, G., and L. Lanskey, OBR Working paper No.19: The OBR’s forecast performance, August 2023. This is due to a change in the sample of external forecasters, an increase in the forecasts analysed, revisions to nominal GDP and a change to the impact of classification changes on borrowing. However, the conclusions reached in the analysis of both are broadly similar.
(15) We have used the latest ONS Public Sector Finances data for comparisons against the latest available outturn. This explains why there may be differences for 2023-24 from our March 2025 Economic and fiscal outlook.
(16) For more detail on the accuracy of and uncertainties around our central point forecasts, see Box 1.1 in Atkins, G., and L. Lanskey, OBR Working paper No. 19: The OBR’s forecast performance, August 2023.
(17) Gas prices were another major contributor to inflation, rising from an average of 29 pence per therm in 2019-20 to 83 pence per therm in 2023-24. We did not publish gas price forecasts before March 2022.
(18) We provide this full breakdown where our economic ready reckoning infrastructure at the time of each forecast allows. Where this is not possible, we have assumed that receipts grow in line with the nominal economy with an elasticity of 1.1. The expansion of our ready-reckoning infrastructure should mean we will be able to provide a full breakdown for more receipts lines in future.
(19) See paragraph 3.63 of our November 2020 EFO for more detail on this change.
(20) Box 3.1 in the November 2023 EFOprovides more details of this effect.
(21) The March 2019 economic impact for value added tax (VAT) has been calculated using a modelling approach consistent with our March 2019 forecast. Since then, there has been a methodological change to our modelling approach for VAT that is accounted for in our March 2022 and March 2023 economic impact estimates.
(22) The Bank of England’s Asset Purchase Facility (APF) conducts the Bank’s operations for quantitative easing and tightening. APF interest losses are those incurred when the variable rate paid on central bank reserves exceeds the fixed rates paid on gilts held within the APF.
(23) The impact of higher interest rates is calculated on what was assumed to be the stock of debt at each of the forecasts analysed. A percentage of the impact of higher interest rates will therefore be captured within the ‘financing and other’ category as part of new debt issuance since each forecast, but we cannot accurately separate this using published outturn data.
(24) The main changes are the reclassification of rail operating companies as public corporations and business rates relief measures from DEL to AME, which reclassified £7.4 billion. These movements from DEL to AME were partially offset by the reclassification of the Land Registry and Companies House from AME to DEL in the March 2020 budget, which decreased DEL and boosted AME by £0.4 billion in 2023-24.
(25) The main components of this are the devolution of disability benefits to Scotland in March 2020 (£3.2 billion, offset by reductions in UK government welfare spending) and the Barnett consequentials of increases in UK government PSCE in RDEL (£3.0 billion)
(26) As with receipts, we do not directly ready reckon the impact of changes in the economy on some smaller parts of spending. For these lines, fiscal forecast differences cannot be separately identified from changes in the economy.
(27) Since 2010, the OBR’s one- and two- year ahead forecasts have been relatively centred around outturn, while the average external forecast tended to overestimate inflation. Our forecasts for 2023 go against this trend. Both the OBR and external forecasters have on average underestimated inflation in the medium term. They did so again in 2023, and by more than usual due to the energy price shock.
(28) Van Geest, L., External Review of the Office for Budget Responsibility, 2025. The review’s fourth recommendation is that “The OBR should establish a clear policy and workplan for model maintenance and development across the breadth of its work, with an initial emphasis on its economy forecasting“.
(29) OBR, Economic model development database, 2025.
(30) Murray, J., Working paper No. 4: A small model of the UK economy, 2012.
(31) Van Geest, L., External Review of the Office for Budget Responsibility, 2025. The review’s fifth recommendation stated that “The OBR should use clear criteria for additionality to the baseline forecast and the required evidence base for the policy measures it is willing to score dynamically; it should then apply these strictly.’ Its sixth recommendation stated that ‘The OBR should conduct an evaluation of its use of dynamic scoring to date”.
(32) OBR, Public investment and potential output: feedback and developments, April 2025.
(33) Brzezinski, A., Hantzsche, A., and Watson, J. Working paper No. 22: A new UK overlapping generations model, April 2025.
(34) See the supporting fiscal supplementary documents alongside this report on our website.
(35) See OBR, Review of the March 2024 forecast for departmental expenditure limits, October 2024.