
In our 2014 Welfare trends report, Chapter 4 reviewed the overall trends in welfare spending. In this box, we considered how responsive welfare spending is to the economic cycle by estimating the elasticity of benefits and tax credits spending as a share of GDP with respect to changes in the output gap (the difference between actual GDP and an estimate of its potential or underlying level). We found that the most counter-cyclical benefits have caseloads closely associated with the economic cycle whereas mildly counter-cyclical benefits are likely to only exhibit cyclicality due to spending varying less than GDP, thereby producing a denominator effect.
The economic cycle is one driver of trends in welfare spending. We can assess its importance by estimating the sensitivity of spending to changes in the output gap – the difference between actual GDP and an estimate of its potential or underlying level.
Table A reports the results of regressions estimating the cyclicality of different benefits and tax credits. It shows that spending on most benefits is counter-cyclical, but typically not that strongly.
Table A: The elasticity of benefits and tax credits to the economic cycle, 1985-86 to 2012-13
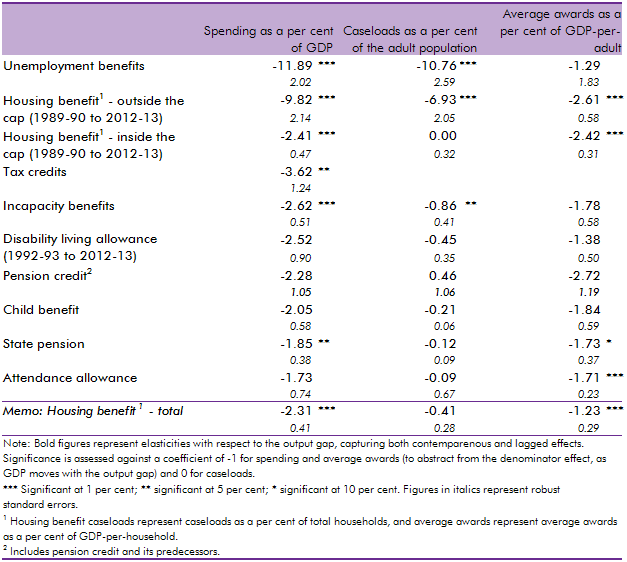
Table A also looks at whether it is the caseload or the average award that explains any counter-cyclical pattern in spending. It shows that the most counter-cyclical benefits have caseloads that are closely associated with the cycle, in particular jobseeker’s allowance (JSA) and the element of the housing benefit caseload that is passported for those claiming JSA (both of which are outside the welfare cap). The caseload for these benefits is directly related to the output gap in the sense that one component of that gap is the difference between the actual unemployment rate and its estimated structural or underlying rate. This is consistent with the Government’s stated reason for not including these elements of spending in the welfare cap, due to their role as an automatic stabiliser helping to cushion the economy from the cycle.
For the mildly counter-cyclical benefits, their cyclicality appears to be due to the average award varying less than the output gap rather than the caseload being sensitive to the cycle. Counter-cyclical spending as a share of GDP on these benefits reflects a denominator effect – the cash value of GDP tends to fluctuate more over the cycle than the cash value of spending.