
Box sets » Public spending » Welfare spending
The Pathways to Work Green Paper announced a range of welfare measures, some of which we have not incorporated in this forecast. In this box, we explained why some measures were not included, and indicated what risks they pose to our welfare spending and labour supply forecasts.
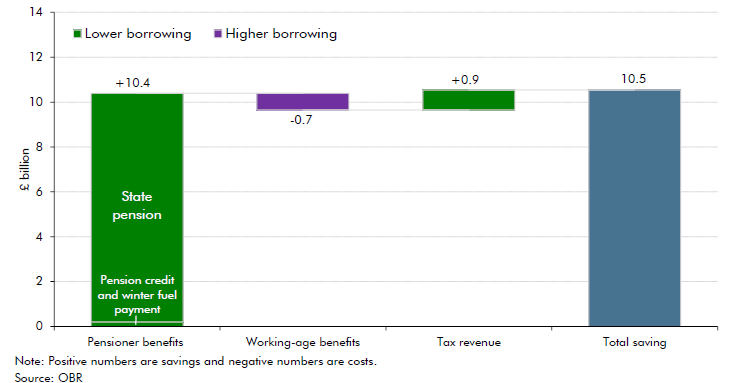
As life expectancy has increased, successive governments have increased the state pension age, and it next increases between 2026 and 2028 from 66 to 67. In this box, we estimated the impact of this increase on pensioner welfare spending, working-age welfare spending, and tax revenue.
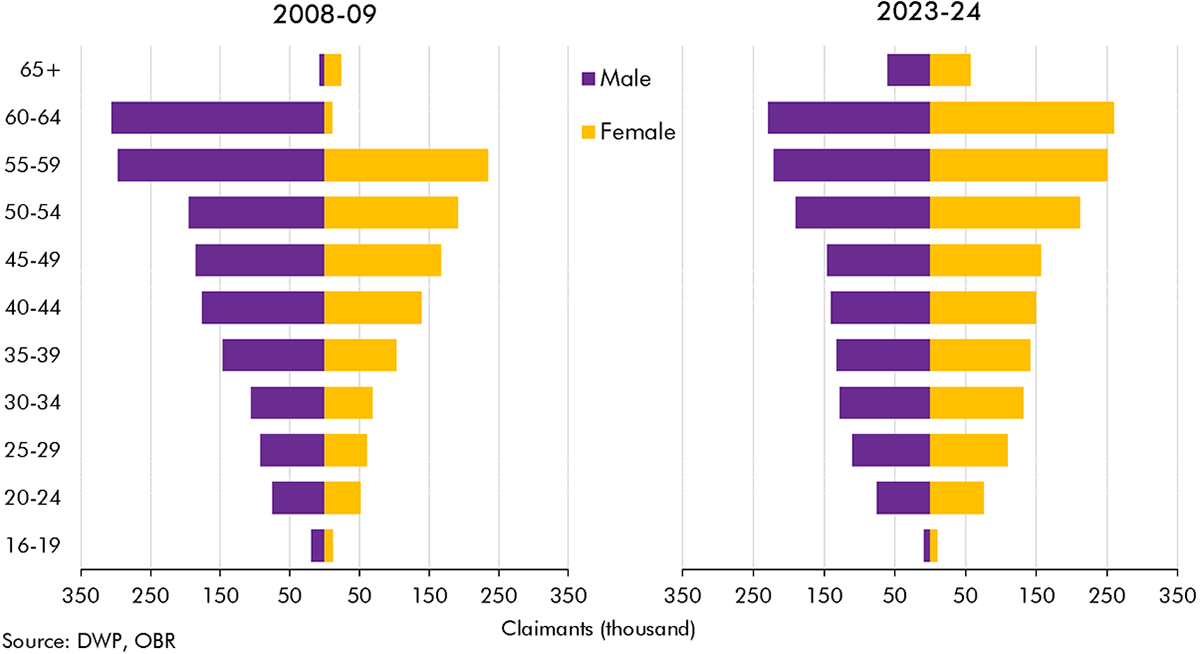
The rise in incapacity benefits after 2013-14 coincided with a rise in the state pension age. In this box we explained how much of the change in incapacity benefit caseload was explained by rises in the state pension age and the ageing of the population.
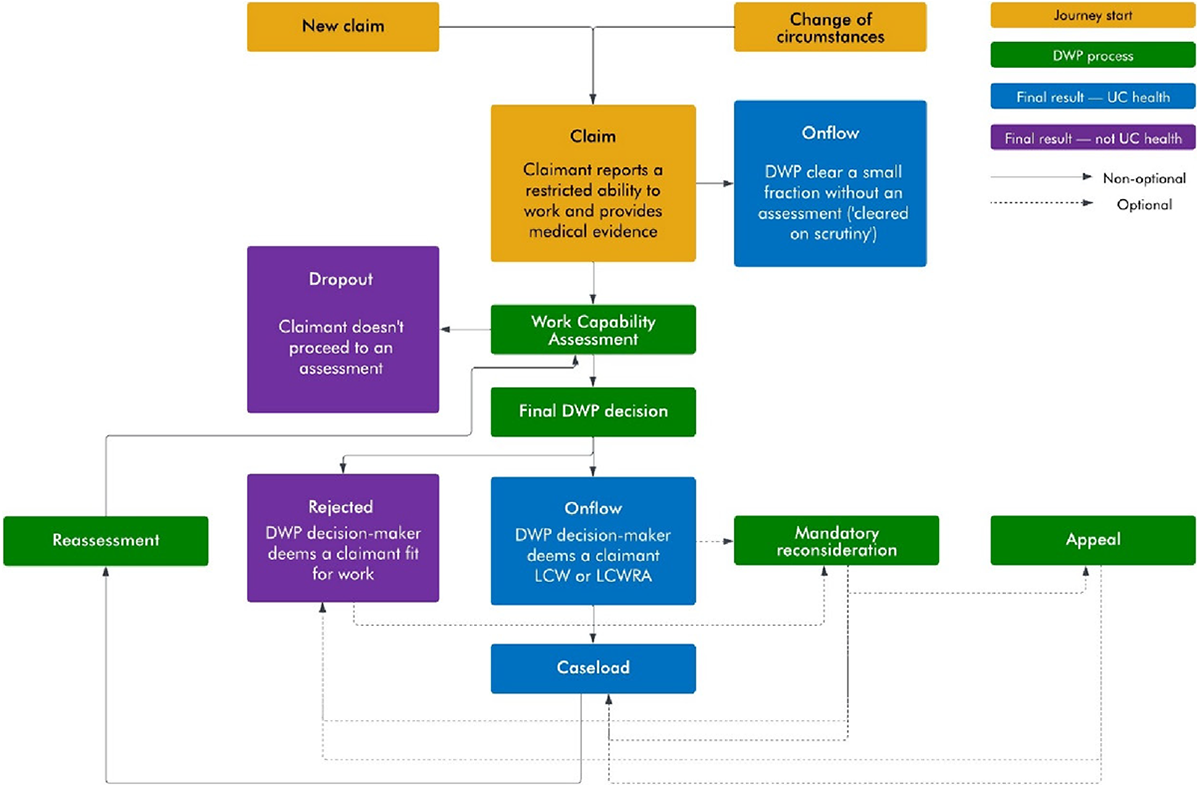
There are several stages before a claimant joins an incapacity benefit. In this box we explained the stages involved in joining either the less-severe (LCW) or more-severe (LCWRA) groups under universal credit, and differences in the predecessor employment support and allowance benefit.
Both incapacity and disability benefit onflows have grown substantially since 2018-19. In this box we compared the different drivers of these respective increases in onflows and drew some lessons from the granular disability benefit data for how incapacity onflows may have been changing.
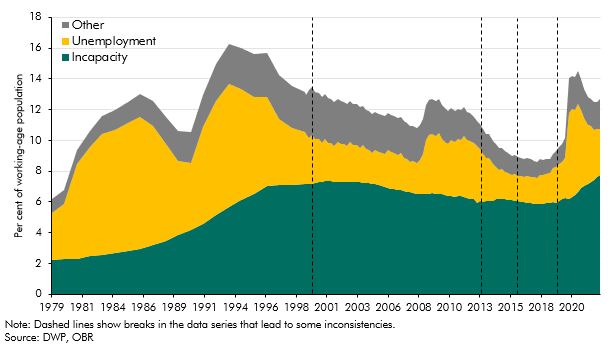
Benefits for working-age claimants with health problems have changed significantly over the last thirty years through the introduction of new benefits and assessments. This box described how the UK welfare system operates for working age claimants with and without health problems, and how this has changed over time.
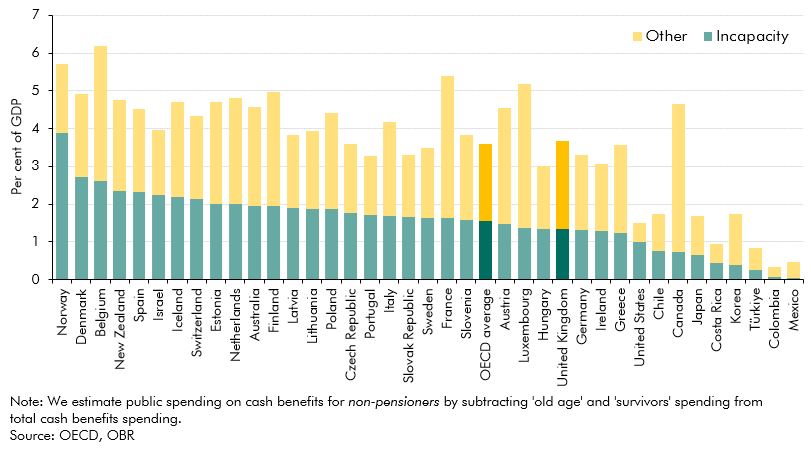
The UK spent close to the OECD average on non-pensioner cash benefits in 2019. This box compared the provision and generosity of health-related welfare across countries, drawing on several international studies.
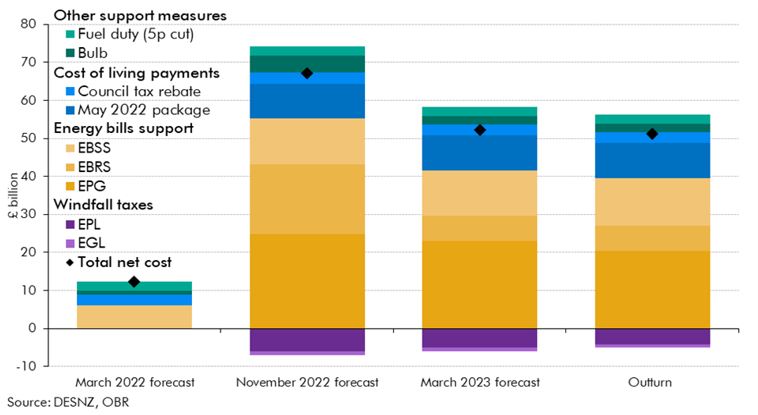
Russia’s invasion of Ukraine in late February 2022 led to a surge in wholesale and retail energy prices, and a subsequent rise in inflation to a four-decade high. To support households and businesses, the Government introduced a series of policies during 2022 which were a key factor pushing spending and borrowing outturn in 2022-23 above both our March 2021 and March 2022 forecasts. This box examines how the costs associated with this policy response in 2022-23 evolved over successive forecasts and in initial outturn.
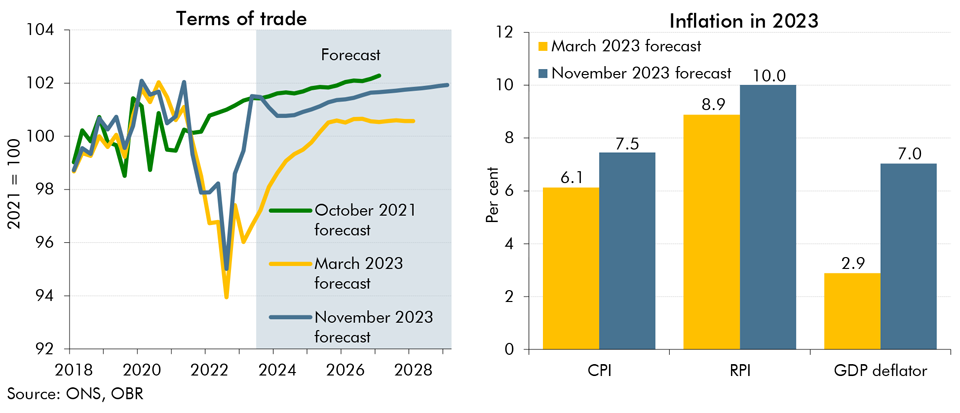
In our November 2023 forecast we expect inflation to be both more persistent and more domestically generated than in March. In this box we explored the reasons behind our assessment for inflation to be more domestically rather than externally driven and its implications for the public finances.
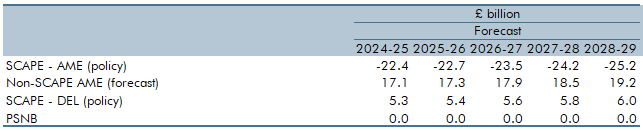
The new SCAPE discount rate, to be implemented in April 2024, increases the present value of future pensions payments and in turn causes employer contributions to rise. Box 4.4 explained the SCAPE rate change and its overall impact on the public finances.
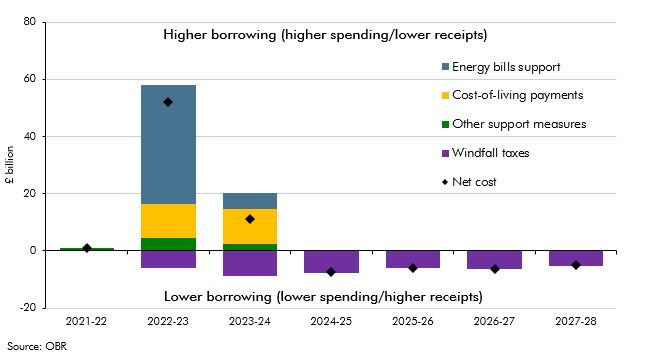
In the March 2023 EFO we estimated that the policy package in response to the rise in energy prices would cost £78 billion in 2022-23 and 2023-24. This box assessed how the cost of the UK Government's response compares internationally.
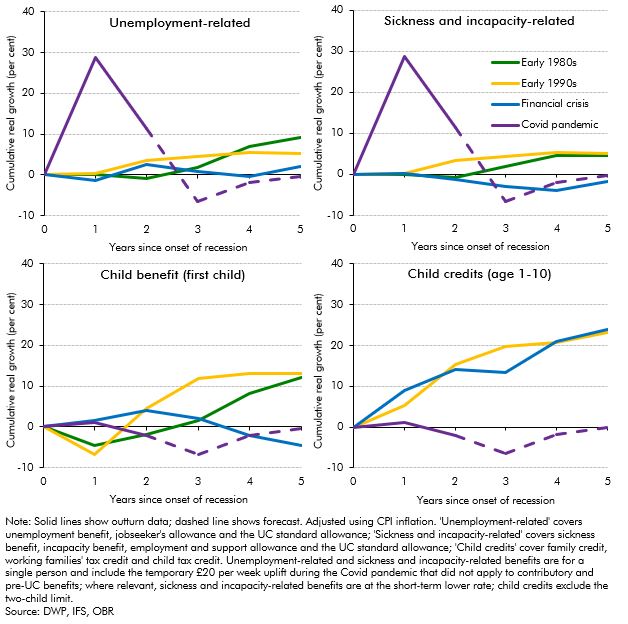
The real-terms value of benefits was forecast to fall by around 5 per cent in 2022-23 (£12 billion in total) before catching up the year after, largely due to the significant rise in inflation and the lag in benefit uprating. In this box we compared these post-pandemic uprating dynamics to the real value of non-pensioner benefit rates following the previous three recessions. This showed that the forecast trough in the real value of benefits was deeper in the wake of the pandemic than for any of the previous three recessions.
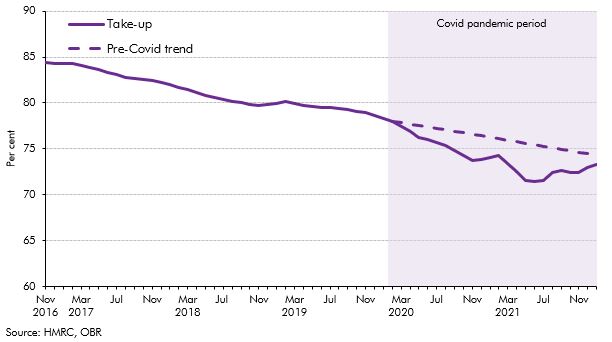
Take-up of child benefit had been declining since 2012-13, but this downwards trend accelerated at the onset of the Covid pandemic in March 2020, which resulted in a steep decline in take-up over the subsequent 18 months. In this box, we considered the main drivers of the child benefit caseload and the effect the pandemic had on each of them. We set out the reasons why the pandemic contributed to lower take-up, and then considered the medium-term impact of the pandemic-driven drop in take-up on our forecast.
On 8 July, the Chancellor announced further measures to support the economy as the lockdown is eased, which we were not notified of in sufficient time to incorporate into our scenarios. This box described the measures included in the package and the costs as estimated by the Treasury.
The transition to universal credit (UC) from legacy systems is a key component of our welfare spending forecast, as UC spending will represent 27% of total welfare spending by 2024-25. As detailed in our 2018 Welfare Trends report (WTR), we construct UC spending by forecasting the legacy system as though UC did not exist and then incorporate an estimate of the marginal cost of UC. This allows us to base as much of the forecast on as much administrative data as possible, but it does not directly reflect the real-world change in spending on legacy benefits as spending on UC rises. This approach is unavoidable at present but generates inevitable difficulties for our forecast. This box explored the challenges associated with this approach.
In February 2020, the Government announced its intention to introduce a ‘points-based’ migration system from January 2021 that will align migration policy for EU and non-EU migrants. In this box we looked at the effect of the new migration regime on our borrowing forecast.
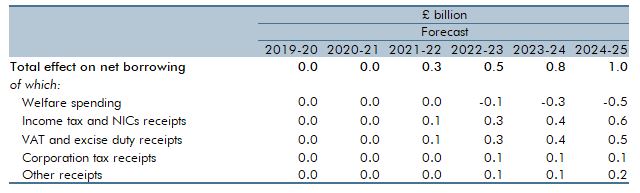
In June 2019 the BBC announced its decision to begin means-testing eligibility for Free TV licences for those aged 75 and over, based on households containing someone aged 75 or over and also claiming pension credit. This box explores the impact the BBC’s policy could have on pension credit take-up and welfare spending.
Measures of reported disability prevalence are often subject to great variability and this can make drawing precise conclusions from them difficult. In this box, we considered two examples where measures varied. The first related to differences between Labour Force Survey and General Health Survey measures of working-age disability prevalence and the second to large changes in the former. We discussed differences in methodology and changes in attitudes as possible drivers.
Public financial support for disabled people extends beyond the extra-costs disability benefits and includes several other welfare payments. This box gave an overview of some of the most important interactions between disability and other benefits that provide support for disabled people.
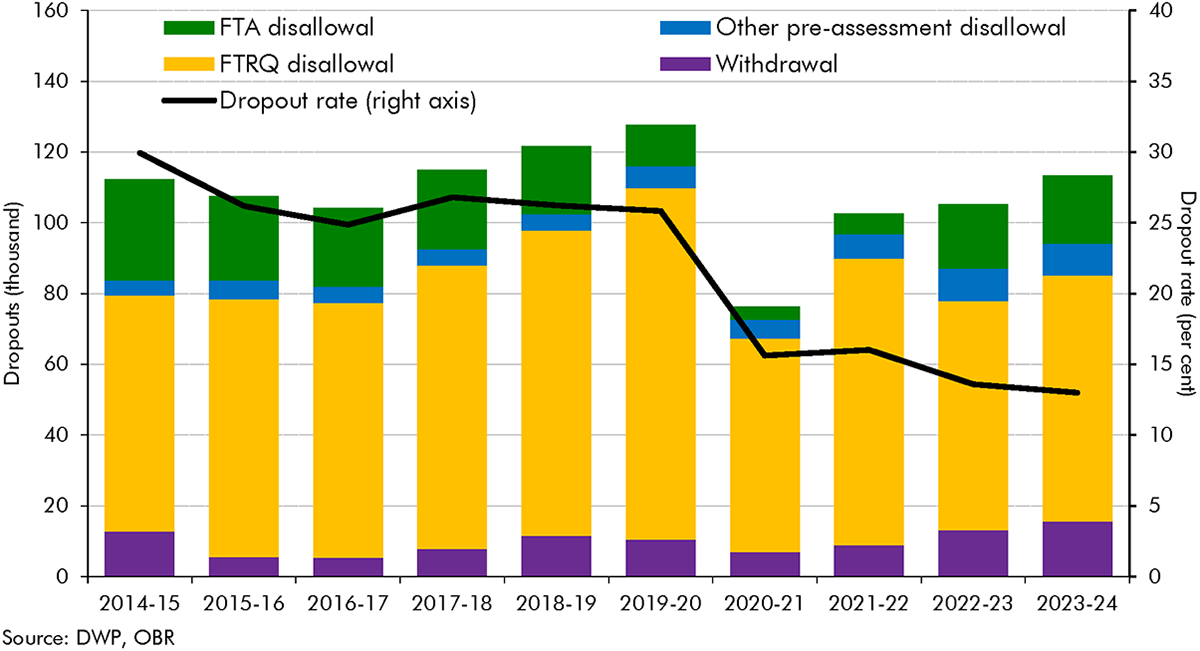
Our ability to forecast accurately is heavily dependent on the quality of the data we can use. In this box we explained how statistical and expenditure data could be distorted by problems in delivery of the benefit, and the difficulties this creates in identifying emerging trends in the data.
There are several possible approaches to forecasting benefit spending. In this box we outlined the key issues the modelling of disability benefits needed to address, the three approaches we used to forecast spending, and the strengths and limitations of each, concluding that a combination of approaches was better than reliance on any single one.
The Government commissioned two reports published in 2017 to inform its review of the State Pension age (SPA): an independent review by John Cridland and a report by the Government Actuary’s Department (GAD). This box summarised the key findings from these two reports.
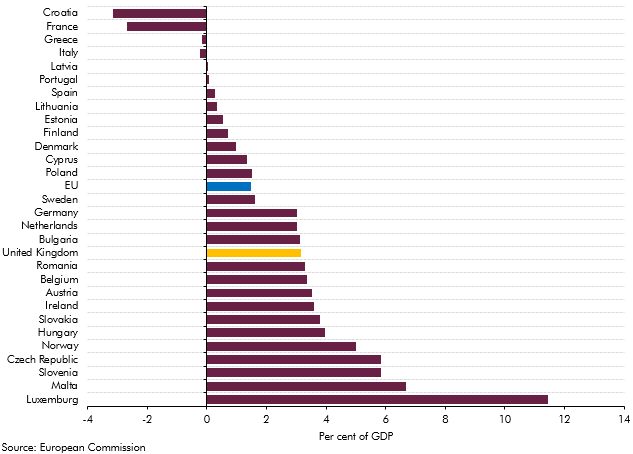
Our 2018 long-term fiscal projections suggested that, if left unaddressed, the public sector finances would come under increasing pressure over the next 50 years. This box compared our long-term age related spending projections over the period from 2025 to 2065 with those presented in the European Commission's 2018 Ageing Report.
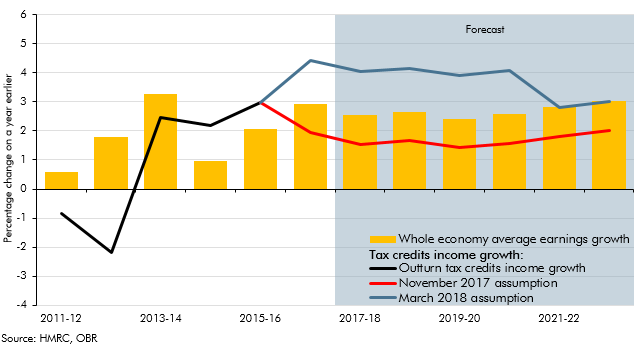
Spending on tax credits came in consistently lower than our forecasts from 2014-15 onwards. In our March 2018 EFO we increased our assumption for the growth in incomes of tax credits families relative to headline earnings growth, significantly lowering our tax spending forecast. This box set out the analysis that underpinned this change in forecasting assumption.
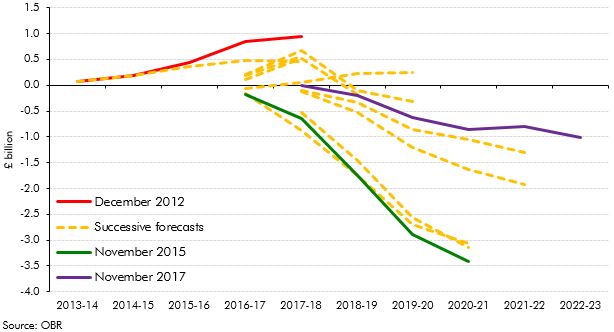
In our 2018 Welfare trends report, Chapter 3 looked at the design of universal credit, including how the 'work allowances' within it have been changed since the policy was first factored into our forecasts. This box looked at how our estimates of the net cost or saving from UC relative to the legacy benefits have evolved over time, and the important part played by Government decisions to reduce the UC work allowances.
In our 2018 Welfare trends report, Chapter 3 looked at the design of universal credit, including the role to be played by UC work coaches setting conditions and applying sanctions to encourage claimants to seek and progress in work. This box outlined the role, responsibilities and renumeration of work coaches, as set out in DWP's candidate information pack for applicants for the role.
In our 2018 Welfare trends report, Chapter 4 described how we model the effects of universal credit on spending. This draws heavily on two models owned and operated by DWP - the Policy simulation model (PSM) and the Integrated forecasting model (INFORM). PSM is a static micro-simulation model that uses Family Resources Survey (FRS) data to analyse policy changes. This box detailed how the FRS is used in PSM and some of the issues that raises for our UC forecast.
In our 2018 Welfare trends report, Chapter 4 described how we model the effects of universal credit on spending. This draws heavily on two models owned and operated by DWP - the Policy simulation model (PSM) and the Integrated forecasting model (INFORM). INFORM is a dynamic micro-simulation model that uses DWP administrative data to forecast the caseloads for different benefits. This box described how INFORM is used in our UC forecast and some of its limitations.
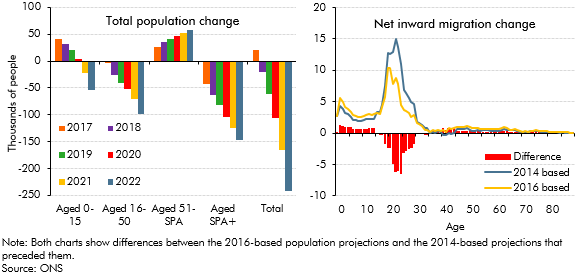
The Office for National Statistics (ONS) published new UK population projections in October 2017, based on 2016 population estimates and updated assumptions for fertility, mortality and net migration. This box compared the latest projections with the previous 2014-based principal projections that underpinned our March 2017 forecast and summarised their effects on our November 2017 fiscal forecast.
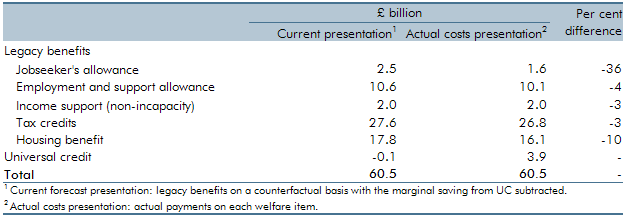
A key issue in our welfare spending forecast is the transition to universal credit (UC) from the existing ‘legacy’ benefits and tax credits systems. In our March 2017 Economic and fiscal outlook, our central forecast was constructed by forecasting the ‘legacy’ system as though UC did not exist, then subtracting from it an estimate of the marginal saving associated with rolling out UC. This box presented estimates for actual gross spending in 2017-18 on UC and the legacy benefits and tax credits that it is replacing.
In each Economic and fiscal outlook we publish a box that summarises the effects of the Government’s new policy measures on our economy forecast. These include the overall effect of the package of measures and any specific effects of individual measures that we deem to be sufficiently material to have wider indirect effects on the economy. In our March 2016 Economic and Fiscal Outlook, we made a number of economy forecast adjustments to GDP, business investment, wage growth, inflation and the housing market.
In each Economic and fiscal outlook we publish a box that summarises the effects of the Government’s new policy measures on our economy forecast. These include the overall effect of the package of measures and any specific effects of individual measures that we deem to be sufficiently material to have wider indirect effects on the economy. In the 2015 Autumn Statement and Spending Review, we made a number of adjustments to real and nominal GDP, the labour market, inflation, and the housing market.
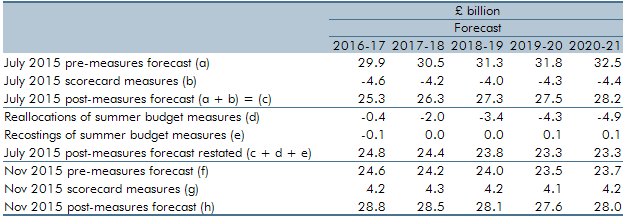
The July 2015 Budget included a large number of complex welfare measures that cut across multiple benefits with many interactions. At Autumn Statement 2015, we identified a number of measures where interaction effects had not been correctly estimated or classified. In this box of our November 2015 EFO, we discussed the re-estimation and reclassification of the interaction effects of a number of welfare measures. This included the reclassification of three tax credits measures and the measure extending the `lone parent obligation’ to ensure that these costings were consistent with our marginal universal credit (UC) forecast. The impact of cuts to tax credits on housing benefit entitlement were also re-estimated and reallocated to the housing benefit forecast from the tax credits forecast as the effect had previously been incorrectly allocated to tax credits.
In each Economic and fiscal outlook we publish a box that summarises the effects of the Government’s new policy measures on our economy forecast. These include the overall effect of the package of measures and any specific effects of individual measures that we deem to be sufficiently material to have wider indirect effects on the economy. In the July 2015 Economic and fiscal outlook, we made a number of adjustments to real and nominal GDP, the labour market, inflation, business and residential investment, and the housing market.
In Chapter 4 of our December 2014 EFO, we discussed the fiscal outlook for 2014-15 to 2018-19. In this box, we discussed revisions we made to the forecast in light of reforms to incapacity and disability benefits. Spending on incapacity benefits was revised up by £0.7 billion a year on average between 2014-15 and 2018-19, largely reflecting a lower-than-expected number of Work Capability Assessments carried out by the Department for Work and Pension’s private contractors. On the basis of the latest evidence, spending on disability benefits was also revised up by £0.7 billion a year on average between 2014-15 and 2018-19. This was largely due to higher than expected success rates for new claims to the personal independence payment.
In Chapter 4 of our December 2014 EFO, we discussed the fiscal outlook for 2014-15 to 2018-19. In this box, we discussed the latest universal credit rollout plan following the 2014 universal credit business case. Whilst we agreed that the plan to fully rollout universal credit for jobseeker’s allowance cases by March 2016 was central, we decided that the migration plan for claimants of other legacy benefits was still highly uncertain and so implemented a six month delay to the plans for our forecast. This had the effect of reducing the volume of migrations in all years of the forecast but did not substantially alter the universal forecast given that it marginal to the legacy benefits.
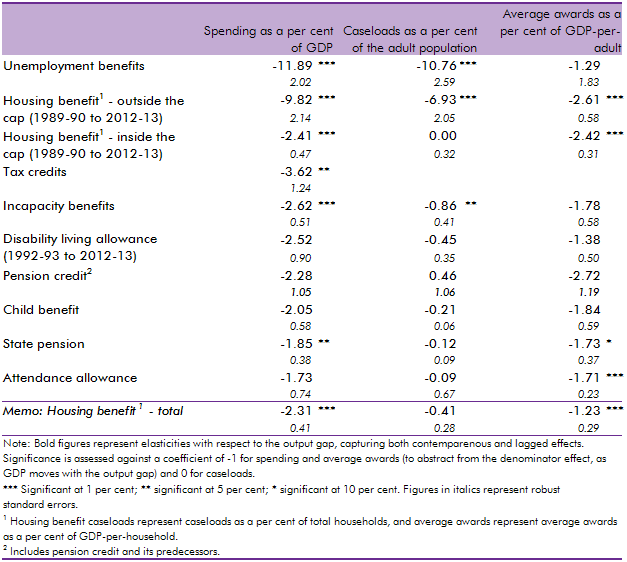
In our 2014 Welfare trends report, Chapter 4 reviewed the overall trends in welfare spending. In this box, we considered how responsive welfare spending is to the economic cycle by estimating the elasticity of benefits and tax credits spending as a share of GDP with respect to changes in the output gap (the difference between actual GDP and an estimate of its potential or underlying level). We found that the most counter-cyclical benefits have caseloads closely associated with the economic cycle whereas mildly counter-cyclical benefits are likely to only exhibit cyclicality due to spending varying less than GDP, thereby producing a denominator effect.
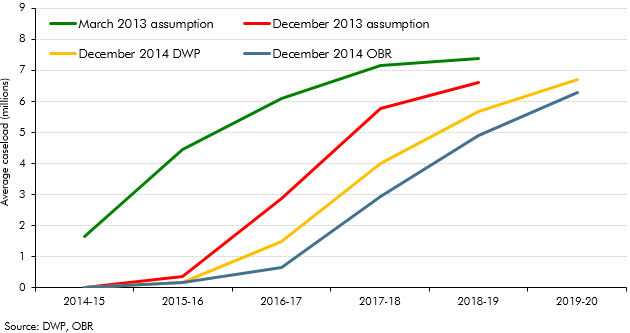
In our 2014 Welfare trends report, Chapter 4 reviewed the overall trends in welfare spending. In this box we discussed the latest Universal Credit (UC) forecast at the time of writing. This forecast assumed UC would roll-out slowly during 2014-15 and 2015-16 before accelerating in 2016-17 and 2017-18, by which time 5.8 million people were expected to be receiving the benefit. We highlighted that the roll out of UC had already been subject to previous delays and that the decision to produce a top-down UC forecast helped mitigate the uncertainties caused by delivery challenges. We then decomposed the marginal UC forecast into its constituent gross savings and gross costs forecasts.
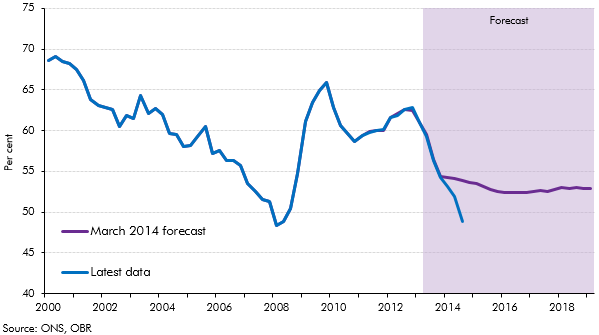
In our 2014 Welfare trends report, Chapter 8 considered spending on unemployed people. This box compared outturn data on unemployment and claimants of unemployment benefits to the levels implied by our March 2014 forecast. As the economy performed better than anticipated in our March 2014 forecast, the ratio of claimants of unemployed benefits to the Labour Force Survey (LFS) measure of unemployment deviated from our projections. This was largely due to a drop in the rate of inflows into unemployment benefits and a rise in the rate of outflows from unemployment benefits, though an increase in the number of people looking for jobs but not claiming unemployment benefits may have increased LFS unemployment and so been a contributing factor.
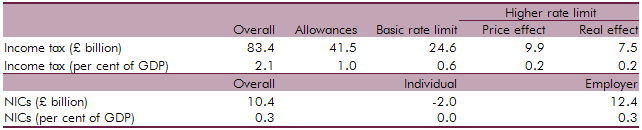
We updated our July 2013 analysis of fiscal drag on income tax and NICs to reflect new data, our latest assumptions and the effect of measures announced over the past year. This box outlined how fiscal drag effects income tax and NICs receipts and the long-term assumptions used.
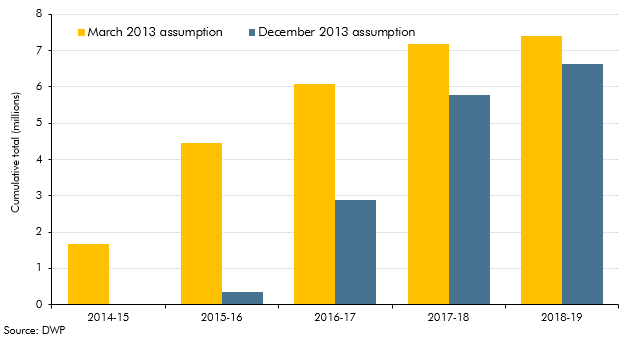
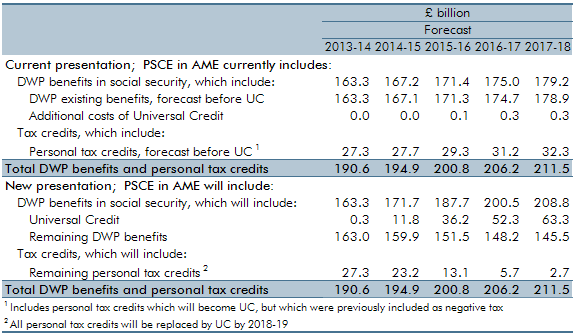
In Chapter 4 of our December 2013 EFO, we discussed the fiscal outlook for 2013-14 to 2017-18. In this box, we discussed the delays to the Government’s universal credit rollout plan. Compared to the March 2013 rollout plan, large increases in the universal credit caseload were assumed to start later than previously planned in 2016 and 2017. Fewer people were also expected to be on universal credit at the end of the forecast horizon, with 700,000 fewer claimants assumed to have migrated by the end of 2017-18 compared to the March 2013 rollout plan. We explained that the changes to the rollout schedule was a key source of change in the profile of our forecast relative to March 2013, with lower spending up to 2015-16.
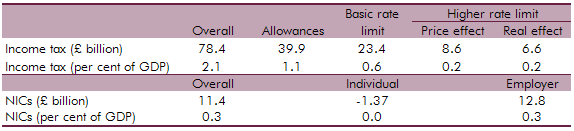
We updated our 2012 analysis of fiscal drag on income tax and NICs to reflect new data, our latest assumptions and the effect of measures announced over the past year. This box outlined how fiscal drag effects income tax and NICs receipts and the long-term assumptions used.
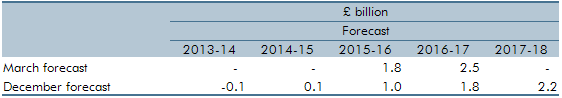
In Chapter 4 of our March 2013 EFO, we discussed the fiscal outlook for 2013-14 to 2017-18. In this box, we introduced a new marginal cost presentation of the universal credit forecast and also outlined contributing factors to changes in the forecast. These factors included policies announced at the 2012 Autumn Statement and changes to a number of the universal credit policy parameters as well as refinements to the methodology and assumptions used to forecast universal credit. The analysis in this box has since been superseded by developments in the universal credit forecast.
In each Economic and fiscal outlook we publish a box that summarises the effects of the Government’s new policy measures on our economy forecast. These include the overall effect of the package of measures and any specific effects of individual measures that we deem to be sufficiently material to have wider indirect effects on the economy. In our December 2012 Economic and Fiscal Outlook, we made adjustments to our forecasts of real GDP, inflation and property transactions
In Chapter 4 of our December 2012 EFO, we discussed the fiscal outlook for 2012-13 to 2016-17. In this box, we discussed changes to the provisional universal credit forecast that was included in our March 2012 EFO. Changes to the forecast were due to a number of factors, including policies announced at Budget 2012 and finalisation of policy parameters in universal credit as well as .refinements to the methodology and assumptions used to forecast universal credit. We also discussed the main uncertainties in the forecast, which largely related to the unpredictability given the scale of the policy. The analysis in this box has since been superseded by developments in the universal credit forecast, though many of the key uncertainties remain.
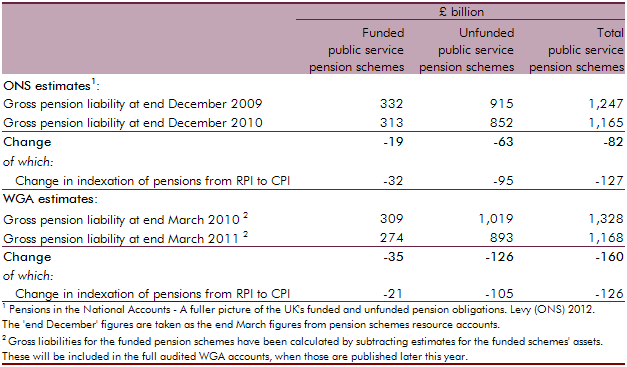
In April 2012, the Office for National Statistics (ONS) published the first set of new statistics on the total gross liabilities of UK pension providers, including the UK government. This box explored how the ONS’ pension liability estimates were calculated for public service pensions and state pensions, and compared the public service estimate to the Whole of Government Accounts (WGA) methodology.
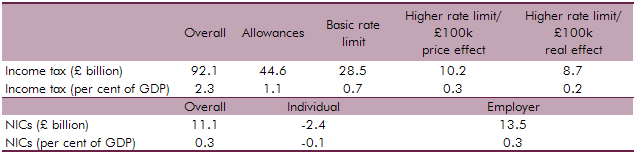
We updated our 2011 analysis of fiscal drag on income tax and NICs to reflect new data, our latest assumptions and the effect of measures announced over the past year. This box outlined how fiscal drag effects income tax and NICs receipts and the long-term assumptions used.
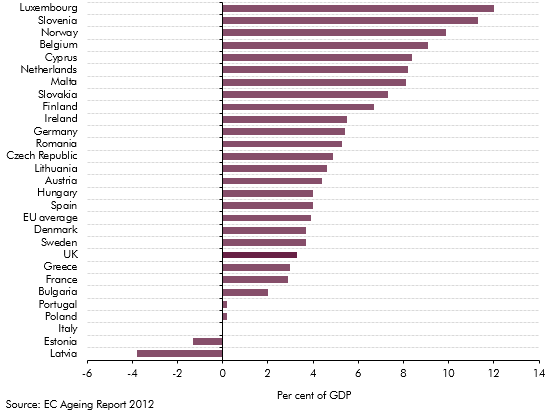
The European Commission (EC) produces its own analysis of ageing pressures for member states every three years. This box contrasted the forecast made by the EC and the OBR for UK age related spending such as pensions, health care and long-term care.
In each Economic and fiscal outlook we publish a box that summarises the effects of the Government’s new policy measures on our economy forecast. These include the overall effect of the package of measures and any specific effects of individual measures that we deem to be sufficiently material to have wider indirect effects on the economy. In our March 2012 Economic and Fiscal Outlook, we made adjustments to our forecasts of real GDP, business investment and inflation.
This box set out the various impacts that higher inflation has on the public finances. These include direct effects (e.g. on income tax and debt interest spending), the impact on nominal tax bases (such as household consumption) and the impact on departmental spending.