
Benefits for working-age claimants with health problems have changed significantly over the last thirty years through the introduction of new benefits and assessments. This box described how the UK welfare system operates for working age claimants with and without health problems, and how this has changed over time.
This box is based on DWP and OBR data from June 2023 .
To understand the possible role that the welfare system may have played in the rise in health-related inactivity, one has to understand its structure. Of the £100.6 billion the Department for Work and Pensions is expected to spend on working-age claimants in 2023-24, the majority is on universal credit (UC) and its legacy equivalents (£73.7 billion), and on disability benefits (£18.9 billion). The latter is, these days, mainly in the form of personal independence payment (PIP), which has largely replaced disability living allowance (DLA) for those of working age.a
UC – in a decade-long process of being rolled out to replace a number of different benefits and tax creditsb – is now the main means-tested, working-age benefit for people in a range of circumstances, including those in and out of work and people with different income needs and work capabilities in relation to housing, caring responsibilities and health. We do not attempt to describe all the features of this complex and far-reaching benefit here,c but instead focus on the experience of out-of-work claimants with health problems, in comparison to those without.
Claimants can report that they have a health condition or disability that affects their ability to work when they apply for UC. They provide a range of medical evidence from health professionals (including a ‘fit note’) alongside completing a health-related questionnaire. This evidence is then referred to healthcare professionals contracted by DWP who conduct a Work Capability Assessment (WCA), in most cases including an appointment over the phone, via video call or in person. These assessments place out-of-work claimants into one of three groups:
- ‘Fit for work’ (which we term ‘unemployment’), which means claimants are expected to prepare for, look for and take up work. They receive the standard UC allowance (around £4,400 a year for single adults aged 25 and over, plus any additions for couples, children and housing costs), and are placed in the ‘intensive work search’ conditionality group, meaning they can be required to search for up to 35 hours a week alongside attending weekly meetings with a work coach. 1.3 million out-of-work or very-low-earning claimants were in this conditionality group in 2022-23.d
- ‘Limited capability for work’ (LCW, which we term ‘less severe incapacity’), which means claimants cannot work now but are expected to prepare for working in future. Their out-of-work UC award is the same as that for those found fit for work (although they keep more of their earnings if they move into work via a higher ‘work allowance’). They are placed in the ‘work preparation’ conditionality group, meaning they meet with a work coach regularly and may be expected to undertake training or other preparation activities. Including those in the equivalent part of the legacy system (largely income-based employment and support allowance (ESA)) and the contributory system, there were 425,000 claimants in this group in 2022-23 (as shown in Chart 2.9, above).
- ‘Limited capability for work and work-related activity’ (LCWRA, which we term ‘more severe incapacity’), which means claimants are not expected to look for or prepare for work. They receive an additional £4,700 a year on top of the £4,400 standard allowance (more than doubling the standard award for single claimants), and face no conditionality. Including those in the equivalent parts of the legacy and contributory systems, there were 2.3 million claimants in this group in 2022-23 (Chart 2.9, above).
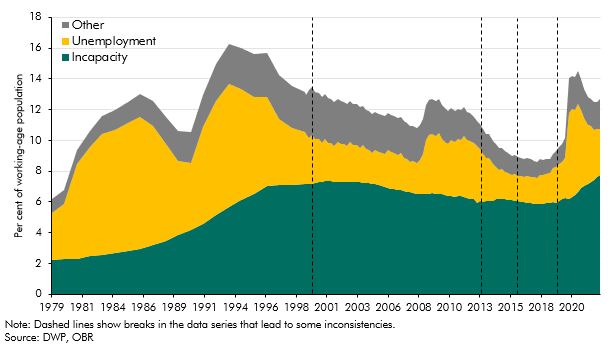
Adding those waiting for their WCA to the LCW and LCWRA groups, 3.2 million claimants were in the health-related part of the means-tested, working-age welfare system in 2022-23, which we collectively term the ‘incapacity’ caseload.e Chart E puts this group within the UC and predecessor systems in the context of wider means-tested welfare caseloads since the late 1970s – split into incapacity, unemployment and ‘other’ (historically, mainly benefits for parents and those with caring responsibilities). The tightening of conditionality for unemployment benefit in the second half of the 1980s was followed by a simultaneous fall in the unemployment caseload and rise in the incapacity caseload. The growth of the incapacity caseload then slowed from 1995, when ‘invalidity benefit’ was replaced with the less generous ‘incapacity benefit’, which introduced the gateway ‘all work test’, effectively reducing eligibility. The incapacity caseload then began to decrease for the first time following the introduction of reassessments in 2000. It continued to decline as ESA replaced incapacity benefit from 2008 onwards, thanks in part to the WCA acting as a more stringent gateway. But numbers on incapacity benefits have increased sharply over the past three years (some of which is likely to relate to the introduction of UC counting more people within the incapacity group relative to the legacy systemf), reaching an all-time high of 7.8 per cent of working-age adults in late 2022.
Chart E: Working-age, out-of-work benefit caseloads over time
The other health-related benefit that working-age claimants can claim is personal independence payment (PIP), and previously disability living allowance (DLA), which we collectively term ‘disability’ benefits. These are intended to meet extra costs associated with daily living and mobility for those with long-term health conditions. They are not means-tested, not subject to conditionality and can be claimed at the same time as other benefits and by people either in or out of work. In practice, they are much more commonly claimed among those out of work – only around 16 per cent of the working-age PIP caseload works.g Similar to incapacity benefits, to claim disability benefits a claimant needs to submit evidence of their disability, and typically undergoes an assessment with a healthcare professional. There are various different award levels for PIP depending on need, ranging from £1,400 to £9,000 a year.
This box was originally published in Fiscal risks and sustainability – July 2023