
Box sets » Economic and fiscal outlook - November 2023
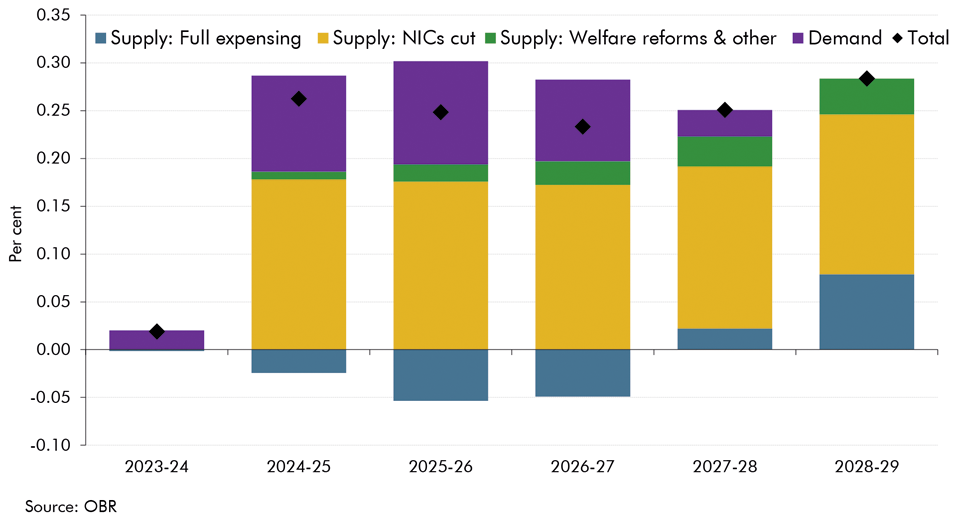
In each Economic and fiscal outlook we publish a box that summarises the effects of the Government’s new policy measures on our economy forecast. These include the overall effect of the package of measures and any specific effects of individual measures that we deem to be sufficiently material to have wider indirect effects on the economy. In our November 2023 Economic and fiscal outlook, we adjusted our forecast to account for permanent full expensing and fiscal loosening. And, we considered the effects of policy to boost employment on our potential output forecast.
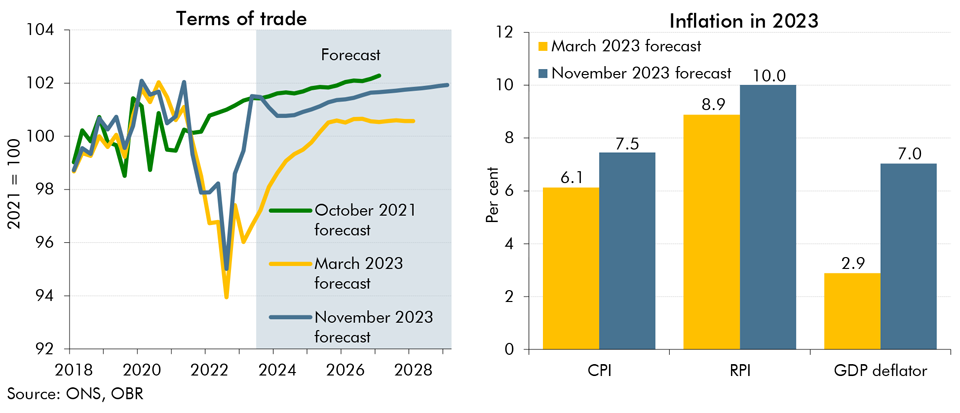
In our November 2023 forecast we expect inflation to be both more persistent and more domestically generated than in March. In this box we explored the reasons behind our assessment for inflation to be more domestically rather than externally driven and its implications for the public finances.
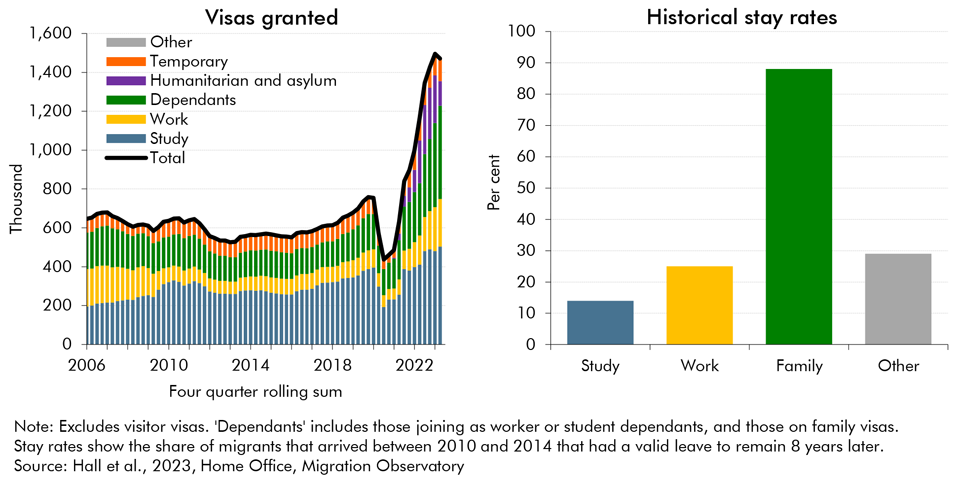
Net migration to the UK increased substantially in recent years but the ONS's population projections, that normally underpin our forecast, did not fully account for that rise at the time. In this box, we explored recent trends in migration and outlined our revised near-term migration forecast. We also examined how likely the migrants were to participate in the labour market.
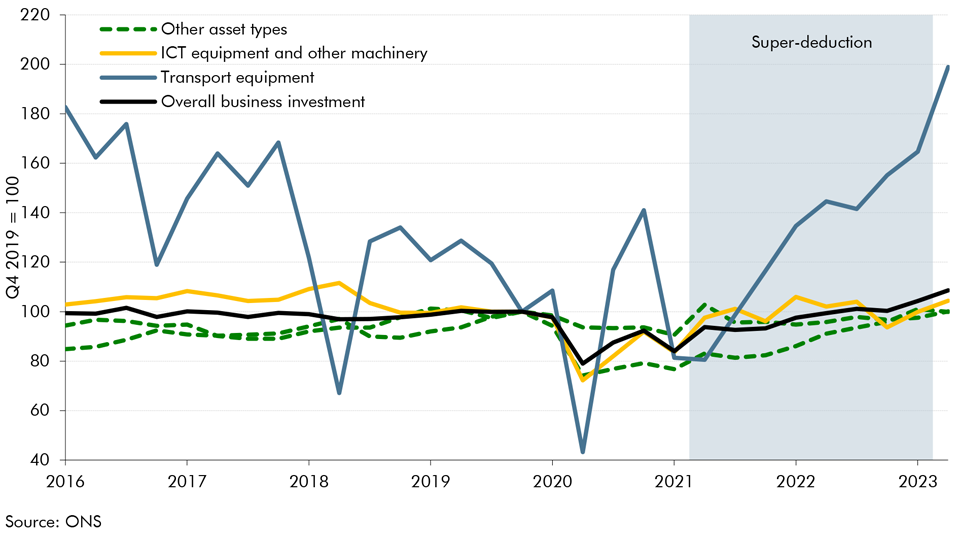
Over the last 3 years, the UK corporation tax system has witnessed four major changes which have consequences on the outlook for business investment. In this box, we explored the effect of the corporation tax rate rise and the super-deduction on investment, before assessing the impact of moving from temporary to permanent full expensing as announced in this Autumn Statement.
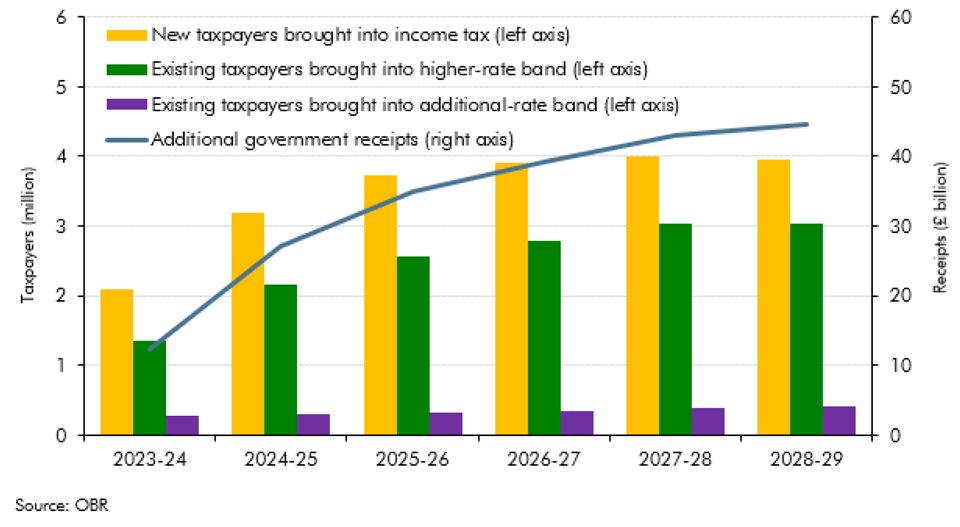
This box discussed the continuing impact of the multiple freezes and changes to personal tax thresholds between March 2021 and November 2022. It provided an update on the estimated receipts from these policies, and the additional number of tax payers by tax band.
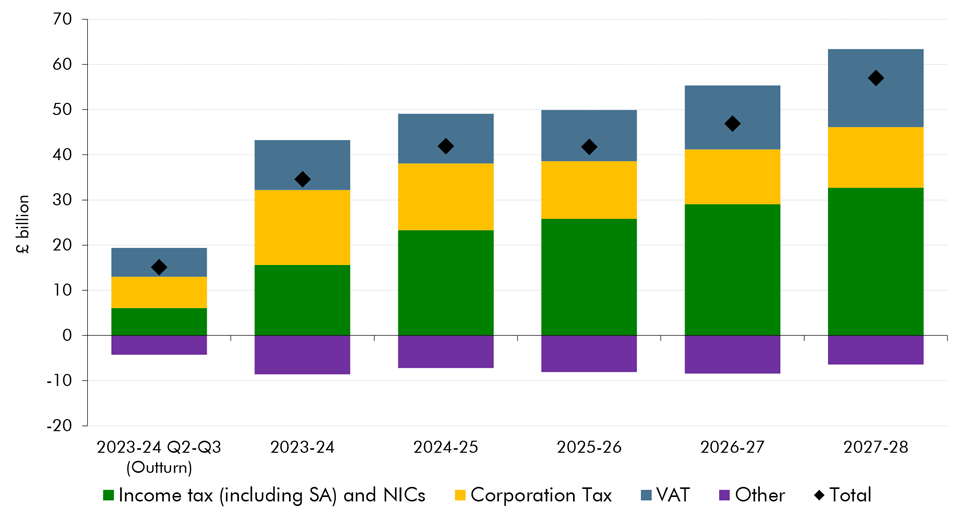
We have made a significant upward revision to our pre-measures receipts forecast. This box explored the drivers behind the revision, which taxes drive the revision and how much of this change is due to real GDP, inflation and the effective tax rate.
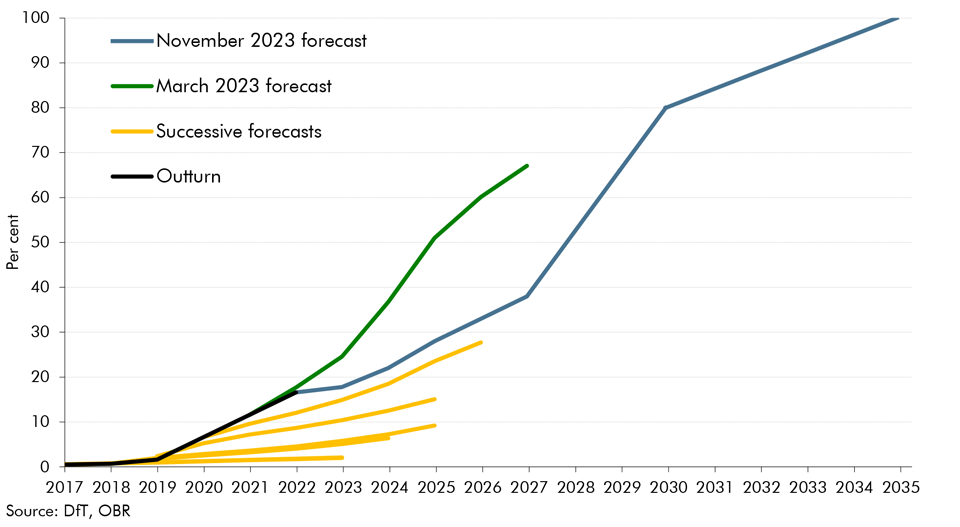
The transition to electric vehicles (EVs) has direct fiscal implications for fuel duty revenues (and, to a lesser extent, vehicle excise duty). In this box we explained why we have revised down our EV assumptions and the impact of this revision on fuel duty and VED revenues.
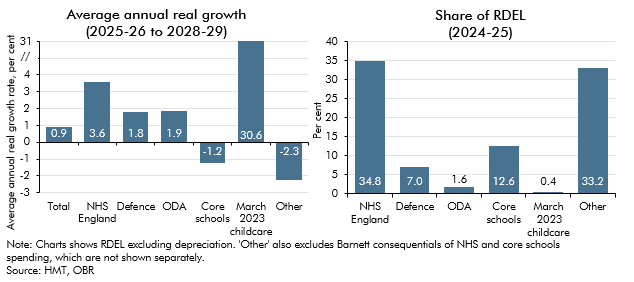
In the final four years of our November 2023 , departmental spending follows an overall envelope set by the Government because the detailed, department-by-department plans set at the last Spending Review only extend to 2024-25. In this box, we explored the implications of these plans for different departments.
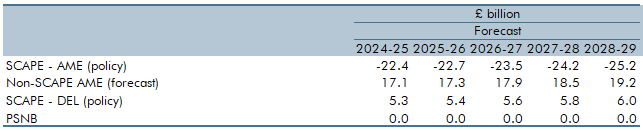
The new SCAPE discount rate, to be implemented in April 2024, increases the present value of future pensions payments and in turn causes employer contributions to rise. Box 4.4 explained the SCAPE rate change and its overall impact on the public finances.
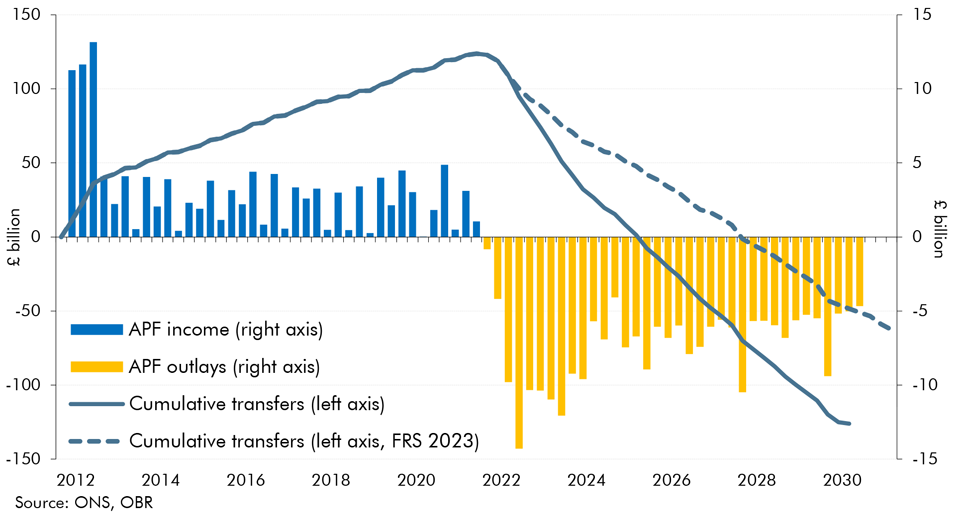
The Bank of England's Asset Purchase Facility (APF) conducts the Bank's operations for quantitative easing and tightening. Since the sharp rise in interest rates in 2022, historic profits from the APF have turned to losses. This box looked at the impact of these losses on fiscal aggregates and the lifetime direct cost of QE.
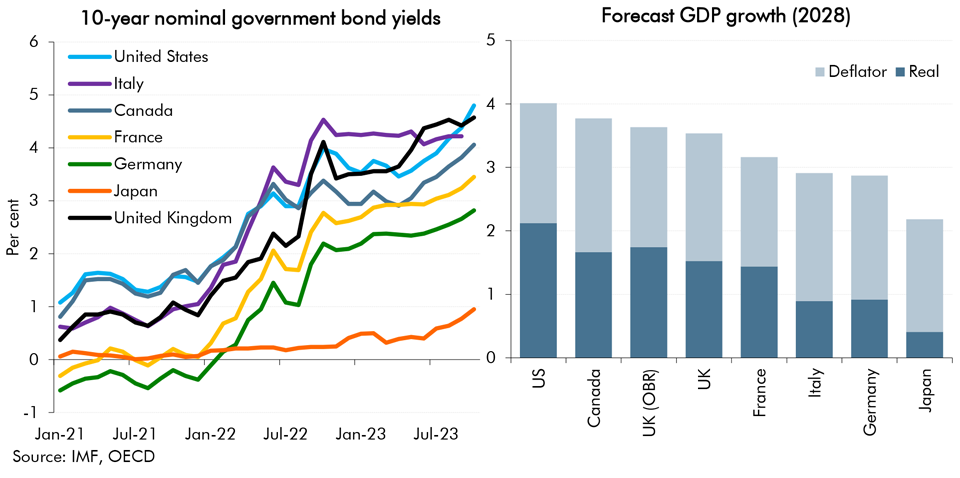
In our November 2023 forecast, alongside higher interest rates, we revised down our estimates for medium term growth. This box explored the challenging fiscal implications of the deterioration in the UK's growth-corrected interest rate, with comparison to other G7 economies.