
Box sets » Potential output and the output gap » Output gap
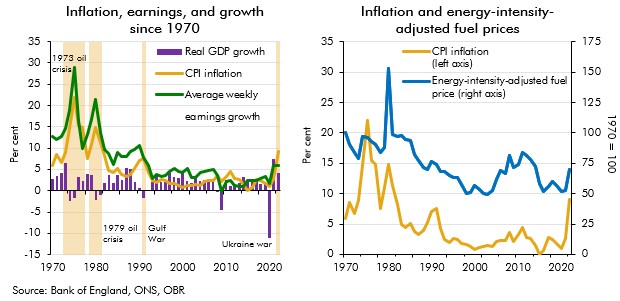
Our recent forecasts have significantly underestimated inflation outturns, with the March 2021 underestimation of inflation in 2022-23 being the largest difference between forecast and outturn since the OBR began forecasting in 2010. In this box we explored the reasons that might have driven these differences since our March 2022 forecast. In particular, we considered the extent to which the knock-on effects of higher energy prices on CPI inflation might have been higher than we originally assumed.
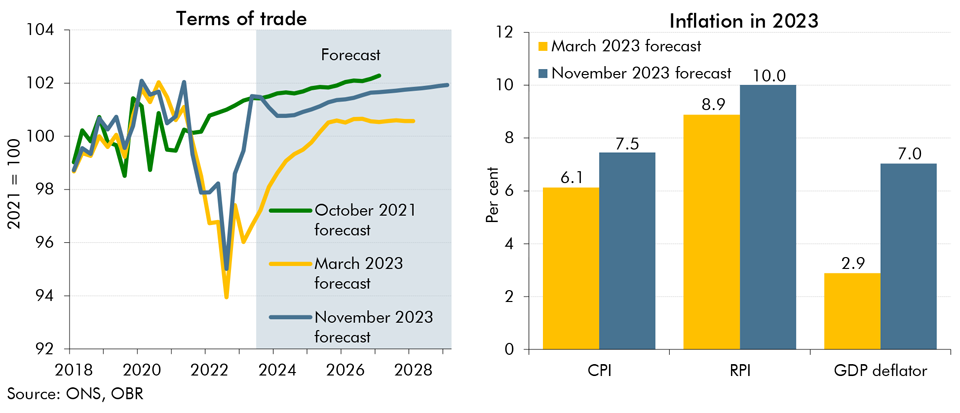
In our November 2023 forecast we expect inflation to be both more persistent and more domestically generated than in March. In this box we explored the reasons behind our assessment for inflation to be more domestically rather than externally driven and its implications for the public finances.

In our 2015 Fiscal sustainability report, we assumed that GDP grows in line with its historical trend. This in effect implied 47 years of uninterrupted trend economic growth in our central projections. This box considered the alternative paths for debt as a share of GDP under an symmetric and asymmetric cycle, highlighting the sensitivity of the net debt projections to economic cycles.
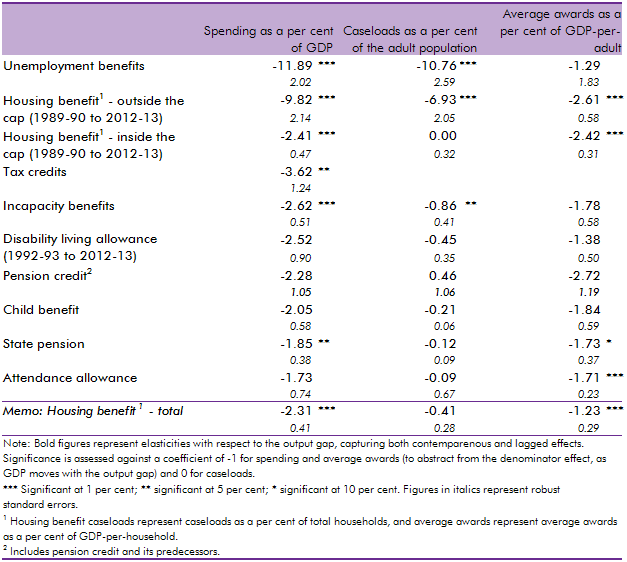
In our 2014 Welfare trends report, Chapter 4 reviewed the overall trends in welfare spending. In this box, we considered how responsive welfare spending is to the economic cycle by estimating the elasticity of benefits and tax credits spending as a share of GDP with respect to changes in the output gap (the difference between actual GDP and an estimate of its potential or underlying level). We found that the most counter-cyclical benefits have caseloads closely associated with the economic cycle whereas mildly counter-cyclical benefits are likely to only exhibit cyclicality due to spending varying less than GDP, thereby producing a denominator effect.
In the February 2014 Inflation Report the Bank of England published more information about its assessment of spare capacity. This box compared that assessment with our own output gap estimate at the time, highlighting some conceptual differences between the two.
In early OBR forecasts we estimated a significant negative output gap following the late-2000s recession, which we did not expect to have closed by the end of the forecast horizon. Our March 2013 forecast implied that potential output would be 14.6 per cent below an extrapolation of its pre-crisis trend after five years, with actual output a further 2.3 per cent below that. This box examined the implications of that forecast, as well as the fiscal implications of some possible alternative assumptions.
Our latest estimates of the output gap - which extended up to the third quarter of 2012 - implied a narrowing of the output gap since our previous forecast, despite actual output having remained broadly flat. Given the strength in the labour market over the period suggested a sharp fall in trend total factor productivity (TFP). This box set out the methodology behind that assessment, based on a production function approach that allowed us to separate out productivity growth into contributions from capital deepening and TFP.
In our central forecast, interest rates are assumed to evolve in line with financial market expectations. For alternative economic scenarios which involve different paths for the output gap and inflation, it is useful to specify rules for the way monetary policy is set and for how output and employment will respond. In this box, we set out the rules that governed those relationships in the scenarios we analysed in the March 2011 Economic and fiscal outlook: a persistent inflation scenario and a weak euro scenario.