
Box sets » Conditioning assumptions » Oil prices

As tensions have risen in the Middle East, there has been increasing concern over the possibility of a wider escalation in the region and its implications on the UK economy. In this box we considered the economic growth and inflationary implications of an adverse scenario. In this scenario, supply chain disruption reaches levels not seen since the pandemic levels and energy costs rise sharply for a second time since the pandemic.
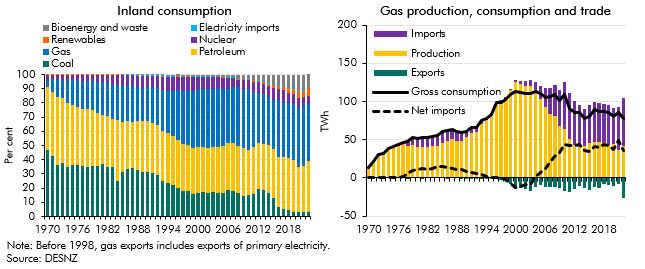
Since 1970 the UK's energy sector has undergone significant shifts following the discovery of oil and gas in the North Sea and the energy shocks of the 1970s. In this box we summarised the historical events and changes that has led to the UK has become increasingly dependent on imported gas.
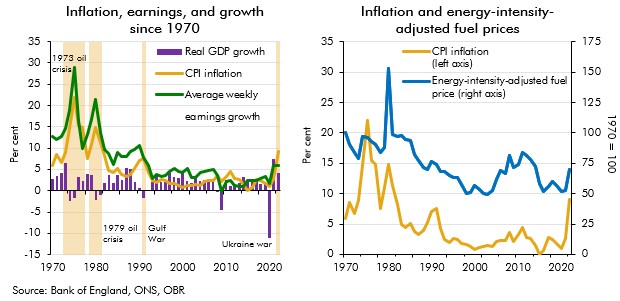
Our recent forecasts have significantly underestimated inflation outturns, with the March 2021 underestimation of inflation in 2022-23 being the largest difference between forecast and outturn since the OBR began forecasting in 2010. In this box we explored the reasons that might have driven these differences since our March 2022 forecast. In particular, we considered the extent to which the knock-on effects of higher energy prices on CPI inflation might have been higher than we originally assumed.
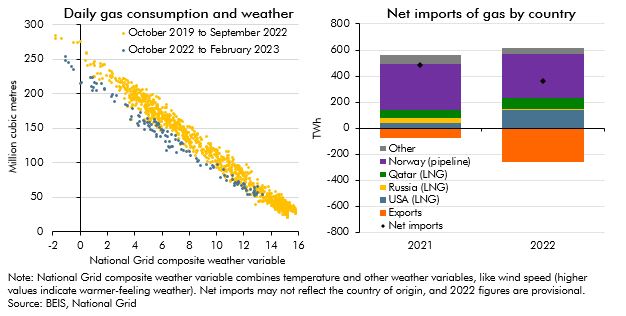
In response to the largest rise in energy prices in around 50 years, an immediate reduction in energy demand, and more gradual change in the composition of energy supply, might be expected. In this box we look at how the sharp rise in the household price of gas has changed households consumption of gas this winter as well as how the Russian invasion of Ukraine and the rise in wholesale gas prices has changed the UK's energy supply over the last year and how it may change further in the future. We then briefly outline how we forecast gas prices and why we do so.
Persistently higher energy prices can reduce the supply capacity of the economy. In this box, we use a production function to estimate the impact of higher fossil fuel prices on potential output.
In May 2022, the Government announced a package of measures to support households with the cost of living. In this box, we explained how we had adjusted our March 2022 Economic and fiscal outlook forecast for these policies.
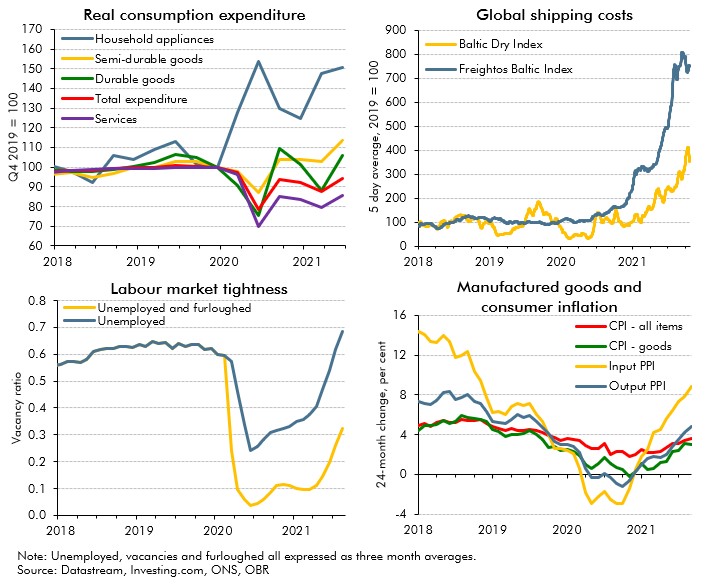
In October 2021 commentators became increasingly concerned that the inability of supply to keep up with demand in specific areas of the economy would hold back the recovery. In this box we examined these 'supply bottlenecks' in energy, product and labour markets, discussing their consequences for wage and price inflation.
After we closed our March 2020 pre-measures forecast, it became clear that the spread of coronavirus would be far wider than assumed in our central forecast. This box described the effect we incorporated into the central forecast and explored the potential impacts the virus could have on the economy and public finances.
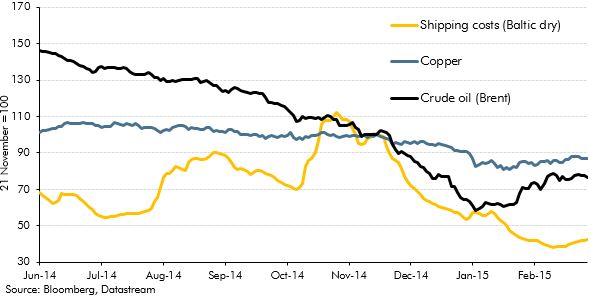
An important economic development in the run-up to our March 2015 Economic and fiscal outlook was the sharp drop in oil prices, which had fallen to less than half the $115-a-barrel peak that they had reached in June 2014. In this box we considered the relative importance of demand- and supply-side factors in explaining lower oil prices. (See also Box 3.1 from that EFO for a discussion of the effects of those lower prices on the UK economy.)
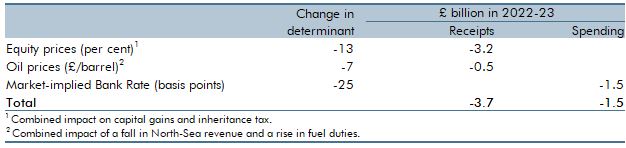
An important economic development in the run-up to our March 2015 Economic and fiscal outlook was the sharp drop in oil prices, which had fallen to less than half the $115-a-barrel peak that they had reached in June 2014. In this box we considered the channels along which those lower oil prices were likely to affect the UK economy. (See also Box 2.1 from that EFO for a discussion of the demand- and supply-side factors contributing to lower oil prices.)
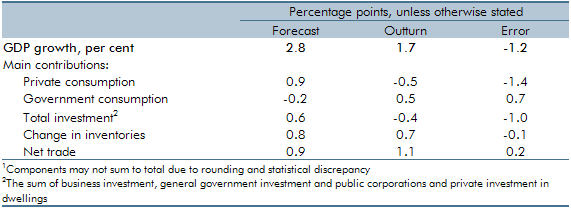
UK GDP had grown less quickly in 2010-11 than the OBR forecast in June 2010. This box decomposed the forecast error by expenditure component and discussed possible explanations, including the external inflation shock.
At the time of publication, oil prices had risen by £15 since the previous forecast. This box, from our March 2011 Economic and fiscal outlook, considered the potential economic implications, including the short-run effects on inflation and household consumption as well as possible longer-run effects on potential supply and the equilibrium capital stock.
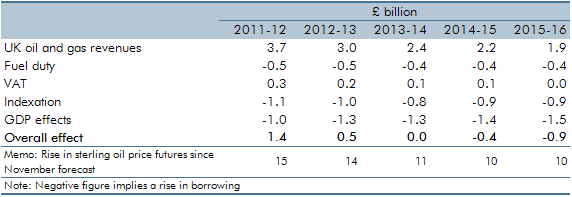
The world price of oil increased sharply in 2010, reflecting rising world demand and unrest in the Middle East and North Africa. This box explored the impact this had on our public finances forecast at the time, from higher North Sea oil and gas revenues to the second round effects stemming from higher inflation.