Box sets » Economic and fiscal outlook - March 2015
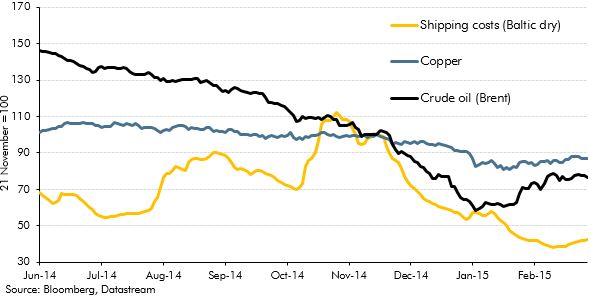
An important economic development in the run-up to our March 2015 Economic and fiscal outlook was the sharp drop in oil prices, which had fallen to less than half the $115-a-barrel peak that they had reached in June 2014. In this box we considered the relative importance of demand- and supply-side factors in explaining lower oil prices. (See also Box 3.1 from that EFO for a discussion of the effects of those lower prices on the UK economy.)
An important economic development in the run-up to our March 2015 Economic and fiscal outlook was the sharp drop in oil prices, which had fallen to less than half the $115-a-barrel peak that they had reached in June 2014. In this box we considered the channels along which those lower oil prices were likely to affect the UK economy. (See also Box 2.1 from that EFO for a discussion of the demand- and supply-side factors contributing to lower oil prices.)
In each Economic and fiscal outlook we publish a box that summarises the effects of the Government’s new policy measures on our economy forecast. These include the overall effect of the package of measures and any specific effects of individual measures that we deem to be sufficiently material to have wider indirect effects on the economy. In our March 2015 Economic and Fiscal Outlook, we made adjustments to nominal GDP, inflation and North sea production.
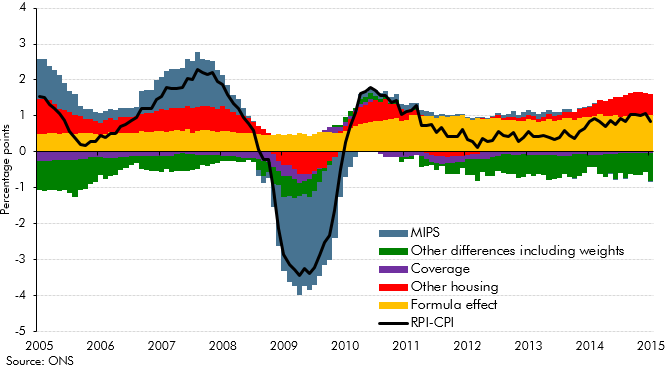
RPI inflation differs from CPI inflation for a number of reasons. Collectively the difference between the two measures is refered to as the 'wedge'. In light of more evidence this box, from our March 2015 Economic and fiscal outlook, re-examined historical contributions to the 'wedge' and set out our latest assumptions for the long-run difference between the two measures.
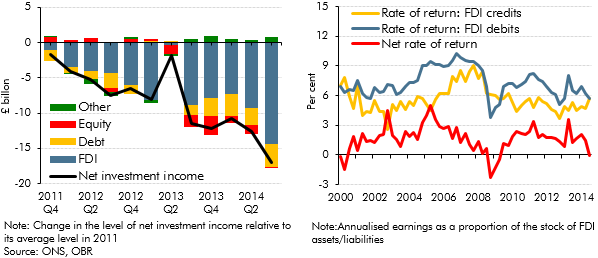
The data available at the time of our March 2015 Economic and fiscal outlook showed the current account deficit had worsened to around 6 per cent of GDP in the third quarter of 2014, one of the largest quarterly deficits on record. Much of the recent deterioration was down to the income balance moving into deficit, the drivers of which were discussed in this box.
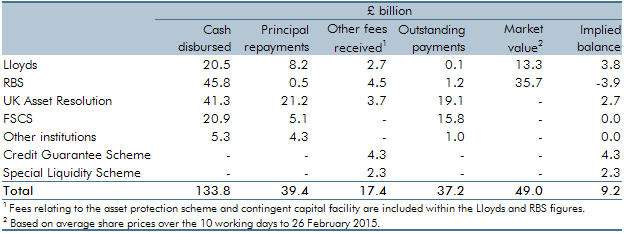
The Government undertook a number of interventions in the financial sector in response to the financial crisis and subsequent recession of the late 2000s. This box provided an update of the estimated net effect of them on the public finances as of March 2015.
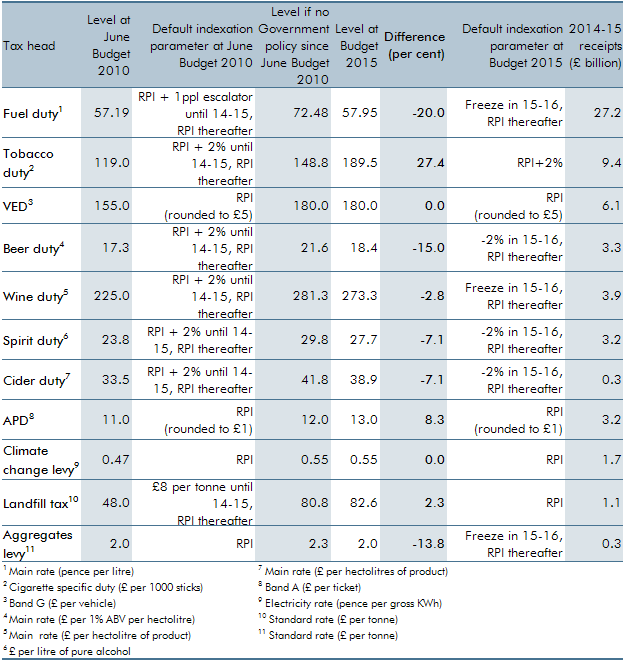
Our forecasts for excise and environmental duties assume that rates are indexed in line with default parameters. These parameters are set by the Government and are detailed at each Budget in the Treasury’s Policy costings document. The assumptions represent a source of economy and
policy-related uncertainty in our forecast. In this box, we looked back at how a selection of duty rates moved over the Parliament relative to the default uprating assumptions assumed in the OBR’s first forecast in June 2010.
policy-related uncertainty in our forecast. In this box, we looked back at how a selection of duty rates moved over the Parliament relative to the default uprating assumptions assumed in the OBR’s first forecast in June 2010.
In this forecast, there were two policy switches that shifted spending between RDEL and AME, which applied from 2015-16 onwards. This box outlined these changes and examined the subsequent impact these would have on our forecast.
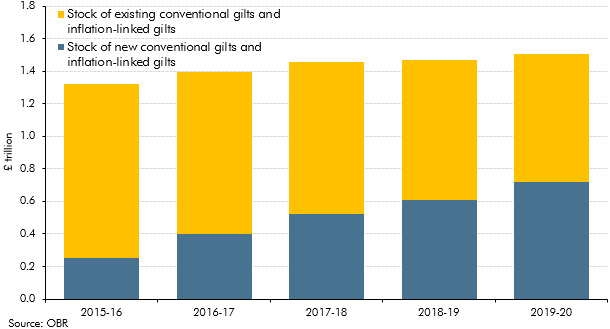
Our March 2015 Economic and fiscal outlook forecast highlighted large changes in our debt interest forecast since previous fiscal events and the added complexity that debt interest was expressed net of the effect of gilts held by the Bank of England Asset Purchase Facility (APF) associated with past quantitative easing. This box described how we produced the debt interest forecast and illustrated some of the sensitivities to which it was subject.
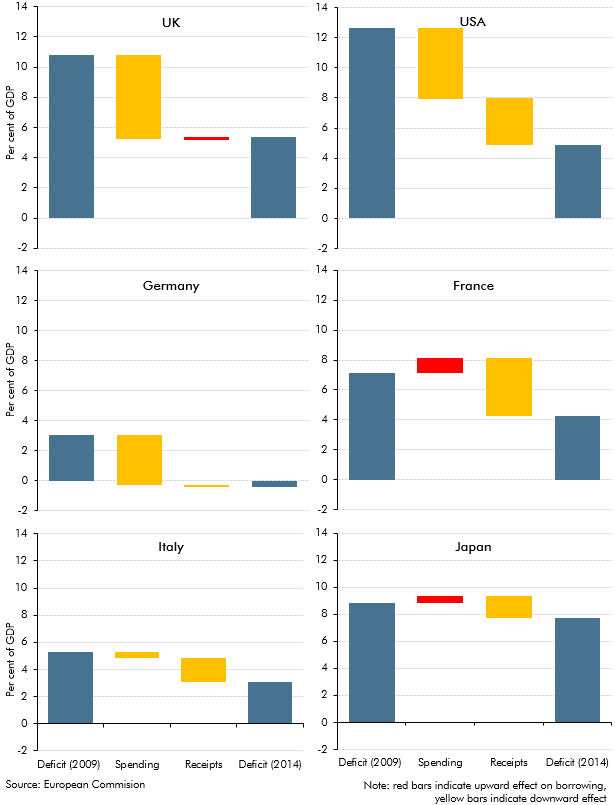
The UK budget deficit increased to a post-war high after the financial crisis and recession of the late 2000s. This box explored how the path and composition of deficit reduction in the UK over the subsequent 5 years compared to five other major economies.
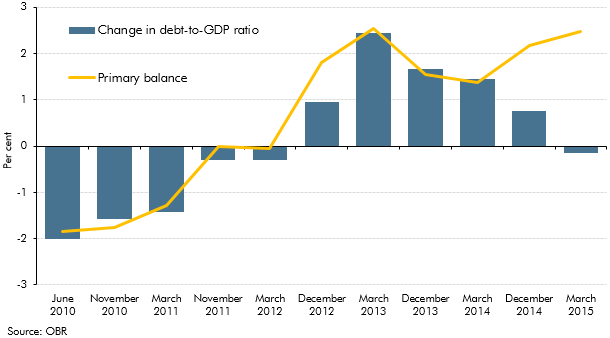
In our first June 2010 EFO, the debt-to-GDP ratio was forecast to fall by 2 per cent in 2015-16. This box explored how our debt-to-GDP forecast for 2015-16 evolved over time. It highlighted the contribution of the primary balance and the impact of other factors (including asset sales and the growth-interest differential) on the debt-to-GDP ratio forecast.

