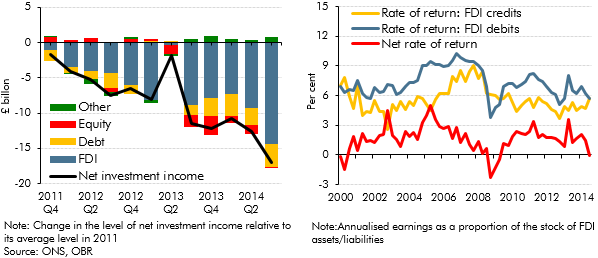
The data available at the time of our March 2015 Economic and fiscal outlook showed the current account deficit had worsened to around 6 per cent of GDP in the third quarter of 2014, one of the largest quarterly deficits on record. Much of the recent deterioration was down to the income balance moving into deficit, the drivers of which were discussed in this box.
This box is based on ONS investment data from February 2015 .
We expect the current account deficit in 2014 as a whole to have been 5.4 per cent of GDP. This would be the largest peace-time deficit since at least 1830, based on the Bank of England’s historical dataset.a
Much of the widening of the deficit in recent years reflects a significant deterioration in the net income earned on cross-border investment. Net investment income – the income earned on the UK’s overseas investments, minus the income earned by overseas investors on their UK investments – averaged a surplus of 1.2 per cent of GDP between 2000 and 2008. Since mid-2011, the income balance has deteriorated from a 2.2 per cent of GDP surplus to a 2.7 per cent deficit in the third quarter of 2014.
In assessing changes in the income balance it is useful to decompose net investment income into its four components: net income on foreign direct investment (FDI); net income on debt securities; net income on equity; and net income on other assets. Chart B shows that the deterioration in the net investment income balance since 2011 is largely attributable to the deterioration in net income earned on FDI, with a smaller negative contribution from net income earned on debt securities.
Changes in the net income earned on investments can reflect changes in the stocks of those investments or changes in the net rate of return on them. Since the end of 2011, the stock of FDI assets has fallen while the stock of liabilities has continued to rise. All else equal this will have served to reduce net FDI income. In addition, the net rate of return on FDI has fallen sharply in recent quarters and remains well below pre-crisis levels (Chart C): between 2000 and 2007, the net rate of return on FDI averaged 1.9 percentage points; this compares to an average of 1.6 percentage points since 2012 and 1.2 percentage points so far in 2014.
Analysing why the income balance has deteriorated so sharply is complicated both by the volatility of the series and by revisions to early estimates. One possibility is that relatively weak growth in the UK’s trading partners – most notably the euro area – has depressed returns on the UK’s overseas foreign direct investments relative to overseas foreign direct investment in the UK. Regional analysis of income flows suggests that a large part of the deterioration in FDI earnings can be attributed to lower earnings in Europe – most notably in the information and communications sector.b While not verifiable in the published data, it seems likely that the very large cross-border fines and compensation paid by BP and some large banks (to the United States in particular) will also have depressed measured rates of return on those sectors’ overseas assets. The deterioration in net income on debt securities may reflect changes in the composition of the debt held by UK residents or issued by UK companies.c
Chart B: Change in net investment income since 2011 (left) and Chart C: Rates of return on foreign direct investment (right)

