
Box sets » Public spending » Debt interest spending

Public sector net debt (ex BoE) has risen substantially over the past 25 years, despite repeated government plans to get it falling. In this box, we examined the key drivers behind this upward trend, including the impact of major economic shocks, the persistent gap between forecasted and actual debt outcomes, and the increasing difficulty of stabilising debt due to structural fiscal pressures.
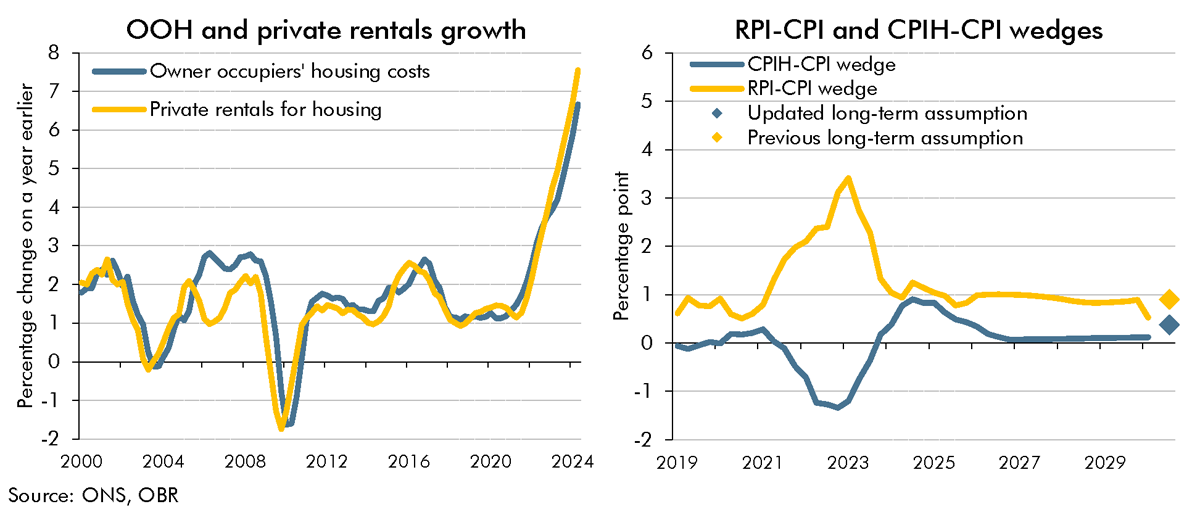
As as result of the shortcomings with the methodology for calculating the Retail Prices Index (RPI), the ONS's current plans are to address these by bringing the methods and data sources from the Consumer Prices Index including owner occupiers' housing costs (CPIH) into the RPI in February 2030. In this box, we explained how this change would impact our estimate of the long-run difference between RPI and CPI inflation.

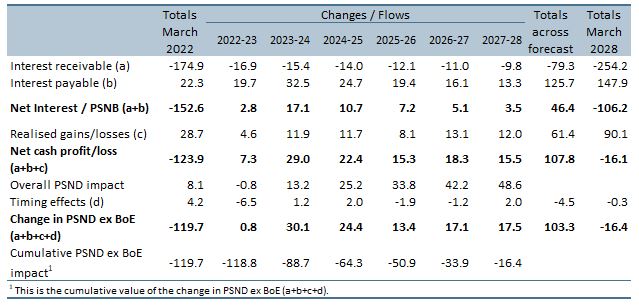
Debt interest spending has reached post-war records as a per cent of revenue and GDP in recent years and has also proved to be incredibly volatile and subject to large revisions between our forecasts. In this box we looked at the reasons for this elevated spending and volatility and how the process of quantitative tightening by the Bank of England will impact the maturity of this debt.
Up to July 2022 the Bank of England's quantitative easing (QE) activities had made large profits resulting in large transfers to the Treasury but since then flows have reversed. This box described what the whole lifetime direct costs of QE would be based on our March EFO assumptions.
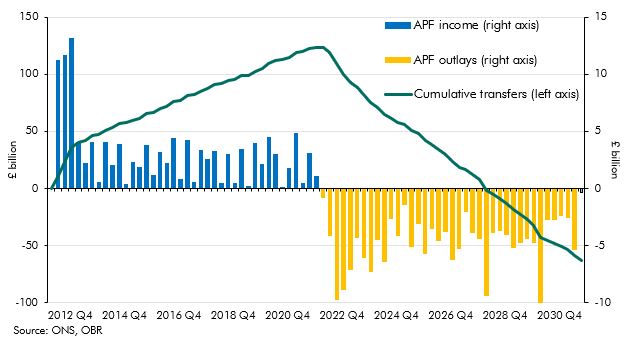
The Bank of England's Asset Purchase Facility (APF) conducts the Bank's operations for quantitative easing and tightening. Following sharp rises in interest rates in 2022 the APF has started to make large cash losses. This box looked at the causes of those losses and how they feed through to fiscal aggregates.
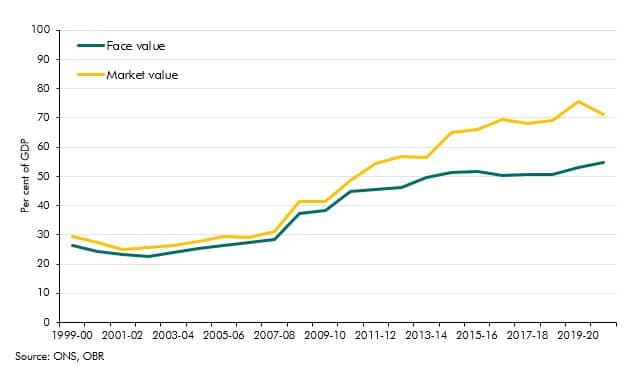
Government debt liabilities can be valued in various ways. In recent years market and face values have diverged sharply reaching 15% of GDP. In this box we explained why this has happened and why we use face value in our analysis.
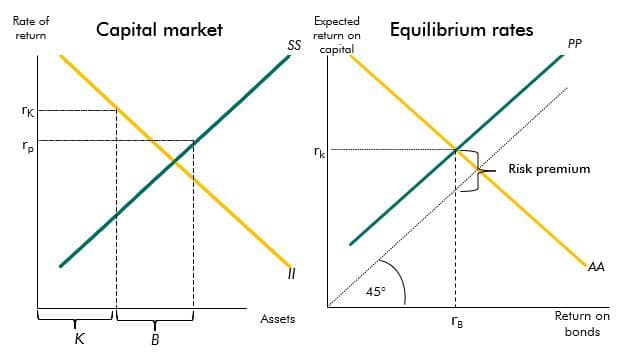
The yields on government debt have declined over recent decades. This box described a stylised model that provides a framework to explain the drivers of these changes.
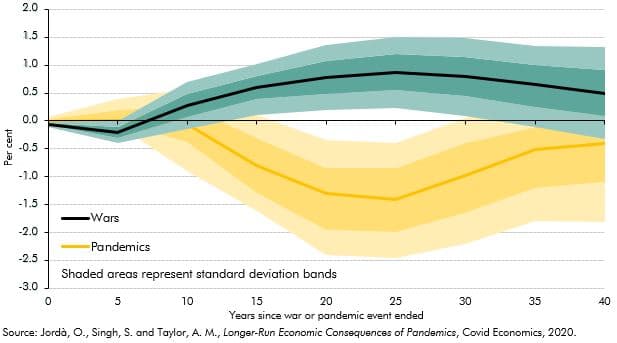
Past pandemics have had long-run impacts on real interest rates. A recent paper found that 20 years after a pandemic real rates fell by, on average, 1.5 percentage points (though less in the UK). This box examined the evidence for the current pandemic and suggested why this time it may be different.
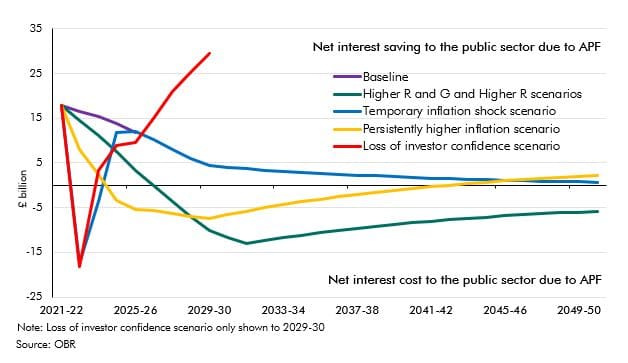
The Asset Purchase Facility (APF) houses the assets purchased by the Bank of England as part of its programme of quantitative easing. This box explained how this lowered interest rates benefitting the Treasury by £113 billion to date but it also increased the sensitivity of interest payments to future rate rises. The box showed how the cash flows to and from the APF change under various scenarios.
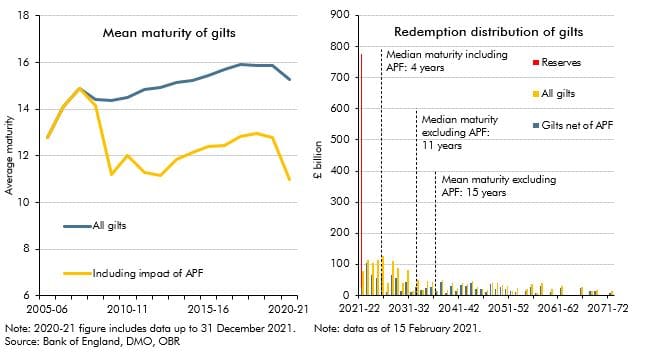
The average maturity of UK government bonds is longer than the average maturity of government debt in most other advanced economies. But the average maturity of the net debt of the public sector as a whole (including the Bank of England) has shortened considerably since the global financial crisis. In this box, we explored how the Bank of England's quantitative easing operations have shortened the maturity of public sector net debt, dramatically increasing the sensitivity of debt interest spending to changes in short-term interest rates.
Despite debt rising as a share of GDP to a new post-war peak in our November 2020 forecast, government spending on debt interest was expected to fall to a new historic low as a share of total government revenue. This box explored how this had left the public finances more sensitive to future changes in the cost of servicing this higher debt burden.
By issuing gilts linked to the Retail Prices Index (RPI) the Government exposes itself to inflation risks on interest payments. In this box, we looked at how changes to the formula for calculating RPI would affect our forecast.
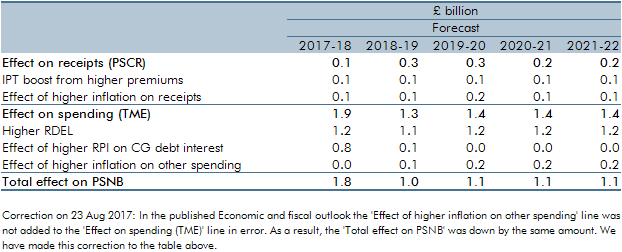
In February 2017, just ahead of the Spring Budget and our March Economic and fiscal outlook, the Ministry of Justice announced that the ‘personal injury discount rate’ would be reduced from 2.5 to minus 0.75 per cent (in inflation-adjusted real terms). This box explained the direct and indirect effects of this change on our receipts and public spending forecasts.
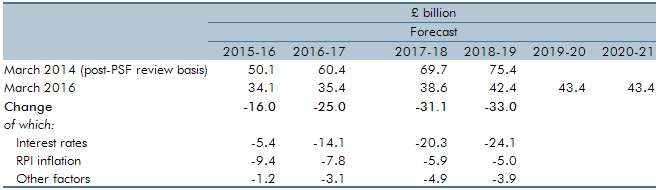
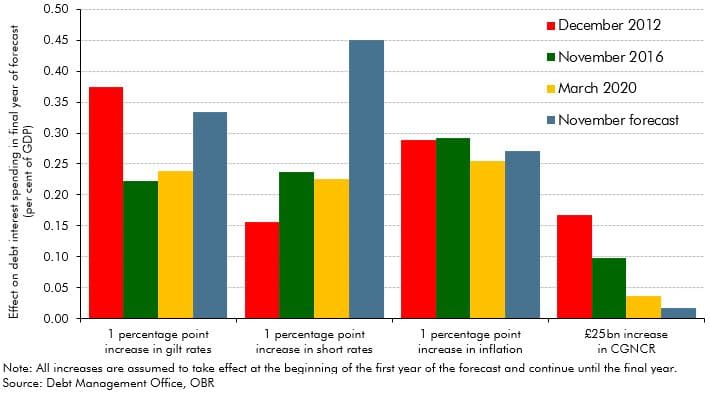
Since our March 2014 Economic and fiscal outlook, our debt interest spending forecast was revised down significantly as market expectations of the interest rates at which the Government can borrow and service its debt moved progressively lower and as inflation fell. This box explained some possible factors that could have caused market expectations of interest rates to rise and the effect on the fiscal position of a sudden increase in interest rates.
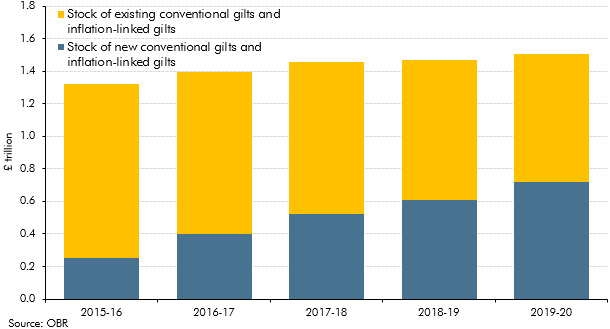
Our March 2015 Economic and fiscal outlook forecast highlighted large changes in our debt interest forecast since previous fiscal events and the added complexity that debt interest was expressed net of the effect of gilts held by the Bank of England Asset Purchase Facility (APF) associated with past quantitative easing. This box described how we produced the debt interest forecast and illustrated some of the sensitivities to which it was subject.
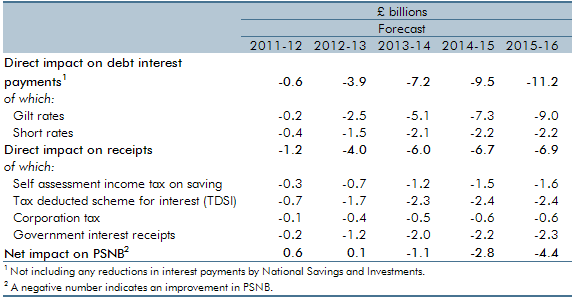
This box set out the impact of changes in interest rates on our public finances forecast, including debt interest spending and income tax receipts. Updated versions of our ready reckoners can be found on our website.