
The yields on government debt have declined over recent decades. This box described a stylised model that provides a framework to explain the drivers of these changes.
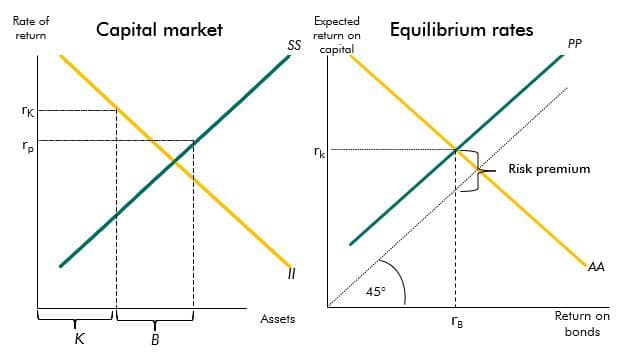
To help explain the forces that have generated the movements in yields observed in recent decades, it is helpful first to construct a stylised model of the global capital market, shown in Figure A.a There are two assets: capital (K), whose real return is uncertain; and government bonds (B), whose real return is certain. In practice, of course, the return on government bonds will be uncertain too because of the possibility of default, either de jure or de facto through inflation, but for now it is helpful to put this to one side.
The overall supply of savings, or equivalently the demand for assets, (SS) that has to be held in one of these two forms derives from the need for households to provide for their retirement and to smooth consumption. It therefore depends on income, together with factors such as expected longevity and retirement ages and whether there are unfunded pension schemes in place that affect the need for savings. It will also be affected by the expected real return on those savings, rp, which is an appropriately weighted average of the expected real return on capital (rK) and the real return on bonds (rB). The supply of assets then derives from: the demand for capital by businesses for investment (II), which, in turn, depends on factors such as expected productivity and the required return on those funds, rK; and the supply of bonds, which we take as exogenous. A possible equilibrium outcome is depicted in the left-hand panel of Figure A, which is shown assuming that savings increase as the rate of return on savings increases i.e. the SS curves slopes upwards (note that the analysis would be the same if SS sloped downwards so long as it is steeper than II).
In order to see how the returns on risky and safe assets are related and move together, it is
helpful to look at the right-hand panel of Figure A. The downward-sloping line AA shows the
combinations of rK and rB that are consistent with overall asset market equilibrium (i.e. where the total supply of savings is equal to the total demand for them), other things equal. It slopes down because a lower required return on capital raises the demand for capital by businesses but also lowers the overall supply of savings. To bring forth the necessary extra savings, bonds would then need to offer a suitably higher return so that the overall expected return on the portfolio is sufficiently high to return the market to equilibrium.
We then need to supplement this with another, upward-sloping, relationship (PP) that shows the combinations of rK and rB that are consistent with portfolio equilibrium (i.e. that ensure the allocation of savings between risky and safe assets is consistent with investors’ preferences and the respective supplies of each). In simple finance models, the spread of rK over rB, also known as the equity risk premium, depends just on the statistical properties of the returns on capital and the risk appetite of investors. But in arguably more realistic settings with incomplete markets and financial frictions, a greater range of factors may become relevant. In particular, government bonds may offer not only safety but also liquidity services – for instance, banks and other financial institutions can usually offer high-quality government debt as collateral for borrowing short-term funds from the central bank or other financial intermediaries. In such cases, the premium may also be affected by asset supplies; in particular, if bonds are already very plentiful the value of the extra liquidity services provided by additional issuance will be quite low.b
We can use this diagram to identify the sort of factors that are likely to have driven yields in recent years. In the 1990s, the yields on bonds and on capital fell together, roughly one-for-one. That is consistent with factors shifting the asset market equilibrium schedule AA inwards, so that rK and rB move along the portfolio equilibrium schedule PP in a south-westerly direction. Summers’s ‘secular stagnation’ hypothesis, which focuses on a chronic tendency of savings to exceed investment, produces just such an outcome.c
Since the early 2000s, however, it appears that the return on capital has been edging up at the same time as bond yields have continued to decline, so that rK and rB have been moving in a north-westerly direction. To explain this, one needs to invoke upward shifts in the portfolio equilibrium schedule, PP, reflecting a shift in the demand and/or supply of assets in favour of safe assets and away from risky assets (it is possible, of course, that the AA schedule has at the same time continued to shift inwards).
Figure A: Determination of rates of return
This box was originally published in Fiscal risks report – July 2021