
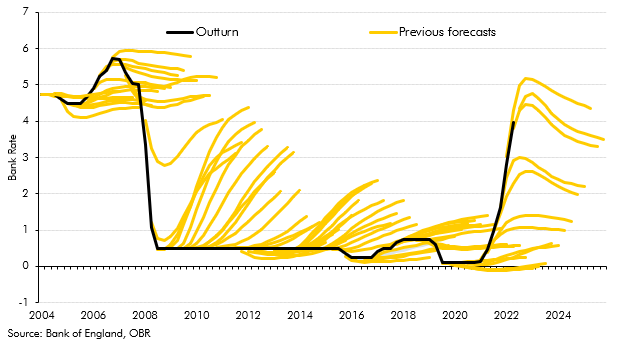
Box sets » Conditioning assumptions » Interest rates

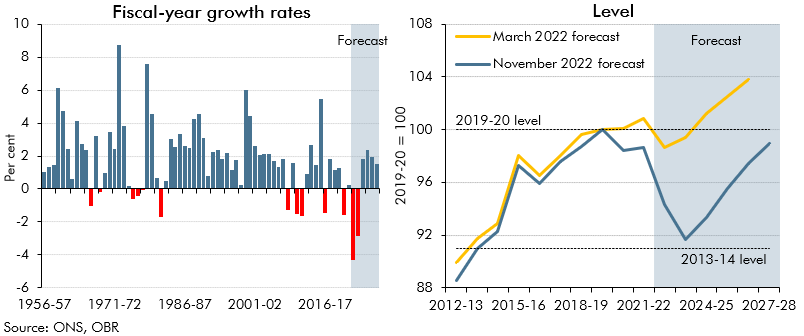
The UK’s fiscal position is increasingly vulnerable, by both historical and international standards. In this box, we considered the drivers of fiscal vulnerability, such as persistent large deficits, slower growth and higher interest rates, and the extent to which these may limit the Government's scope to respond to future economic shocks.
There has been a notable shift in the environment of interest rates over the past 18 months in the UK. This box looked at the extent of surprise for rate rises relative to market implied expectations and the increase in capital adequacy ratios of UK banks since the global financial crisis.
Our recent forecasts have significantly underestimated inflation outturns, with the March 2021 underestimation of inflation in 2022-23 being the largest difference between forecast and outturn since the OBR began forecasting in 2010. In this box we explored the reasons that might have driven these differences since our March 2022 forecast. In particular, we considered the extent to which the knock-on effects of higher energy prices on CPI inflation might have been higher than we originally assumed.
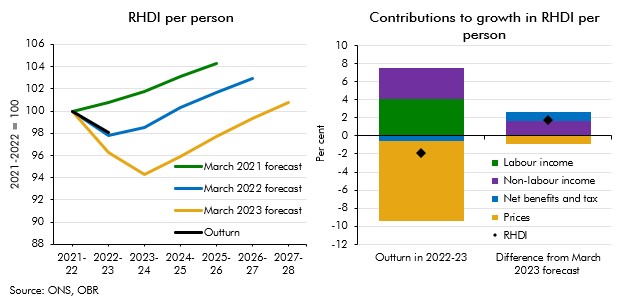
Real household disposable income turned out stronger than our recent forecasts expected for 2022-23. This box explained that differences are largely explained by net benefits and taxes as well as non-labour incomes providing stronger support to living standards than forecast.
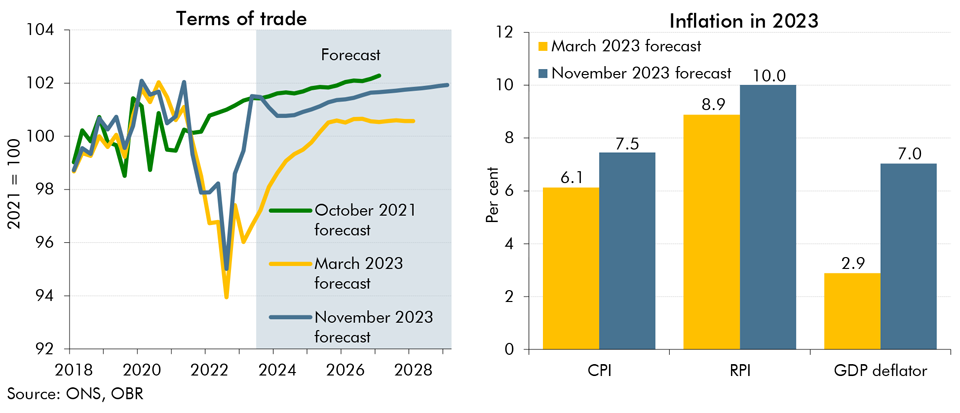
In our November 2023 forecast we expect inflation to be both more persistent and more domestically generated than in March. In this box we explored the reasons behind our assessment for inflation to be more domestically rather than externally driven and its implications for the public finances.
In 2022-23 and 2023-24, living standards are set for the largest fall on record. This box set out our forecast for real household income, the impact of government policy in buffering the income shock, and its implications for our consumption forecast.
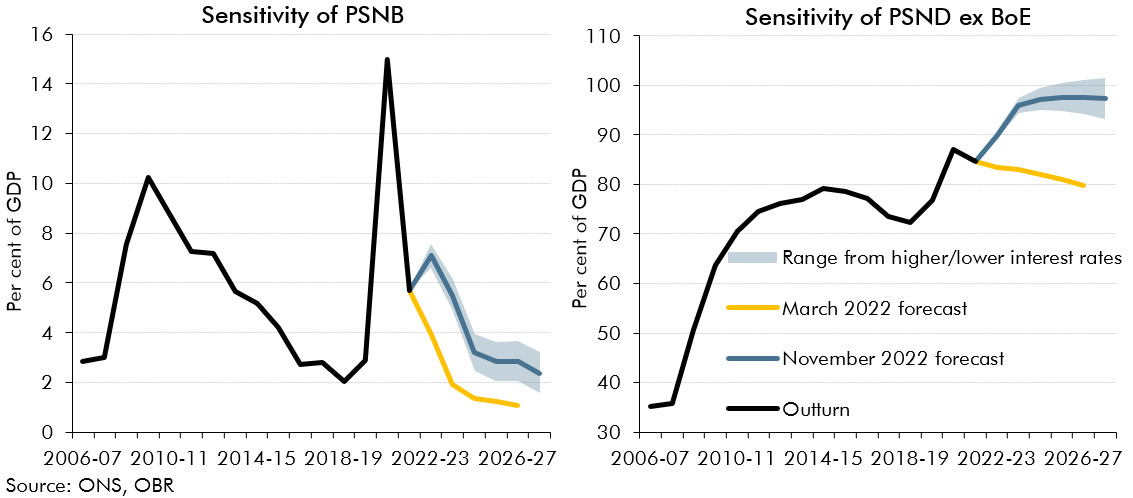
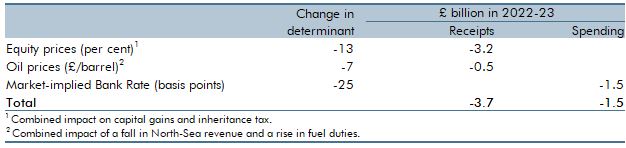
In 2022-23 we have seen sharp rises in gas prices and interest rates, both of which are forecast to remain elevated in 2023-24. This box presented the potential fiscal impacts of a higher-than forecast path for gas prices and two scenarios where Bank Rate is either a percentage point higher or lower than in our central forecast.
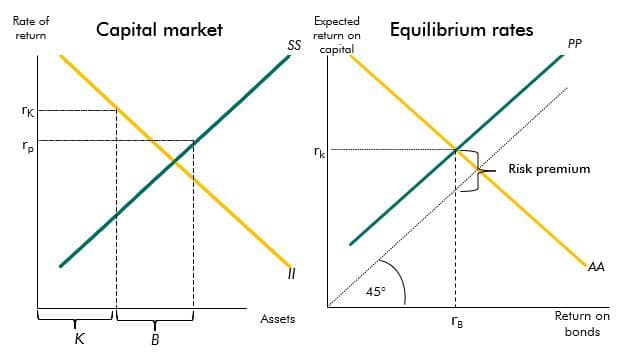
The yields on government debt have declined over recent decades. This box described a stylised model that provides a framework to explain the drivers of these changes.
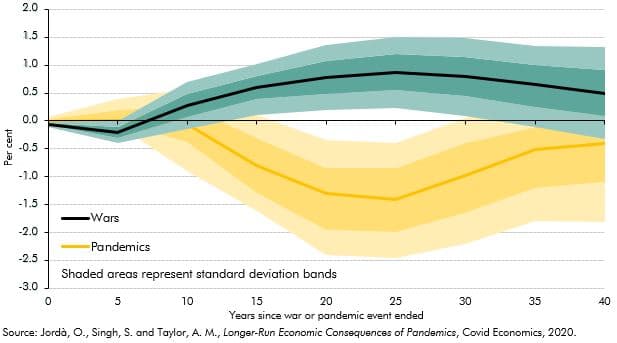
Past pandemics have had long-run impacts on real interest rates. A recent paper found that 20 years after a pandemic real rates fell by, on average, 1.5 percentage points (though less in the UK). This box examined the evidence for the current pandemic and suggested why this time it may be different.
After we closed our March 2020 pre-measures forecast, it became clear that the spread of coronavirus would be far wider than assumed in our central forecast. This box described the effect we incorporated into the central forecast and explored the potential impacts the virus could have on the economy and public finances.
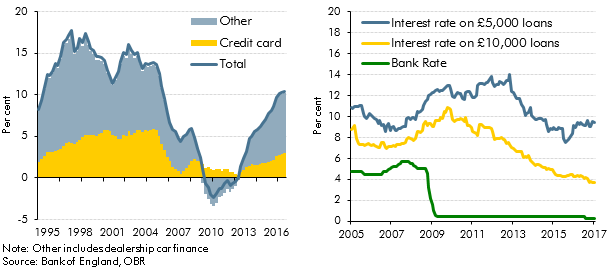
Strong growth in consumer credit in the run-up to our March 2017 Economic and fiscal outlook had prompted concerns among some commentators about its sustainability. In this box we considered the drivers of consumer credit growth, including the role of dealership car finance, and the extent to which it may have supported household consumption growth.
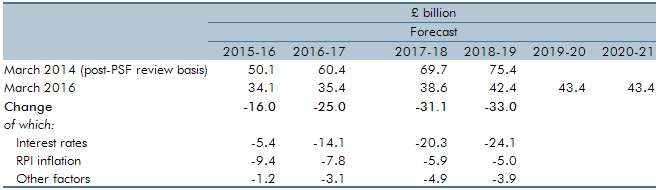
Since our March 2014 Economic and fiscal outlook, our debt interest spending forecast was revised down significantly as market expectations of the interest rates at which the Government can borrow and service its debt moved progressively lower and as inflation fell. This box explained some possible factors that could have caused market expectations of interest rates to rise and the effect on the fiscal position of a sudden increase in interest rates.
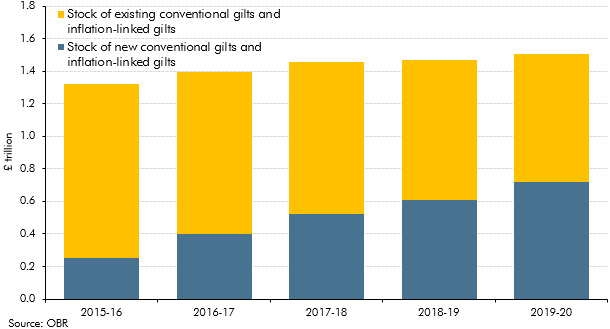
Our March 2015 Economic and fiscal outlook forecast highlighted large changes in our debt interest forecast since previous fiscal events and the added complexity that debt interest was expressed net of the effect of gilts held by the Bank of England Asset Purchase Facility (APF) associated with past quantitative easing. This box described how we produced the debt interest forecast and illustrated some of the sensitivities to which it was subject.
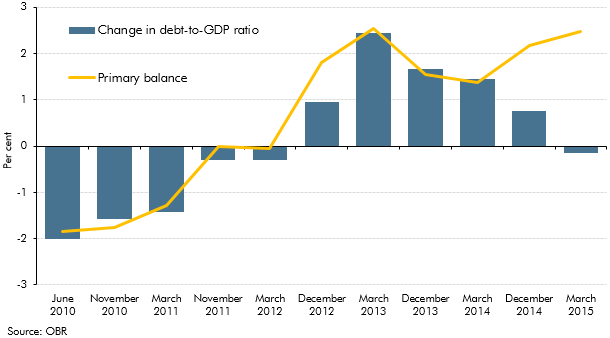
In our first June 2010 EFO, the debt-to-GDP ratio was forecast to fall by 2 per cent in 2015-16. This box explored how our debt-to-GDP forecast for 2015-16 evolved over time. It highlighted the contribution of the primary balance and the impact of other factors (including asset sales and the growth-interest differential) on the debt-to-GDP ratio forecast.
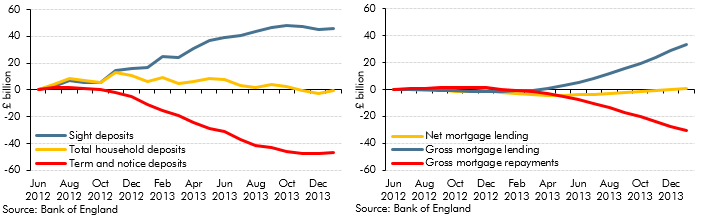
In 2013, households’ balances in ‘time deposit’ accounts (savings with fixed maturity) fell by £36 billion. This box outlined possible reasons for this by exploring the wider household savings behaviour. The cumulative change in annual deposit flows showed rapid increases in 'sight deposits'. This was possibly explained by narrowing spreads between 'time' and 'sight' deposit interest rates or normalisation of household investment behaviour. Changes in annual mortgage flows also suggested that revival of housing market activity could have been responsible for switching between deposit types. The ability of households to shift very large deposit balances over relatively short timeframes was one reason why the impact of savings and pensions measures discussed in Box 3.3 of the same EFO was subject to considerable uncertainty.
We expected debt servicing costs as a share of disposable income, or ‘income leverage’, to rise as our forecasts for house price inflation outstripped income growth and Bank Rate gradually increased. This box discussed the extent to which mortgage servicing costs were likely to increase over the forecast period and the implications of this for household behaviour, using information from the Bank of England/NMG survey.
On 7 August 2013, the Bank of England announced that it would not consider raising Bank Rate, then at 0.5 per cent, until the unemployment rate had fallen to 7.0 per cent. However, the Bank also detailed certain conditions, which if breached, would make it consider tightening monetary policy sooner. This box, from our December 2013 Economic and fiscal outlook, examined where our forecast stood in relation to these conditions.
Ahead of the June 2010 forecast, the OBR published a 'pre-measures' forecast, noting that the use of market expectations of interest in that forecast was potentially inconsistent, depending on markets' expectations of both fiscal tightening and the MPC's reaction to it. This box set out some illustrative calculations of the possible impact of the June 2010 Budget on long-term interest rates, and discussed the possible implications for comparisons between the pre-Budget and June Budget forecast