
In 2022-23 and 2023-24, living standards are set for the largest fall on record. This box set out our forecast for real household income, the impact of government policy in buffering the income shock, and its implications for our consumption forecast.
This box is based on Department of Energy and Climate Change and ONS data from June 2016 and January and September 2022 .
The UK is being hit by a large terms of trade shock that is set to push inflation to its highest rate in 40 years and drive historic falls in real household disposable income. This inevitably makes households worse off. On a fiscal year basis, RHDI per person (a measure of living standards) falls by 4.3 per cent in 2022-23, which would be the largest since ONS records began in 1956-57. That is followed by the second largest fall in 2023-24 at 2.8 per cent. This would be only the third time since 1956-57 that RHDI per person has fallen for two consecutive fiscal years – the last time this happened was in the aftermath of the global financial crisis (Chart A, left panel). And the 7.1 per cent cumulative fall from 2021-22 to 2023-24 is large enough to take RHDI per person to its lowest since 2013-14. By 2027-28, RHDI per person recovers its 2021-22 level, but remains over 1 per cent below pre-pandemic levels (Chart A, right panel).
Chart A: Real household disposable income per person
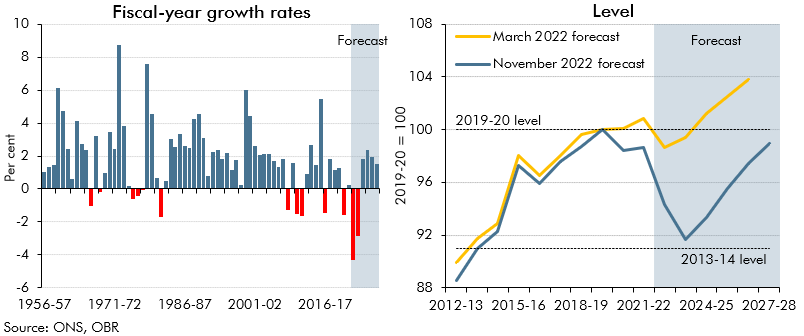
These near-term falls would have been greater still without the substantial fiscal support announced this year. Measures announced both alongside and since our March 2022 forecast – mainly via the energy price guarantee and successive tranches of cost-of-living payments – raise the level of RHDI per person by 4½ per cent in 2022-23 and 2½ per cent in 2023-24, relative to what would otherwise have occurred (a 3½ per cent average boost over the two years). Together, the two packages reduce the fall in RHDI per person in 2022-23 by half and lower the cumulative fall from 2021-22 to 2023-24 by around a quarter – to 7.1 per cent (a smaller fraction because the scale of support in 2023-24 is around half as large as it is in 2022-23).
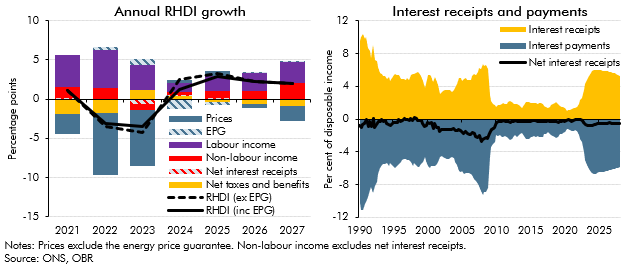
The left panel of Chart B shows the main drivers of our forecast for aggregate RHDI on a calendar-year basis (to highlight how it influences our aggregate consumption forecast):
- High inflation erodes real incomes (blue bars). Higher energy prices reflecting global shocks are unambiguously bad for households as the UK is a net energy importer. And as lower-income households spend more of their income on energy, the proportionate hit to them is greater. The impact of higher energy prices is limited by the EPG (blue-striped
bars), which partly offsets the effect of inflation on RHDI growth in 2022 and 2023. - Nominal wage growth is also high in 2022 and 2023 (purple bars), although not high enough to prevent real wages from falling significantly. The contribution of labour income to annual RHDI growth then settles at an average of 2 percentage points a year over the remainder of the forecast.
- Net taxes and benefits reduce RHDI growth this year, despite the impact of cost-of-living payments to households on means-tested benefits and to pensioners, reflecting fiscal drag from frozen tax thresholds among other factors (yellow bars). Net taxes and benefits boost disposable incomes in 2023 (thanks to another round of cost-of-living payments) but reduce them from 2025 onwards as temporary support is withdrawn and frozen tax thresholds draw more people into tax and more taxpayers into higher bands.
- Higher interest rates have little net impact on aggregate RHDI (red-striped bars). Mortgage rates and other interest costs rise but higher interest rates also boost interest income on household savings, and the impacts of these changes broadly offset in aggregate as the stock of household deposits is roughly equal to the stock of debt (Chart B, right panel). However, we expect rate rises to feed through to households’ payments faster than they will to their receipts, so RHDI growth is reduced by around half a percentage point next year. The impact of these changes will also be unevenly distributed across households: the median household has £8,400 in net financial wealth; whereas 28 per cent of dwellings are mortgage owned, and the median household mortgage debt is around £100,000.a
Chart B: Real household disposable income growth and net interest receipts
How these changes affect our consumption forecast
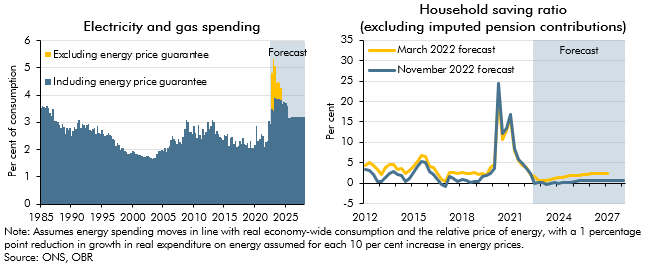
We expect households to spend more of their income on essentials such as energy and food, as their prices have risen quickly and there is limited scope to substitute away from them (Chart C, left panel).b But some households will also draw on their savings to cushion the impact of higher prices on their consumption, and we therefore expect the saving ratio (excluding imputed pension contributions that are less visible to households) to fall from the very high lockdown-induced peak of 24 per cent in mid-2020 to a low of zero per cent in 2023 (Chart C, right panel). Higher interest rates and easing cost-of-living pressures (as energy prices fall) let the saving ratio settle at around half a per cent from 2025 onwards.
Chart C: Electricity and gas spending and the household saving ratio
The rise in interest rates reduces consumption despite not having much net impact on aggregate incomes, in part because those adversely affected by higher interest rates are likely to cut spending by more than those who benefit from higher interest income.c Falling house prices and lower equity prices will also lower real housing and financial wealth and weigh on consumption. Overall, we expect consumption to fall by 2.7 per cent from the second quarter of 2022 to the third quarter of 2023, before recovering in 2024 and 2025 and then settling at growth of around 2 per cent a year thereafter.
This box was originally published in Economic and fiscal outlook – November 2022