
Box sets » GDP by expenditure » Household consumption
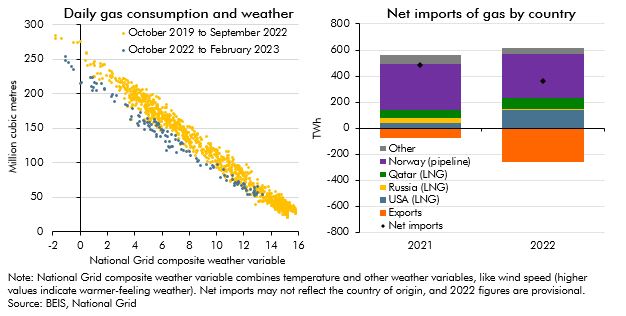
In response to the largest rise in energy prices in around 50 years, an immediate reduction in energy demand, and more gradual change in the composition of energy supply, might be expected. In this box we look at how the sharp rise in the household price of gas has changed households consumption of gas this winter as well as how the Russian invasion of Ukraine and the rise in wholesale gas prices has changed the UK's energy supply over the last year and how it may change further in the future. We then briefly outline how we forecast gas prices and why we do so.
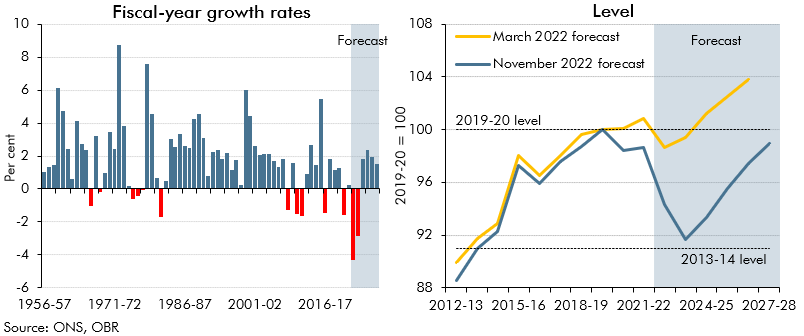
In 2022-23 and 2023-24, living standards are set for the largest fall on record. This box set out our forecast for real household income, the impact of government policy in buffering the income shock, and its implications for our consumption forecast.
In May 2022, the Government announced a package of measures to support households with the cost of living. In this box, we explained how we had adjusted our March 2022 Economic and fiscal outlook forecast for these policies.
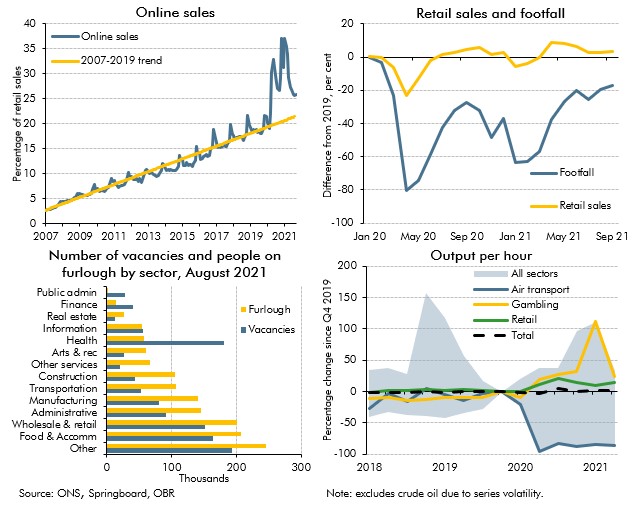
Covid-19 caused dramatic changes in people's behaviour, which affected where, what and how much economic activity took place. In this box we examined the changes which appeared likely to outlast the pandemic, and the progress the economy had made in adjusting to them.
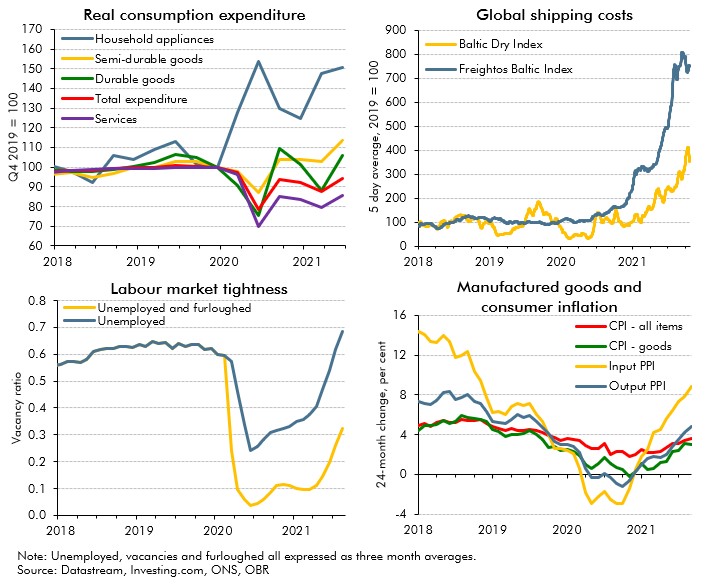
In October 2021 commentators became increasingly concerned that the inability of supply to keep up with demand in specific areas of the economy would hold back the recovery. In this box we examined these 'supply bottlenecks' in energy, product and labour markets, discussing their consequences for wage and price inflation.
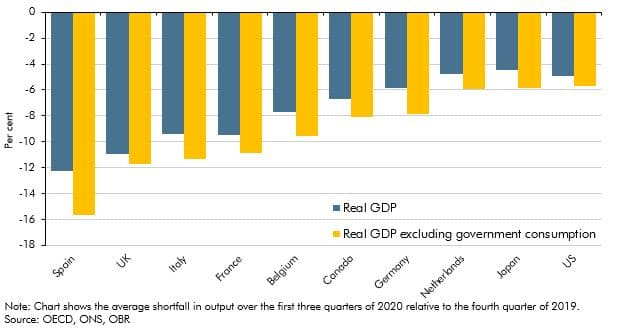
The coronavirus pandemic has affected economies of all countries around the world as a result of public health measures and voluntary social distancing. In this box we assessed how the UK had fared relative to other major advanced economics by examining the effect of using different measures of government output, the composition of these economies and the severity of the virus.
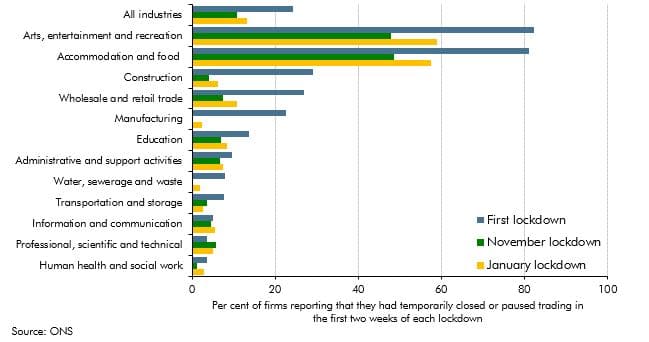
Output held up better in November 2020 than we had expected at the time of our November 2020 forecast. In light of this, this box considered whether the economy had become increasingly adapted to operating under lockdowns and other public health restrictions since the onset of the pandemic, and the implications that this might have had for the economy during the January 2021 lockdown.
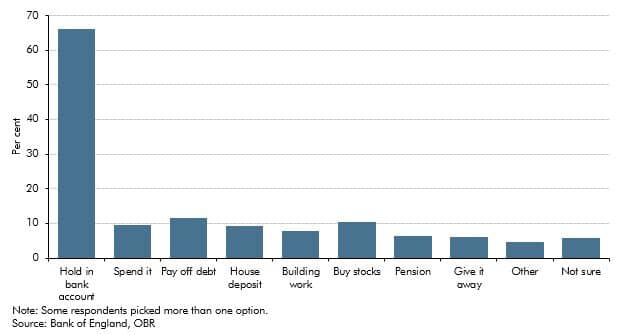
This box explored how the pandemic and associated policy response changed the flow of funds between the different sectors of the UK economy. It then considered the implications of how those flows unwind for the pace and sustainability of the recovery.
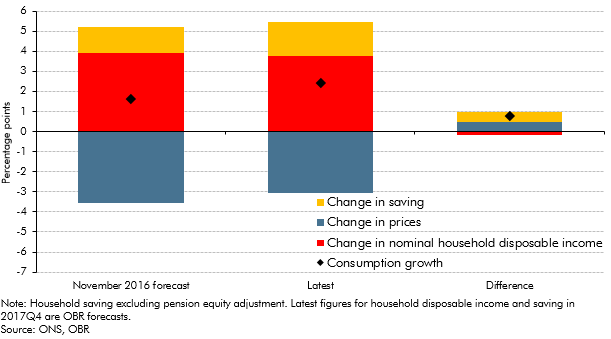
In the November 2016 EFO we made a number of judgements about how the vote to leave the EU would effect the economy in the near-term. This box from our March 2018 EFO compared these judgements against the outturn data that we had received since then, finding that most of these judgements were broadly on track.
In recent years there has been a significant increase in the number of people setting themselves up as single-director companies (‘incorporations’), implying an increase in the share of household income received as dividends. ONS estimates of households dividend income were revised significantly as part of Blue Book 2017, and better capture this rise in incorporations. This box discussed the implications of these revisions, which implied a much higher level of household disposable income and household saving than previous estimates.
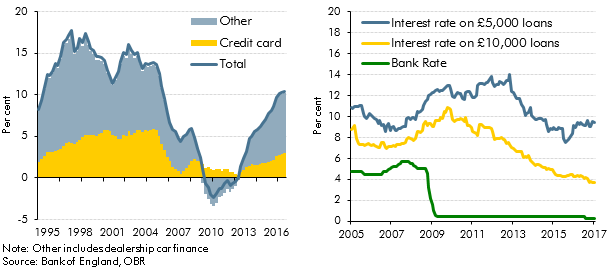
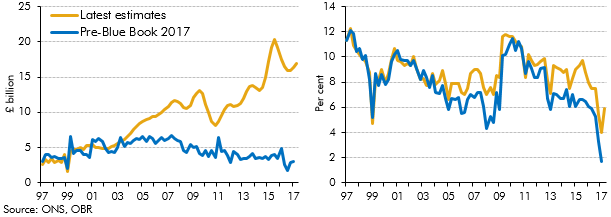
Strong growth in consumer credit in the run-up to our March 2017 Economic and fiscal outlook had prompted concerns among some commentators about its sustainability. In this box we considered the drivers of consumer credit growth, including the role of dealership car finance, and the extent to which it may have supported household consumption growth.
In each Economic and fiscal outlook we publish a box that summarises the effects of the Government’s new policy measures on our economy forecast. These include the overall effect of the package of measures and any specific effects of individual measures that we deem to be sufficiently material to have wider indirect effects on the economy. In our March 2015 Economic and Fiscal Outlook, we made adjustments to nominal GDP, inflation and North sea production.
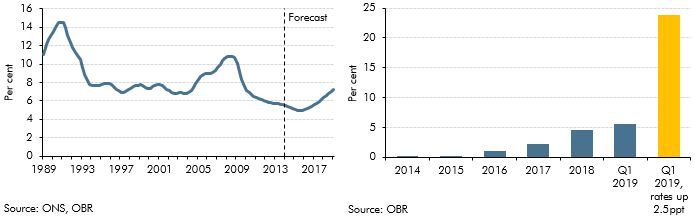
We expected debt servicing costs as a share of disposable income, or ‘income leverage’, to rise as our forecasts for house price inflation outstripped income growth and Bank Rate gradually increased. This box discussed the extent to which mortgage servicing costs were likely to increase over the forecast period and the implications of this for household behaviour, using information from the Bank of England/NMG survey.
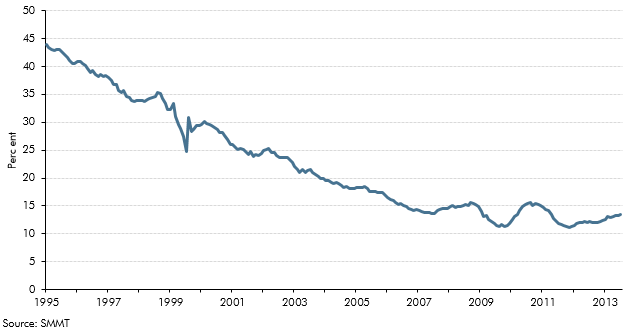
Spending on cars in the UK has grown strongly, accounting for nearly a third of household consumption growth since the third quarter of 2011. This growth was facilitated by car finance, which contributed to strong growth in unsecured credit. This box showed trends in domestic share of car production and contribution of domestic and imported cars to household consumption growth over time. Together, they showed that while domestic car consumption was a good indicator of consumer confidence, and car trade in isolation helped reduce the UK's trade deficit, the overall effect on the economy was less positive.
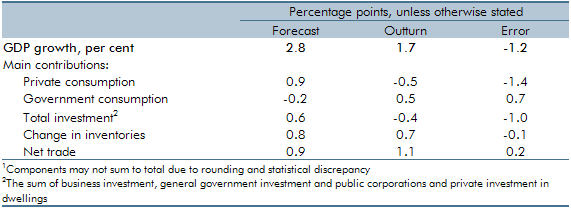
UK GDP had grown less quickly in 2010-11 than the OBR forecast in June 2010. This box decomposed the forecast error by expenditure component and discussed possible explanations, including the external inflation shock.
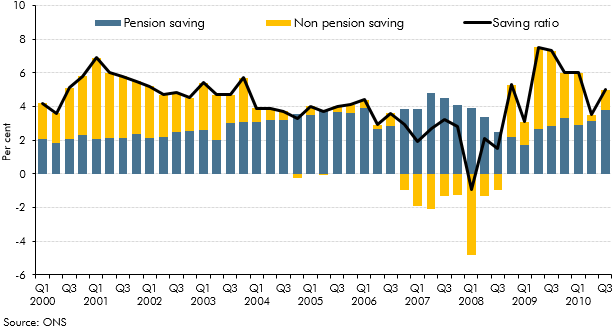
The household saving ratio captures both the disposable income that households do not spend on consumption, and changes in the equity households have in pension funds. This box described how the household saving ratio is calculated, and considered the relative contribution of pension and non-pension saving to the saving ratio over the preceding decade. The box also discussed possible factors behind recent movements in pension saving.