
This box explored how the pandemic and associated policy response changed the flow of funds between the different sectors of the UK economy. It then considered the implications of how those flows unwind for the pace and sustainability of the recovery.
This box is based on Bank of England and ONS data from November and December 2020 and January 2021 .
The pandemic and associated policy response have dramatically changed the flow of funds between the different sectors of the UK economy. How these flows unwind as the pandemic passes has potential implications for the pace and sustainability of the recovery.
Chart H: Difference in net acquisition of assets between the first three quarters of 2020 and the final three quarters of 2019

The National Accounts framework divides the economy into five sectors: government, households, financial corporations and intermediaries, non-financial corporations, and the rest of the world. Any net borrowing on the part of one sector must be accompanied by net lending on the part of another (e.g. a new loan from a bank to a business simultaneously creates an asset for the bank and a liability for the business). The data for the first three quarters of 2020 show dramatic changes in the pattern of flows between sectors, as shown in Chart H:
- The Government has provided financial support to households and businesses that is unprecedented in peacetime. To finance this, in net terms it issued £261 billion gilts (green) in the first three quarters of 2020, compared with £34 billion in the preceding three quarters.
- A roughly equivalent quantity of gilts has been purchased on the secondary market by the Bank of England’s Asset Purchase Facility (APF) as part of its quantitative easing (QE) programme. The Bank has financed the purchase of these gilts (and some corporate bonds) by issuing an equivalent amount of its own liabilities in the form of central bank reserves (blue), leaving the net asset/liability position unchanged.
- These additional reserves all constitute extra (highly liquid) assets of the rest of the financial sector. The counterpart to these extra reserves is primarily the additional deposits from households and non-financial corporations arising from the government’s measures in response to the pandemic (yellow). This also leaves their net lending position broadly unchanged.
- Households have been the most important source of additional lending over this period, increasing their deposits (yellow) by £148 billion in the first three quarters of 2020, over £100 billion more than the £45 billion accumulated in the preceding three quarters. This pandemic-associated increase in household liquid savings has been intermediated to government via the financial sector and the Bank of England through the mechanisms described above.
- While the net lending of non-financial corporations has changed little, that obscures important changes in its composition, with borrowing rising substantially (accumulating £108 billion more in net loans and other liabilities than in the preceding three quarters) but deposit accumulation also rising (by £123 billion). This probably reflects significant heterogeneity in the experience of firms in different sectors, with some taking on more debt while others have prospered.
- The rest of the world net lending position has also changed little, with foreign investors apparently playing a limited role in financing the dramatic increase in government borrowing over the first nine months of the year.
The unwinding of these various financial flows once the pandemic passes has potential implications for the pace and sustainability of the recovery.
Households
While there has been some substitution into purchases of goods and other services (as discussed in Box 2.5), the primary reason for the increased accumulation of household deposits has been the curtailment of social and retail consumption as a result of the public health restrictions, coupled with extensive income support. The strong recovery in consumption in our central forecast over the second half of 2021 is primarily a direct consequence of the re-opening of these parts of the economy as restrictions are relaxed.
The extra household savings accumulated during the pandemic may add extra impetus. By the middle of 2021 households additional deposit accumulation during the pandemic is expected to reach around £180 billion. Were this all to be spent over the next four quarters, it would add around 6 per cent to consumption in 2021 and 2022.
Standard consumption theory suggests, however, that rather than immediately spending all of an unanticipated increment to their wealth (or, equivalently, a temporary increase in their income), households are instead likely to save most of it in order also to allow higher consumption in the future. Empirical evidence typically suggests that annual spending rises by around 5-10 per cent of such an increment, with the effect being larger for poorer households than for richer ones.a A recent Bank of England survey suggests that the rise in savings has indeed been mainly by better-off households, with 42 per cent of high-income households saving more and 16 per cent less, compared to 23 per cent of low-income households saving more and 24 per cent saving less.b
There are, however, several reasons why spending might turn out to be higher. First, there may be a degree of euphoria once the pandemic is past, leading households to wish to treat themselves. Second, spending on durables is a form of saving as the associated flow of services is spread over time. Some durables spending, such as on cars, has been especially weak during the pandemic, and there is therefore scope for a strong rebound. Third, the additional household savings have been held primarily in liquid form, allowing them to be run down more easily.
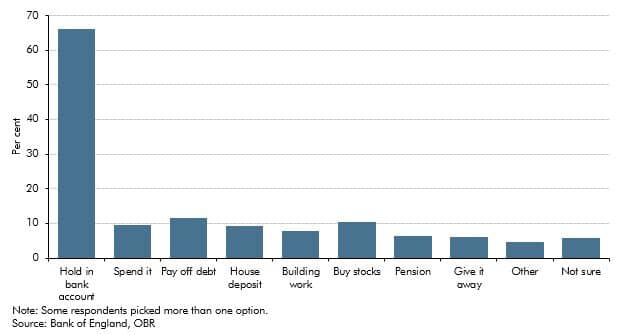
An autumn 2020 Bank of England survey of households’ plans for the additional savings built up during the pandemic found that only 10 per cent planned to spend them with around two-thirds planning to retain them in their bank account (Chart I).c
Chart I: NMG survey responses on what households plan to do with additional savings built up during the pandemic
The consumption path in our central forecast is consistent with households on average spending 5 per cent of the extra deposits accumulated during the pandemic each year, but somewhat front-loaded into the second half of 2021 and first half of 2022. This means that by the end of the forecast period around 25 per cent of the total stock of £180 billion built up during the pandemic will have been used for consumption. Given the difficulties in ‘making up for lost time’ in social consumption (one can only eat so many meals in a day, however expensive), we have assumed that the additional expenditure over the second half of 2021 and first half of 2022 largely goes on the purchase of durable goods whose consumption is more likely to have been delayed.
Businesses
Although the net lending position of businesses has changed little, there is more going on beneath the surface, with additional borrowing largely offset by the accumulation of deposits. In some cases, businesses may have taken advantage of generous government-guaranteed loan schemes to build up extra liquid assets as a precaution, but the juxtaposition of a rise in borrowing with higher deposit accumulation is likely mainly to reflect the heterogeneity in firms’ experiences during the pandemic. For instance, across the second half of 2020 on average three-quarters of the businesses in the hospitality sector reported a fall in turnover relative to normal times compared to just a third in the information and communication sector.d
Businesses’ balance sheets matter for the pace of the recovery in business investment. Those with healthy balance sheets will be well placed to invest as demand and confidence return. But evidence suggests that highly indebted firms face higher borrowing costs and invest less.e
Government
The Government has been able to borrow heavily and cheaply in part because the Bank of England has simultaneously been buying large quantities of gilts on the secondary market. And the flow of funds reveal that the ultimate counterpart of that higher borrowing can be seen mainly in higher domestic household savings. A key question is what will happen if inflationary pressures start to build as the recovery proceeds. In that case, short and long-term interest rates may rise and the MPC may choose to begin unwinding its asset purchases. This potentially raises the cost of servicing the public debt (see Box 4.1) and increases the likelihood that the Government may experience difficulties in finding enough willing buyers for its newly issued debt. That highlights the importance of the Government maintaining the credibility of its commitment to low inflation and sound public finances.
This box was originally published in Economic and fiscal outlook – March 2021