
Box sets » Economic and fiscal outlook - March 2021
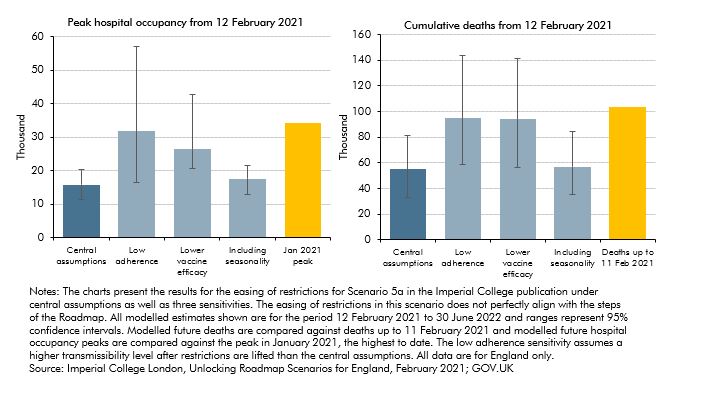
The path of the pandemic and the associated public health restrictions will be the most important near-term determinants of the UK’s economic and fiscal performance. Our March 2021 central forecast was conditioned on the Government’s ‘Roadmap’ for the lifting of restrictions and despite encouraging news regarding vaccines, there remains considerable uncertainty surrounding the future path of the pandemic and the economy. This box considered the uncertainties around key epidemiological assumptions on how the pandemic will unfold.
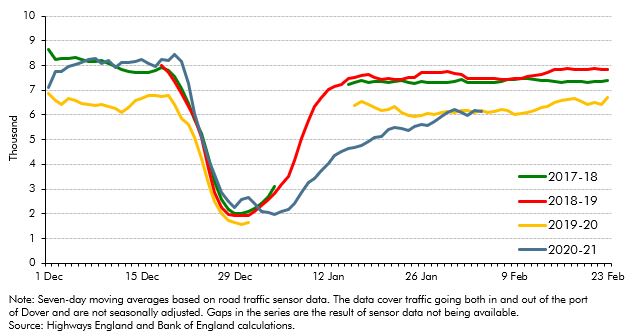
On 24 December, four and a half years after the EU referendum, the UK and the European Union concluded the Trade and Cooperation Agreement (TCA). This box compared the provisions of the TCA against our previous broad-brush assumption that UK-EU trade would take place under the terms of a ‘typical’ free-trade agreement. It also discusses the initial evidence regarding its short-term impact.
In each Economic and fiscal outlook we publish a box that summarises the effects of the Government’s new policy measures on our economy forecast. These include the overall effect of the package of measures and any specific effects of individual measures that we deem to be sufficiently material to have wider indirect effects on the economy. In our March 2021 Economic and fiscal outlook, we adjusted our economy forecast to take into account plans to loosen fiscal policy in 2021-22, before tightening from 2023-24 onwards, as well as for several specific measures, including the impact on our business investment forecast of temporarily much more generous capital allowances.
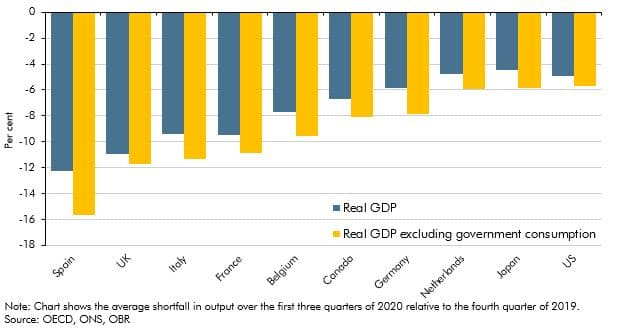
The coronavirus pandemic has affected economies of all countries around the world as a result of public health measures and voluntary social distancing. In this box we assessed how the UK had fared relative to other major advanced economics by examining the effect of using different measures of government output, the composition of these economies and the severity of the virus.
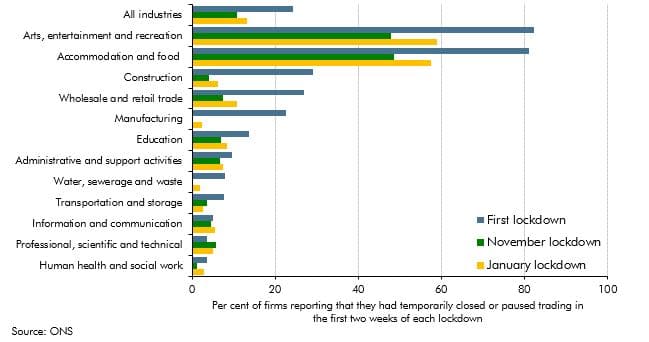
Output held up better in November 2020 than we had expected at the time of our November 2020 forecast. In light of this, this box considered whether the economy had become increasingly adapted to operating under lockdowns and other public health restrictions since the onset of the pandemic, and the implications that this might have had for the economy during the January 2021 lockdown.
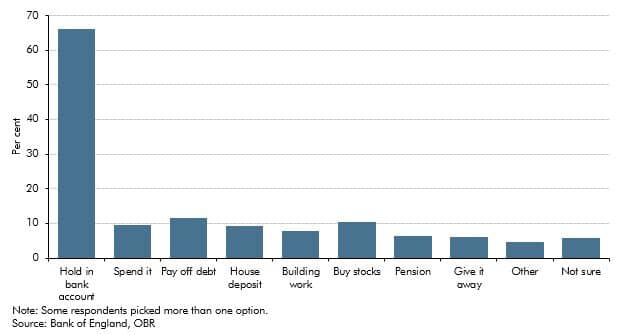
This box explored how the pandemic and associated policy response changed the flow of funds between the different sectors of the UK economy. It then considered the implications of how those flows unwind for the pace and sustainability of the recovery.
In the March 2021 EFO we estimated that policy measures responding to the coronavirus pandemic would add £344 billion to borrowing, with these policies announced across a number of statements beginning alongside the March Budget. This box updated on our estimate of this cost from November and the relative shares of support going to households, businesses and for public spending.
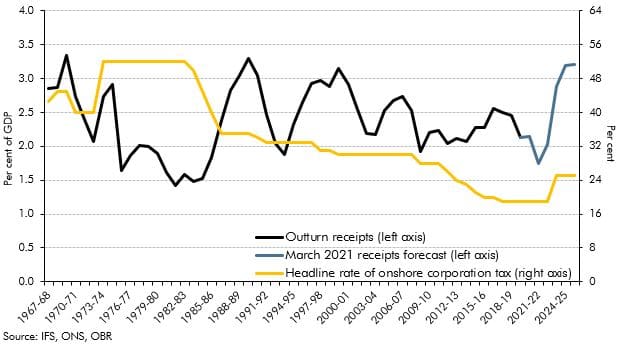
The rise in the main rate of corporation tax (CT) announced at Budget 2021, from 19% to 25% – from 2023-24, marks the first rise in the main rate of onshore CT since 1974. This box put this policy change in its historical and international context, by looking at onshore CT receipts as a share of GDP within the UK since its inception in 1965, and by looking at other corporate tax rates across OECD countries.
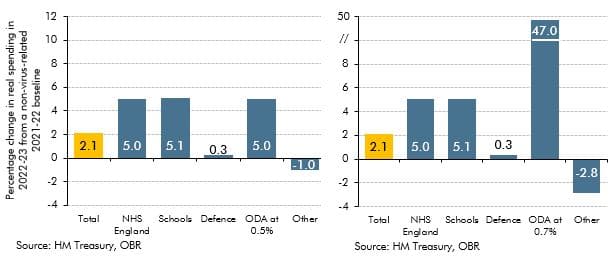
This box discussed the risks to our medium-term forecast of day-to-day departmental (RDEL) spending, particularly in relation to the impact of the pandemic.
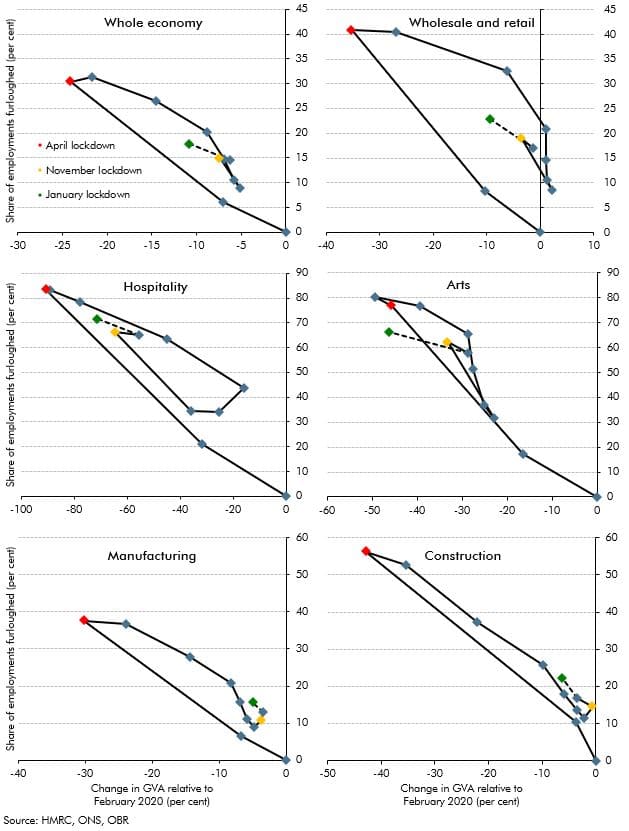
In this box, we discussed how the hospitality, wholesale and retail, arts, manufacturing and construction sectors, as well as the economy as a whole, adapted the usage of the furlough scheme in relation to output, and commented on the increased level of employees on furlough relative to the loss in output in the November 2020 and January 2021 lockdowns when compared with the April 2020 lockdown.
On 4 February 2021 the Government published its response to the December 2018 Court of Appeal ruling that the transitional protection arrangements in place across public service pension schemes based on years from retirement constituted a form of unlawful discrimination on the basis of age, commonly known as the ‘McCloud-Sargeant case’. This box explored the potential fiscal impacts of the Government’s remedy, as it was not possible to reflect the costs directly in our March 2021 EFO due to remaining uncertainty around the schemes’ implementation of the response.
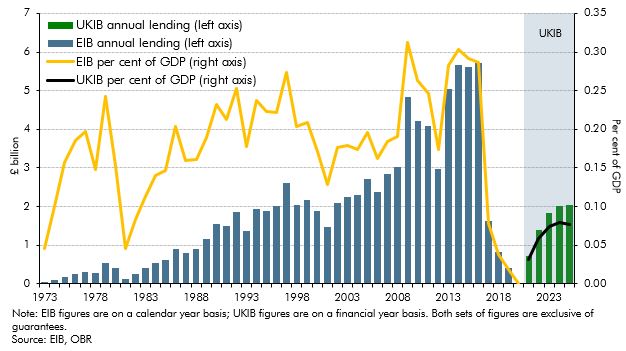
The Government announced the establishment of a new UK Infrastructure Bank (UKIB) at Budget 2021 to tackle climate change and support regional and local economic growth. It does this in part by replacing some of the activity of the European Investment Bank (EIB). This box looked at how UKIB will operate and how this compares to the EIB, as well as briefly exploring potential fiscal and classification risks.
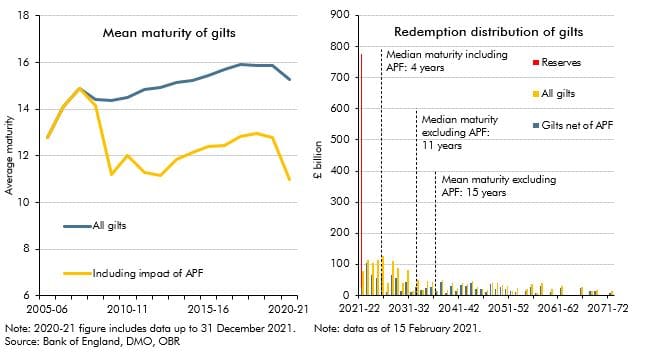
The average maturity of UK government bonds is longer than the average maturity of government debt in most other advanced economies. But the average maturity of the net debt of the public sector as a whole (including the Bank of England) has shortened considerably since the global financial crisis. In this box, we explored how the Bank of England's quantitative easing operations have shortened the maturity of public sector net debt, dramatically increasing the sensitivity of debt interest spending to changes in short-term interest rates.