
The rise in the main rate of corporation tax (CT) announced at Budget 2021, from 19% to 25% – from 2023-24, marks the first rise in the main rate of onshore CT since 1974. This box put this policy change in its historical and international context, by looking at onshore CT receipts as a share of GDP within the UK since its inception in 1965, and by looking at other corporate tax rates across OECD countries.
This box is based on HMRC, IFS, OECD, ONS and OBR data from April 2020, July 2020 and February 2021 .
A decade ago, the headline rate of onshore corporation tax (CT) stood at 28 per cent. Over the following seven years, the Coalition and then Conservative Governments cut it gradually to an all time low of 19 per cent in 2017-18 and had announced a further cut to 17 per cent to take effect in April 2020. That last step down was cancelled in last year’s Budget, while in this Budget the Chancellor has decided to raise it back to 25 per cent with effect from April 2023.
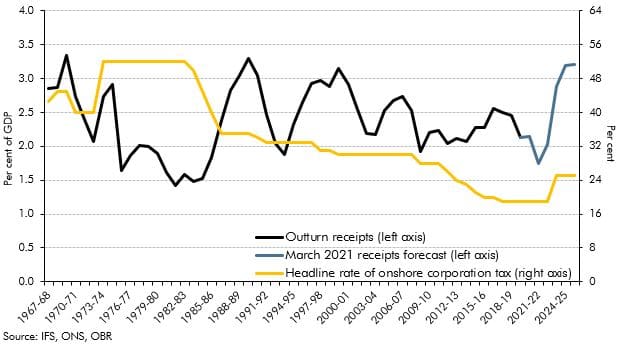
The rise in the headline rate takes our forecast for onshore CT receipts in 2025-26 up to 3.2 per cent of GDP, its highest level since the height of the Lawson boom in 1989-90, and far above the 2.4 per cent average of the past five decades. Chart B shows that the headline rate has fallen steadily over this time. This Budget represents the first announced rise in the rate since Denis Healey raised it from 40 to 52 per cent in his 1974 Budget. But despite this downward path for the headline rate, onshore CT receipts have fluctuated around a fairly stable average relative to GDP. In the tax’s 55 years in existence, they have only exceeded 3 per cent of GDP in three brief periods:
- Corporation tax was introduced in 1965 and by 1969-70 it raised 3.3 per cent of GDP, which remains the highest on record. In part that reflects the 45 per cent headline rate.
- Between 1988-99 and 1990-91, onshore CT raised 3.1 per cent of GDP on average. This was a period in which the economy was overheating and profits had risen materially as a share of GDP (from 15.0 to 20.6 per cent between 1981-82 and 1989-90).
- Between 1997-98 and 1999-2000, onshore CT receipts averaged 3.0 per cent of GDP. Again, this was a period of strong growth as the dotcom bubble inflated before bursting in 2000. The peak in 1999-00 also reflects the temporary boost from the introduction of the quarterly instalment regime for larger companies, which required earlier payment of liabilities.
Chart B: Onshore corporation tax receipts versus the headline rate
The fact that onshore CT revenues have fluctuated around a broadly constant average while the headline rate has fallen largely reflects a widening of the tax base over time. Chart C focuses on this pattern over the past decade, by comparing the headline rate against a measure of the ‘effective tax rate’, defined as receipts as a share of overall profits.a This captures other aspects of the tax system, such as the generosity and take-up of various reliefs and deductions that mean taxable profits vary relative to total profits. It shows that:
- Between 2010-11 and 2017-18, the headline rate was cut by 9 percentage points, but the effective tax rate remained almost unchanged. As we have set out before,b the cost of successive rate cuts was offset by the yield from progressively tighter restrictions on the scope of allowances and reliefs via policy measures. This was overlaid by the recovery in profits following the financial crisis, which led to a fall in the use of loss reliefs.
- By contrast, between 2020-21 and 2025-26, our forecast shows the headline and effective tax rates rising broadly in step (by 6 and 5.7 percentage points respectively). This reflects the fact that the rise in the headline rate has not been accompanied by any permanent reversal of the restrictions on reliefs in the medium term. It also takes the effective rate 5 per cent above its 2010-11 level when the headline rate was 28 per cent. The path is distorted somewhat by the large temporary expansion of reliefs announced in the Budget (the capital allowances super deduction and extended loss carry backs). Abstracting from these, the effective tax rate rises steadily (and somewhat more smoothly than the headline rate because of the decline in deductions relative to profits in our underlying forecast.)
Chart C: Effective tax rate versus the headline tax rate

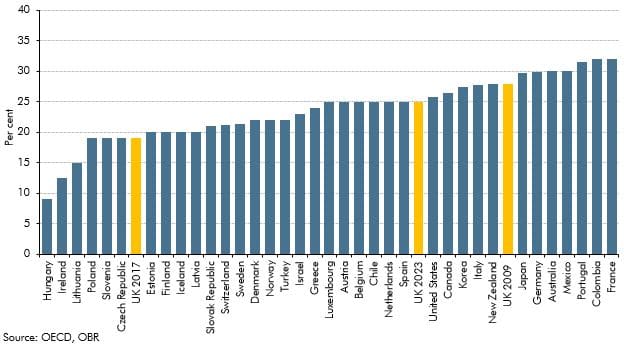
Chart D puts the rise in the headline tax rate in the context of equivalent rates in 2020 across 37 OECD countries (many of which have been cutting rates over the past decade). The 2010-11 rate inherited by the Coalition Government would be the joint eighth highest in today’s terms; while the 19 per cent rate inherited by the current administration places the UK joint fourth lowest. Today’s changes, which come into effect in 2023-24, would, absent any changes to other countries’ rates, see the UK return to the top-half of the international league table. But it is of course possible that other countries will make similar decisions about how to respond to the fiscal legacy of the pandemic and raise corporation tax rates too.
Chart D: International comparison of corporate tax rates in 2020
This box was originally published in Economic and fiscal outlook – March 2021