
Box sets » Receipts
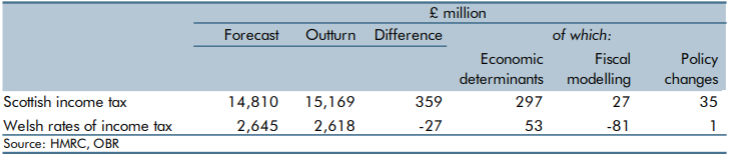
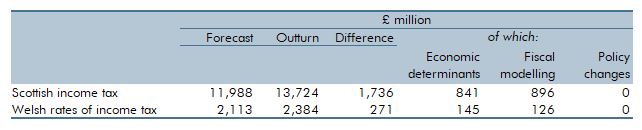
Income tax was devolved to the Scottish Parliament in 2016 and the Welsh Senedd in 2019. In this box we evaluated our March 2022 forecasts for 2022-23, and how they compared to the eventual outturn data. We explained the drivers behind the differences between our inital forcasts and final outturn behind the 2.4 per cent surplus for Scotland and 1.0 per cent shortfall in Wales. This was a particularly difficult period to forecast given the economy was recovering from the unprecedented impact of the Covid-19 pandemic.
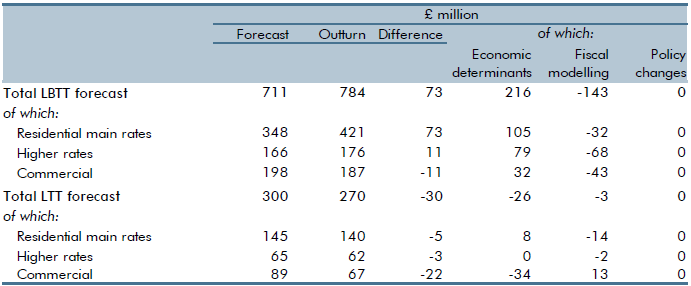
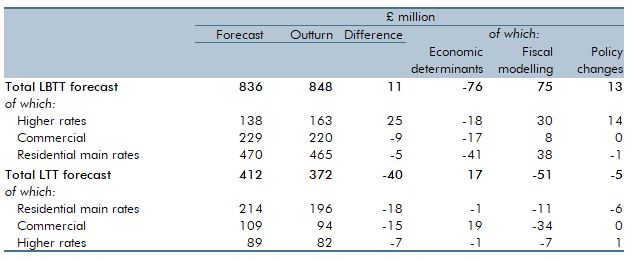
The land and buildings transaction tax (LBTT) was implemented in Scotland on April 1 2015 while the land transactions tax (LTT) began in April 1 2018. Both taxes replaced the UK Government’s stamp duty land tax but operate in similar ways. In this box we evaluated our March 2023 forecasts for 2023-24, and how they compared to the eventual outturn data. We explained the reasons behind the 10.3 per cent surplus for LBTT and the 9.9 per cent shortfall for LTT.
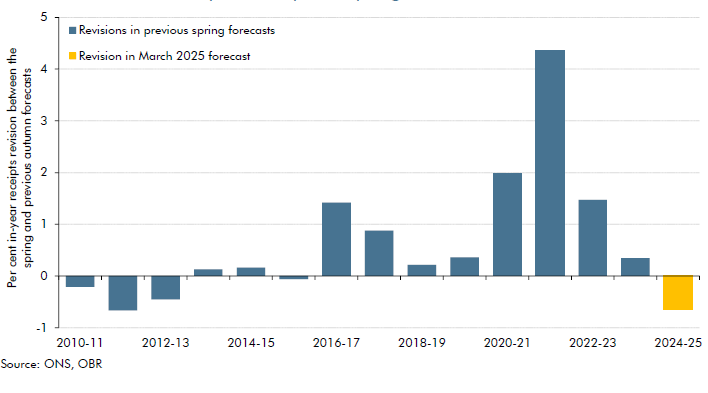
Our March 2025 forecast for 2024-25 receipts is £7.5 billion below our October 2024 forecast. This box compared this shortfall to past Autumn to Spring forecast changes, explained the reasons for this shortfall, and described its impacts on the forecast.
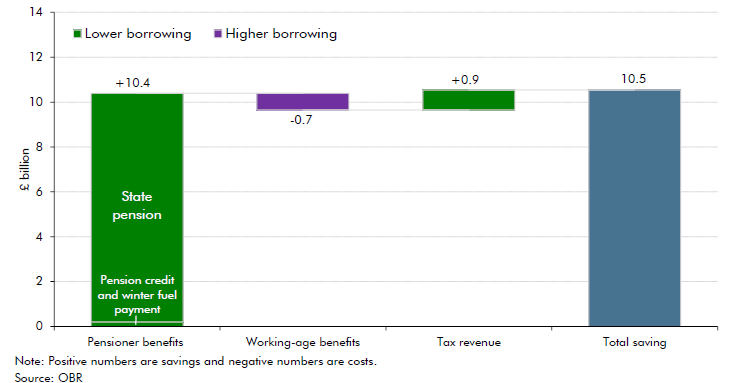
As life expectancy has increased, successive governments have increased the state pension age, and it next increases between 2026 and 2028 from 66 to 67. In this box, we estimated the impact of this increase on pensioner welfare spending, working-age welfare spending, and tax revenue.
As we finalised our pre-measures forecast on 26 September, our forecast did not include the Quarterly National Accounts released on 30 September 2024, which contained Blue Book 2024 consistent revisions. This box examined the potential implications that including the latest data may have had on our forecast. We judged that the data revisions would have provided limited new information on current economic conditions, leaving our economic and fiscal forecast broadly unchanged.
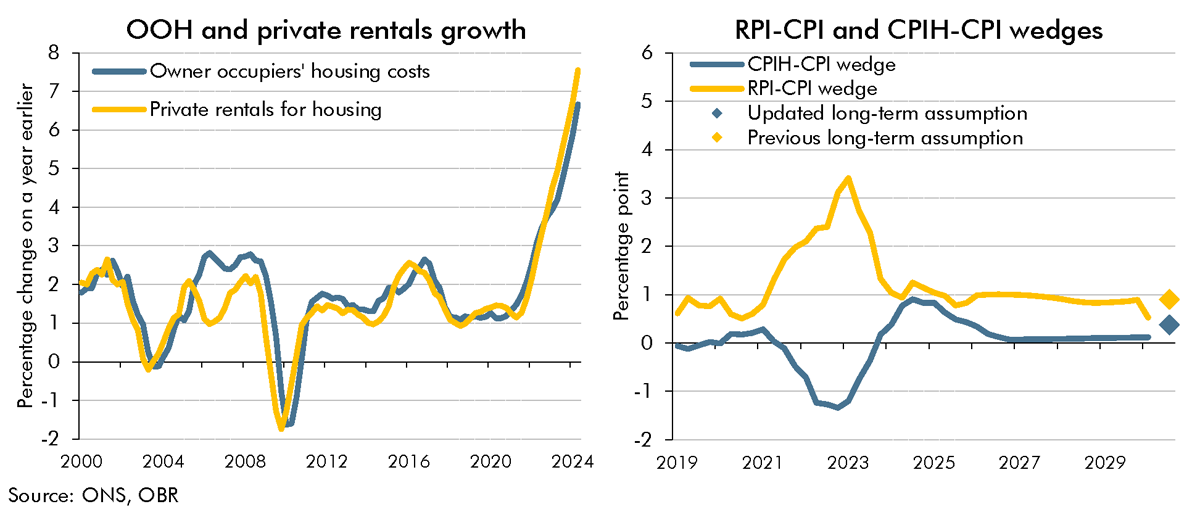
As as result of the shortcomings with the methodology for calculating the Retail Prices Index (RPI), the ONS's current plans are to address these by bringing the methods and data sources from the Consumer Prices Index including owner occupiers' housing costs (CPIH) into the RPI in February 2030. In this box, we explained how this change would impact our estimate of the long-run difference between RPI and CPI inflation.
The capital tax measures announced in the October 2024 Budget affected an overlapping set of taxpayers and tax bases, mainly across capital gains tax, inheritance tax and income tax. In this box, we considered how individuals can respond to an increase in a capital tax liability, and what we assumed about these behaviours in our costings for capital tax measures.
Income tax was devolved to the Scottish Parliament in 2016 and the Welsh Senedd in 2019. In this box we evaluated our March 2021 forecasts for 2021-22, and how they compared to the eventual outturn data. This was a particularly difficult period to forecast given the economy was recovering from the unprecedented impact of the Covid-19 pandemic. The double-digit difference between our initial forecast and the final outturn, for both Scotland and Wales, is largely explained by the faster-than-expected post-pandemic recovery.
The land and buildings transaction tax (LBTT) was implemented in Scotland on April 1 2015 while the land transactions tax (LTT) began in April 1 2018. Both taxes replaced the UK Government’s stamp duty land tax but operate in similar ways. In this box we evaluated our March 2022 forecasts for 2022-23, and how they compared to the eventual outturn data. We explained the reasons behind the 1.4 per cent surplus for LBTT and the 9.6 per cent shortfall for LTT.

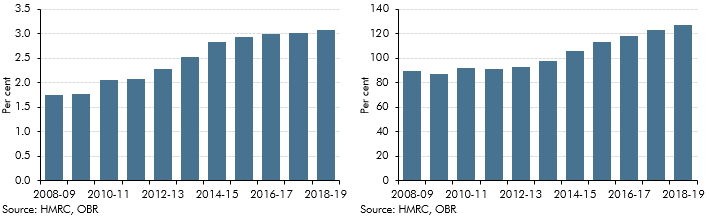
The tax gap is the difference between taxes collected by HMRC and the theoretical liability, or what, in theory, should be collected. As a share of GDP, it has reduced from 2.3 per cent in 2005-06 to 1.5 per cent in 2021-22, two-thirds of which is explained by reductions in the VAT gap. In this box, we explored the recent drivers of changes in tax gaps, explained what assumptions we make about tax gaps in our forecast and outlined the associated uncertainties.
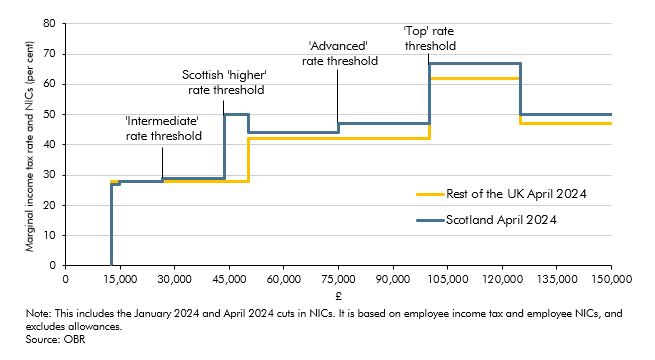
Income tax was devolved to the Scottish Government in 2016 and policy changes since then have led to a divergence with the UK Government’s income tax system. In this box we explored the costing of the Scottish Government’s December 2023 decision to introduce a new 45 per cent ‘advanced’ rate and to raise the ‘top’ rate to 48 per cent, including the potential behavioural responses.
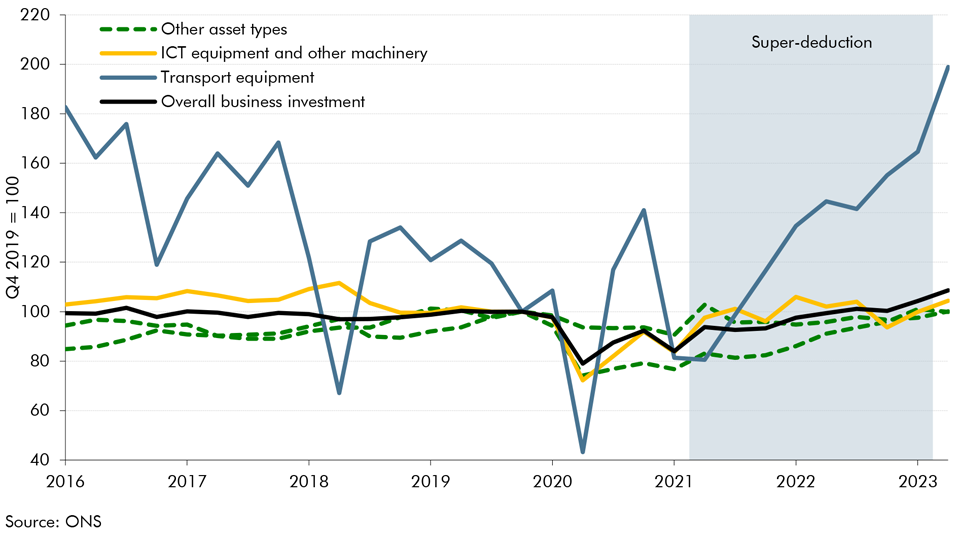
Over the last 3 years, the UK corporation tax system has witnessed four major changes which have consequences on the outlook for business investment. In this box, we explored the effect of the corporation tax rate rise and the super-deduction on investment, before assessing the impact of moving from temporary to permanent full expensing as announced in this Autumn Statement.
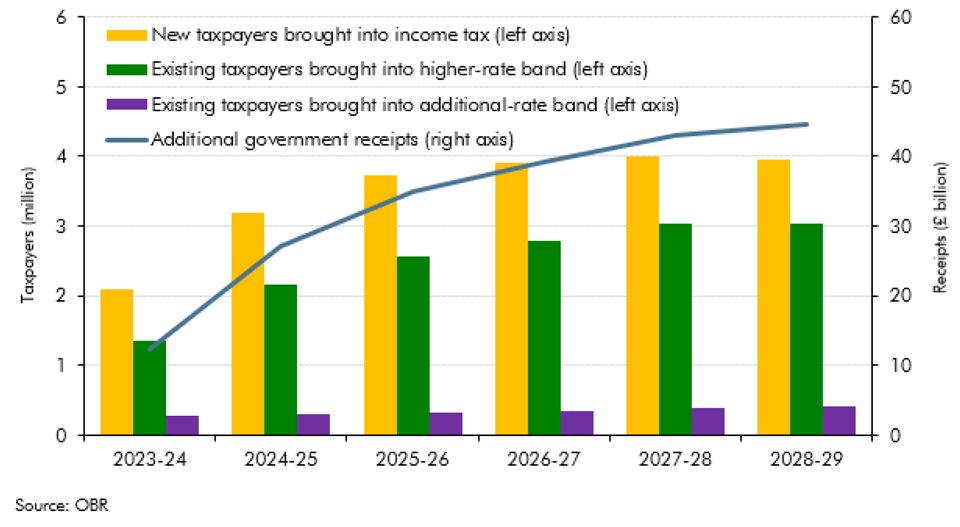
This box discussed the continuing impact of the multiple freezes and changes to personal tax thresholds between March 2021 and November 2022. It provided an update on the estimated receipts from these policies, and the additional number of tax payers by tax band.
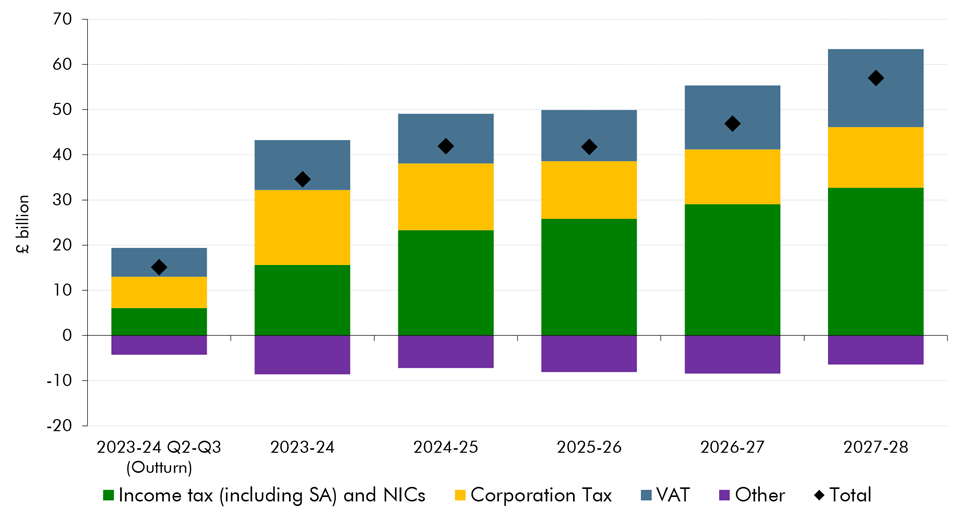
We have made a significant upward revision to our pre-measures receipts forecast. This box explored the drivers behind the revision, which taxes drive the revision and how much of this change is due to real GDP, inflation and the effective tax rate.
The transition to electric vehicles (EVs) has direct fiscal implications for fuel duty revenues (and, to a lesser extent, vehicle excise duty). In this box we explained why we have revised down our EV assumptions and the impact of this revision on fuel duty and VED revenues.
In our March 2023 Economic and fiscal outlook, we evaluate the impact of the freeze or reduction of various personal tax thresholds since April 2021. This box looked at the receipts generated by these measures as well as the impact on taxpayers: the number of new taxpayers these measures create and the number of taxpayers pulled into higher and additional rates.
In our March 2023 Economic and fiscal outlook, we evaluate the distorting impact of the frozen VAT registration threshold – the turnover threshold at which firms must register for VAT. This box looked at the tendency for businesses to bunch just below the threshold, as they limited their turnover to avoid needing to register. At the time of the box the threshold had been frozen at £85,000, and was due to remain at that level until the end of March 2026.
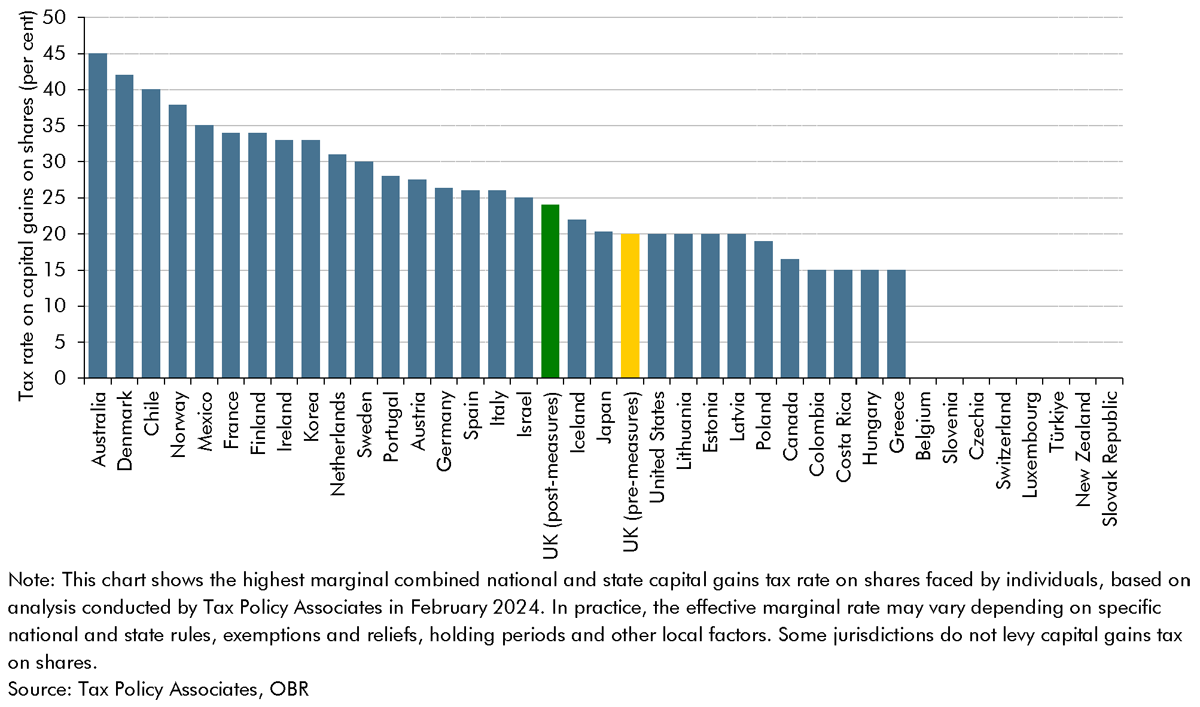
In our March 2023 Economic and fiscal outlook, we forecast that the UK's tax burden was set to rise to a post-war high. This box considered the UK's tax burden in international and historical context.
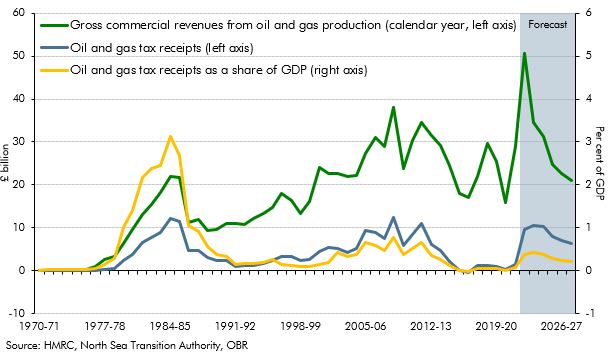
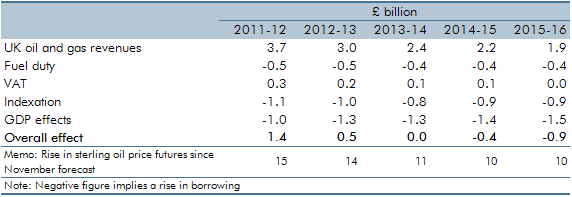
In our March 2023 Economic and fiscal outlook, we forecast that North Sea oil and gas receipts would rise sharply in the near-term to close to their all-time high in cash terms. This box explored the evolution of receipts since the discovery of North Sea oil and gas.
The impact of the pandemic and the national lockdowns has not been equal across the earnings distribution. While it was expected that income tax receipts would be significantly impacted, this box showed that the growth in receipts from higher earners has more than outweighed the fall in receipts from the lowest earners.
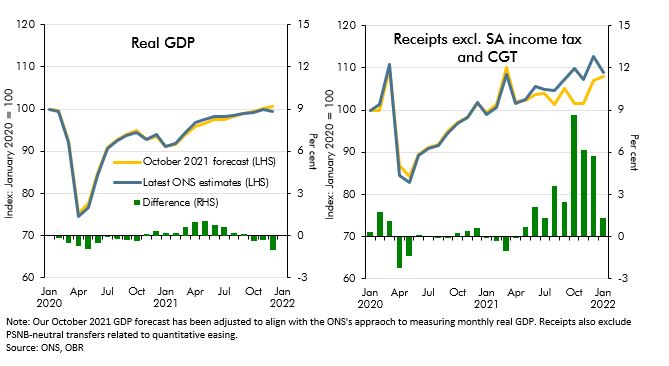
Since our October 2021 EFO the real economy has performed largely as expected in 21-22 but tax receipts have come in well above that forecast. In this box, we examined reasons why tax receipts have recovered so quickly particularly in comparison to economic data.
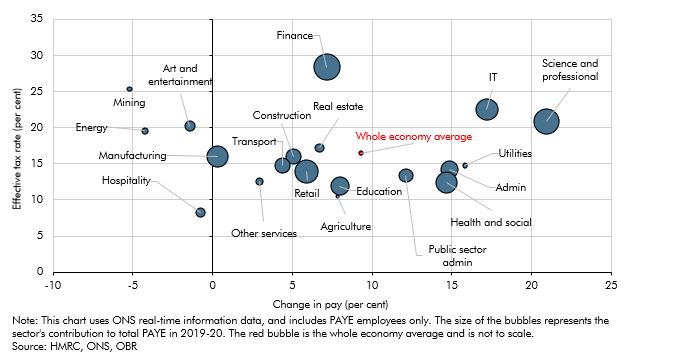
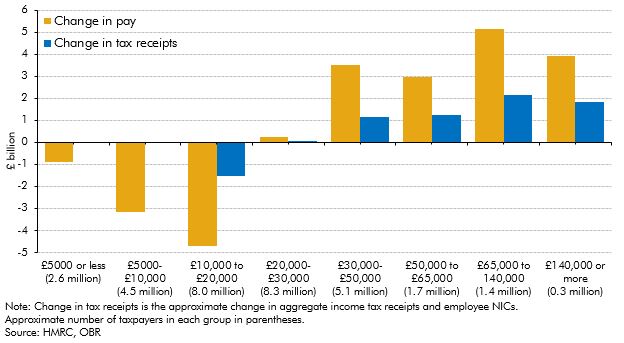
This box considered the reasons for particular strength in income tax receipts since 2019. It covered the growth in aggregate pay across the income distribution using RTI data; looked at pay growth and effective tax rate by sector since 2019; and finally at how the freeze to tax thresholds from April 2022 will compound this strength in receipts.
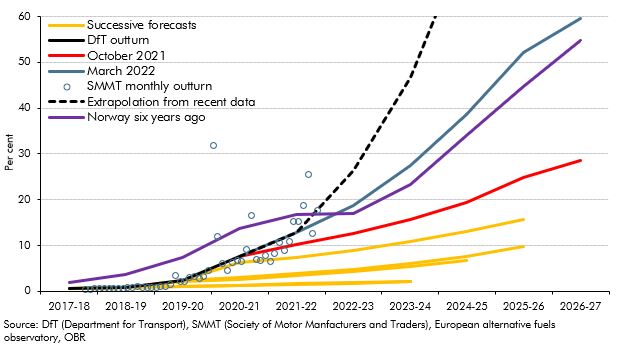
This box outlined the recent growth in electric vehicle sales and the fiscal implications of this and the role of policy in the transition.

The pandemic generated only modest structural damage to the fiscal position but did still create a gap in what the Chancellor considered a sustainable fiscal position. This box compared the scale of fiscal consolidation facing the chancellor and his approach to repairing the public finances with the challenge that faced Chancellor George Osborne after the financial crisis.
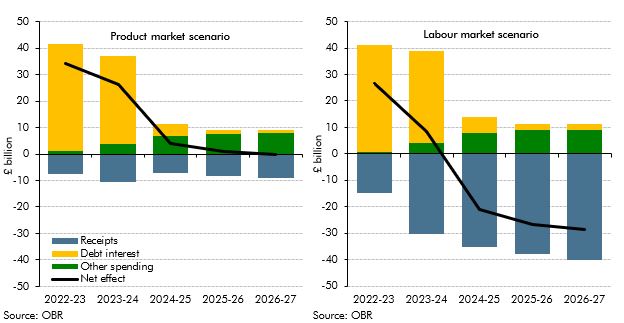
The level and nature of inflation has consequences for the public finances. This box explored the fiscal consequences of the sharp rise in inflation since our March 2021 forecast and examined the fiscal effects of the two scenarios described in Box 2.6 in our October 2021 EFO one where inflation is driven mainly by pressures in the product market, and the other mainly pressures in the labour market. The box concluded the labour market inflation scenario was significantly more beneficial for the public finances.
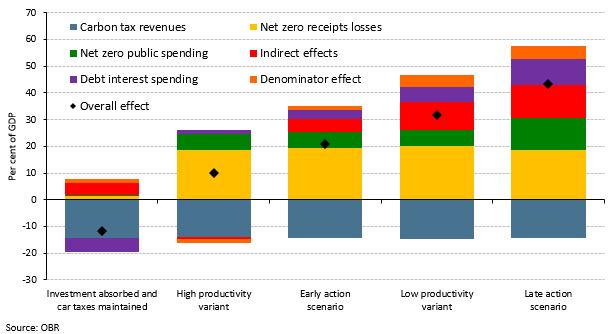
Our 2021 Fiscal risks report explored the fiscal risks posed by climate change and the Government’s commitment to reduce the UK’s net carbon emissions to zero by 2050. This box examined the policies announced in the Budget, Spending Review, and Net Zero Strategy in October 2021, and the significant rises in market prices for hydrocarbons since we completed our Fiscal risks report, and how they had changed the risks associated with climate change and decarbonisation.
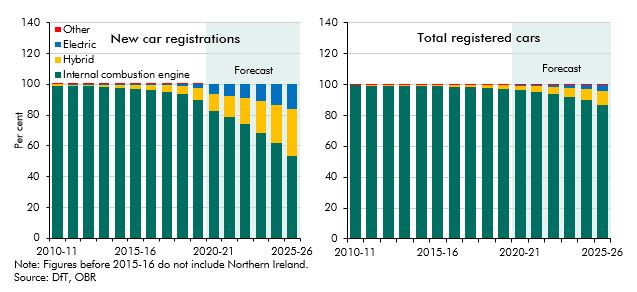
With the sale of new petrol and diesel cars to be banned from 2030, the transition to electric vehicles is a key element in the UK’s path to net zero emissions. This box outlined the recent growth in alternatively fuelled vehicle sales, the fiscal implications of this and the role of policy in the transition.
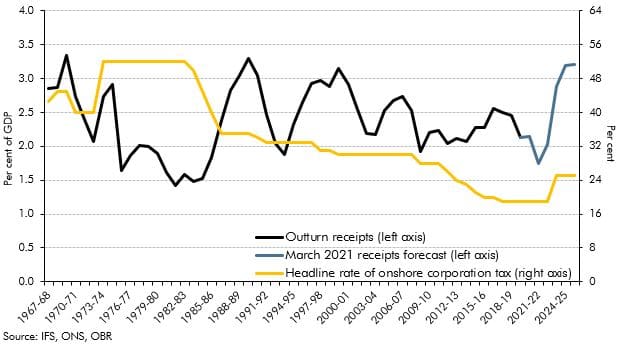
The rise in the main rate of corporation tax (CT) announced at Budget 2021, from 19% to 25% – from 2023-24, marks the first rise in the main rate of onshore CT since 1974. This box put this policy change in its historical and international context, by looking at onshore CT receipts as a share of GDP within the UK since its inception in 1965, and by looking at other corporate tax rates across OECD countries.
On 8 July, the Chancellor announced further measures to support the economy as the lockdown is eased, which we were not notified of in sufficient time to incorporate into our scenarios. This box described the measures included in the package and the costs as estimated by the Treasury.
So far during the lockdown period, many businesses are struggling to meet their usual tax payment schedules and are seeking instead to delay those payments. In this box we considered the channels through which this might impact tax receipts and set out the key uncertainties in our medium-term scenario assumptions.
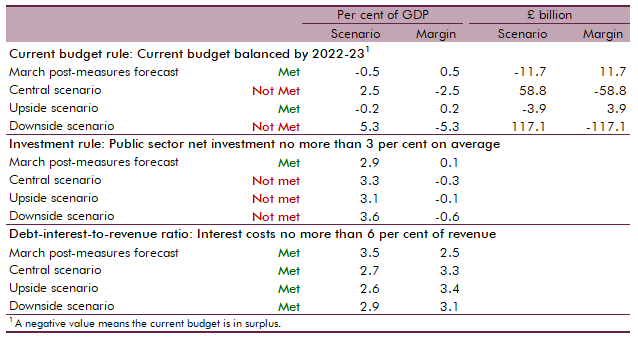
At Budget 2020 we assessed the Government's performance against the three proposed fiscal rules that featured in the Conservative Party's 2019 election manifesto. In this box we assessed whether the Government could meet these fiscal rules under our central, upside and downside scenarios.
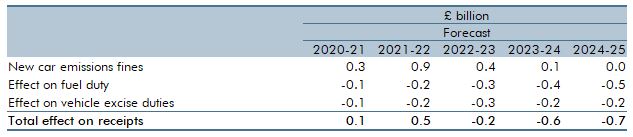
In April 2019, the European Parliament and Council adopted new regulations to set mandatory emissions targets for new cars. Ahead of our March 2020 EFO, the Government told us that all of these provisions transferred into UK law on 31 January 2020 under the terms of the EU Withdrawal Act. In this box we considered the effect of this change on the UK public finances.
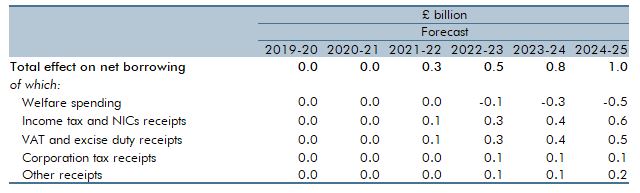
In February 2020, the Government announced its intention to introduce a ‘points-based’ migration system from January 2021 that will align migration policy for EU and non-EU migrants. In this box we looked at the effect of the new migration regime on our borrowing forecast.

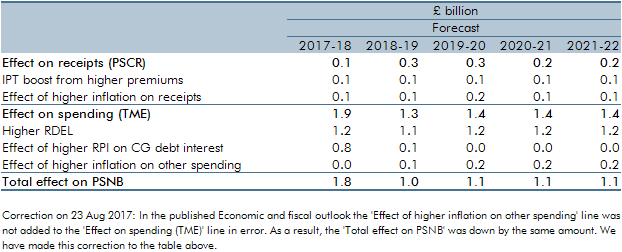
One unforeseen economic development affecting our March 2016 forecast was the upside surprise in inflation in 2017-18 as a result of the fall in the exchange rate. This box described the effect of that surprise on receipts, spending and borrowing.
In recent years, onshore corporation tax receipts have repeatedly surprised on the upside. This box described the drivers behind that strength, in particular the contribution from a rising effective tax rate despite cuts to the headline rates.
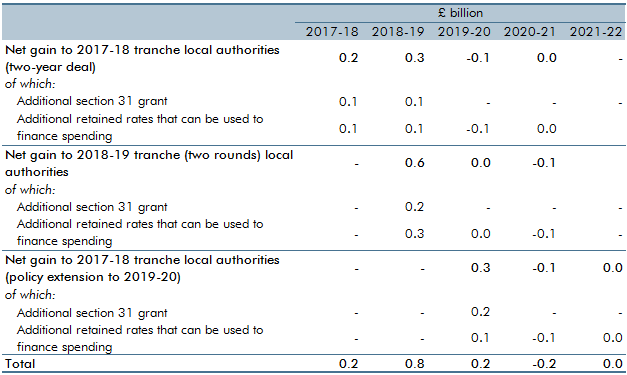
The Government has been piloting full business rates retention since 2017-18. These pilots featured in our forecasts from March 2017. This box reconsidered and re-estimated the fiscal effects of the 100 per cent local retention pilots scheme.
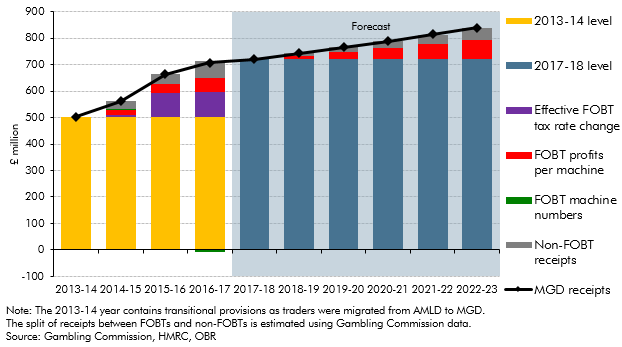
In 2017, the Government announced plans to reduce maximum permitted stakes on fixed-odds betting terminals (FOBTs) from £100 to between £50 and £2. This box from our March 2018 EFO explored recent trends in machine games duty (MGD) receipts and the contribution of FOBTs to them, illustrating the scale of receipts that might be affected by the planned policy change.
In each Economic and fiscal outlook we publish a box that summarises the effects of the Government’s new policy measures on our economy forecast. These include the overall effect of the package of measures and any specific effects of individual measures that we deem to be sufficiently material to have wider indirect effects on the economy. In our November 2017 Economic and fiscal outlook, economy forecast adjustments included the effects of looser fiscal policy on GDP, the effects of tax policy changes on inflation and the effects of stamp duty relief for first-time-buyers on house prices.
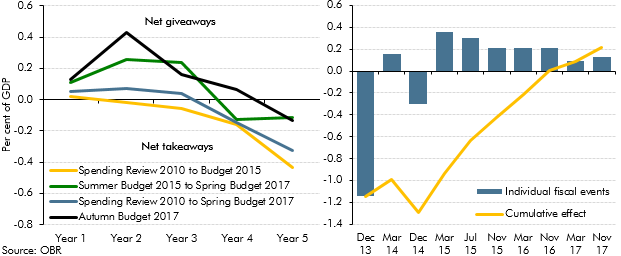
In each Economic and fiscal outlook we incorporate the impact of the policy decisions announced in the Chancellor’s Budget or other fiscal statement (the ‘fiscal event’). This box looked at how measures announced at the previous 16 fiscal events had tended to announce near-term giveaways but with the promise of takeaways in the later years. The Autumn Budget saw this pattern repeated.
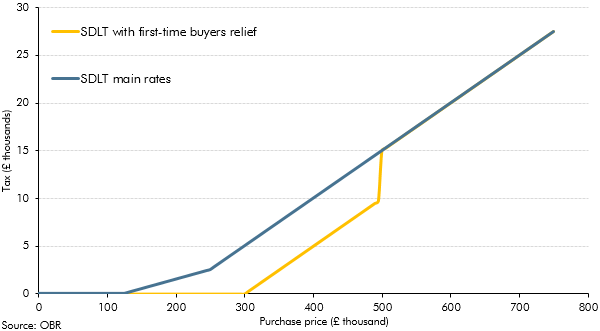
In Autumn Budget 2017, the Government announced the introduction of a permanent stamp duty land tax (SDLT) relief for first-time buyers. This box considered the effects of a previous temporary relief for first-time buyers and how the new permanent relief was expected to affect tax receipts and house prices.
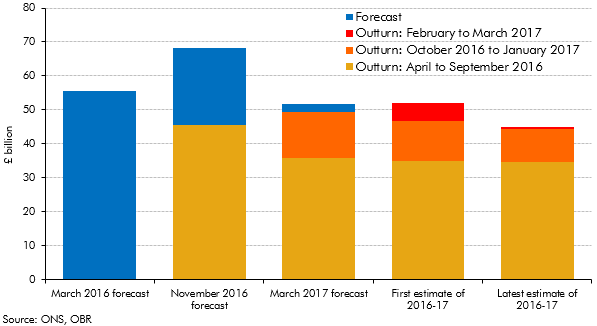
Initial estimates of the deficit can be revised significantly over subsequent months as more reliable data become available. This box set out how our forecasts during 2016 and 2017 evolved and how the outturns for 2016-17 were revised over time.
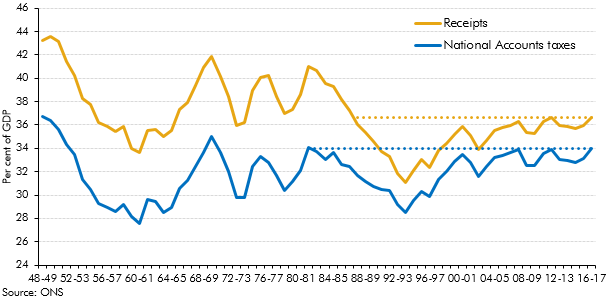
Strong overall receipts growth in 2016-17 took receipts as a share of GDP to their highest since 1986-87. This box explored how the composition of the public sector’s income has changed over the three decades since receipts were last at the latest share of GDP.
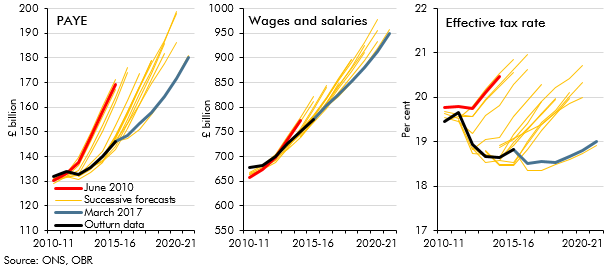
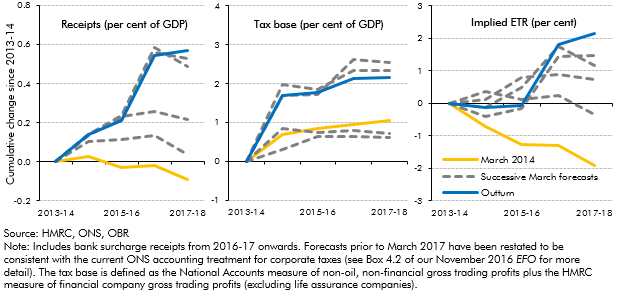
PAYE income tax is the Government’s single most important source of revenue, and one where our forecasts since 2010 have tended to be revised down over time. In this box from our March 2017 Economic and fiscal outlook, we explored the role that changes in the distribution of earnings might have played in explaining the shortfalls in income tax receipts.
In February 2017, just ahead of the Spring Budget and our March Economic and fiscal outlook, the Ministry of Justice announced that the ‘personal injury discount rate’ would be reduced from 2.5 to minus 0.75 per cent (in inflation-adjusted real terms). This box explained the direct and indirect effects of this change on our receipts and public spending forecasts.
Ahead of our March 2017 Economic and fiscal outlook, self-assessment tax receipts indicated that the Summer Budget 2015 reforms to the taxation of individual dividend income had prompted even greater income shifting than we had expected. The reforms raised the basic, higher and additional rates by 7.5 percentage points from April 2016 and introduced a tax-free allowance on the first £5,000 of taxable annual dividend income. They were pre-announced, giving taxpayers around eight months to bring forward dividend income into 2015-16 so that it was taxed at the lower rate. This box considered the amount of income brought forward and the effect of that on tax receipts.
Our post-EU referendum publications noted many direct or indirect Brexit-related uncertainties across our economy and fiscal forecasts. One area that will be directly affected after Brexit is customs duties. In our March 2017 Economic and fiscal outlook, this box outlined the how customs duty was currently treated in the public finances data and the fiscally neutral approach that we had used in our forecast pending further information on post-Brexit policy settings.
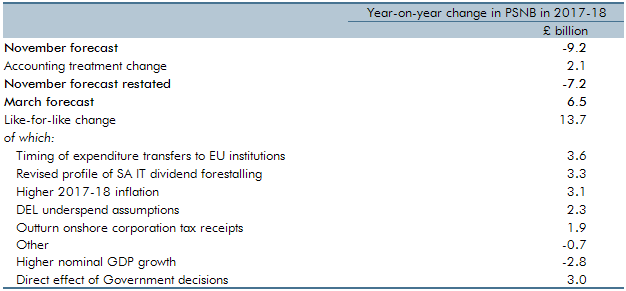
For the first time in any Economic and fiscal outlook, our March 2017 forecast showed post-measures borrowing rising year-on-year in one year of the forecast – 2017-18. This box explored the factors that explained why borrowing was expected to rise in that year, when our November 2016 forecast had assumed it would continue to fall.
In each Economic and fiscal outlook we publish a box that summarises the effects of the Government’s new policy measures on our economy forecast. These include the overall effect of the package of measures and any specific effects of individual measures that we deem to be sufficiently material to have wider indirect effects on the economy. In our November 2016 Economic and Fiscal Outlook, economy forecast adjustments included the effects of looser fiscal policy on GDP and the effects of tax policy changes on inflation.
Our PAYE, SA, NICs and corporation tax (CT) forecasts are affected by our assumption that incorporations will continue their rising trend. This box covered historical estimates, the modelling of the receipts effects from incorporations and the implications for the forecast.
The ONS announced that it would implement a new accruals methodology for corporation tax (CT) early in 2017. This box outlined in detail the changes to the ONS methodology.
Our fuel duty receipts forecast combines our underlying forecast assumptions about the amount of fuel that will be purchased and the Government’s stated policies on the fuel duty rates that will be levied on those purchases. This box outlined the changes in fuel duty and policy assumptions since 2010.
Stamp duty land tax (SDLT) is one of the more volatile sources of receipts. In our 2016 Forecast evaluation report, this box identified a number of reasons why forecasting SDLT receipts is challenging, including the concentration of receipts in a small proportion of expensive properties and the effects of significant policy changes.
In each Economic and fiscal outlook we publish a box that summarises the effects of the Government’s new policy measures on our economy forecast. These include the overall effect of the package of measures and any specific effects of individual measures that we deem to be sufficiently material to have wider indirect effects on the economy. In our March 2016 Economic and Fiscal Outlook, we made a number of economy forecast adjustments to GDP, business investment, wage growth, inflation and the housing market.
Business rates are a major source of locally-raised finance used to fund locally-administered spending. The Government announced in Autumn Statement 2015 that it would let English local authorities retain 100 per cent of business rates by the end of the Parliament. This box outlined the change in local government financing arrangements and the responsibilities that might be devolved, as well as how these changes would affect our forecast.
In each Economic and fiscal outlook we publish a box that summarises the effects of the Government’s new policy measures on our economy forecast. These include the overall effect of the package of measures and any specific effects of individual measures that we deem to be sufficiently material to have wider indirect effects on the economy. In the 2015 Autumn Statement and Spending Review, we made a number of adjustments to real and nominal GDP, the labour market, inflation, and the housing market.
We always try to forecast the public finances consistent with how the ONS will measure them once it has implemented its classification decisions, so that our forecasts will be consistent with that eventual treatment. This box outlined the items included in our November 2015 forecast which the ONS had announced, but had yet to implement.
Modelling changes were made to the deductions element of the VAT model and to introduce a new model for NICs. The box outlined the modelling changes and the likely effect on receipts.
We use a large number of fiscal forecasting models to generate our bottom-up forecasts of the public finances. This box outlined why models are essential forecasting tools, the various types of model used and how their performance is assessed.
In each Economic and fiscal outlook we publish a box that summarises the effects of the Government’s new policy measures on our economy forecast. These include the overall effect of the package of measures and any specific effects of individual measures that we deem to be sufficiently material to have wider indirect effects on the economy. In the July 2015 Economic and fiscal outlook, we made a number of adjustments to real and nominal GDP, the labour market, inflation, business and residential investment, and the housing market.
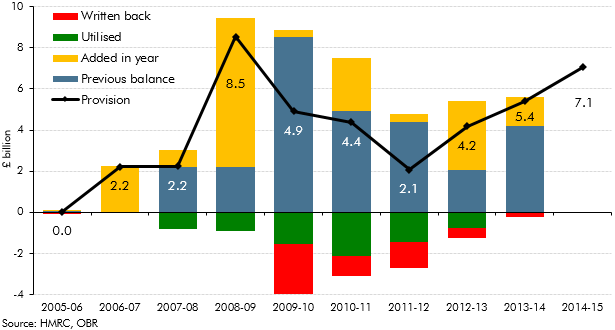
HMRC includes provisions in its accounts to cover risks from litigation cases where the tax at risk is greater than £100 million. This box highlighted the relationship between HMRC provisions, the amounts actually utilised and how this related to the July 2015 OBR forecast for likely tax litigation costs.
An important economic development in the run-up to our March 2015 Economic and fiscal outlook was the sharp drop in oil prices, which had fallen to less than half the $115-a-barrel peak that they had reached in June 2014. In this box we considered the channels along which those lower oil prices were likely to affect the UK economy. (See also Box 2.1 from that EFO for a discussion of the demand- and supply-side factors contributing to lower oil prices.)
In each Economic and fiscal outlook we publish a box that summarises the effects of the Government’s new policy measures on our economy forecast. These include the overall effect of the package of measures and any specific effects of individual measures that we deem to be sufficiently material to have wider indirect effects on the economy. In our March 2015 Economic and Fiscal Outlook, we made adjustments to nominal GDP, inflation and North sea production.
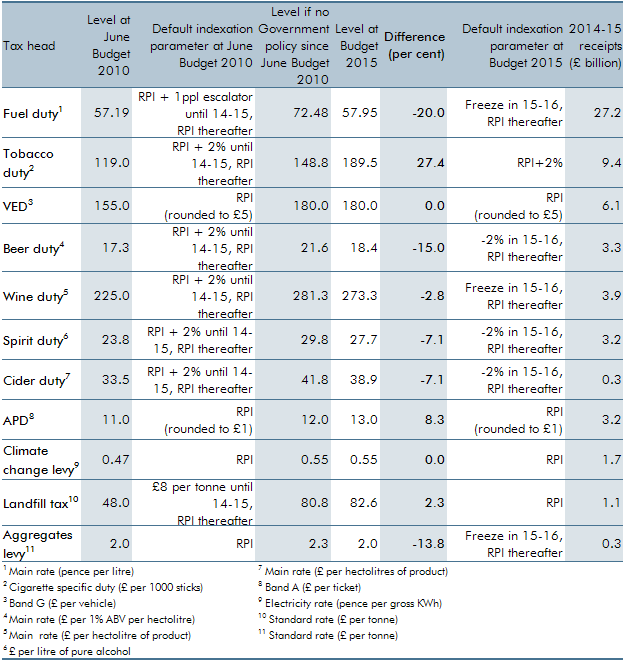
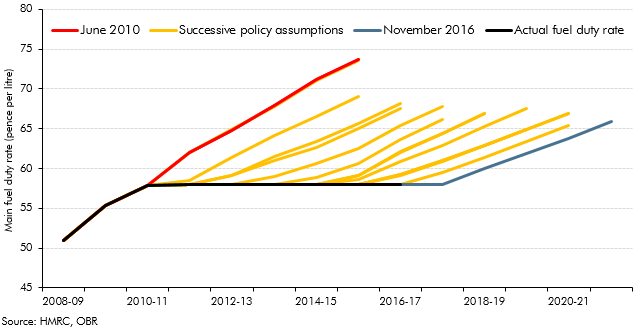
Our forecasts for excise and environmental duties assume that rates are indexed in line with default parameters. These parameters are set by the Government and are detailed at each Budget in the Treasury’s Policy costings document. The assumptions represent a source of economy and
policy-related uncertainty in our forecast. In this box, we looked back at how a selection of duty rates moved over the Parliament relative to the default uprating assumptions assumed in the OBR’s first forecast in June 2010.
policy-related uncertainty in our forecast. In this box, we looked back at how a selection of duty rates moved over the Parliament relative to the default uprating assumptions assumed in the OBR’s first forecast in June 2010.

In this forecast, there were two policy switches that shifted spending between RDEL and AME, which applied from 2015-16 onwards. This box outlined these changes and examined the subsequent impact these would have on our forecast.
In each Economic and fiscal outlook we publish a box that summarises the effects of the Government’s new policy measures on our economy forecast. These include the overall effect of the package of measures and any specific effects of individual measures that we deem to be sufficiently material to have wider indirect effects on the economy. In our December 2014 Economic and Fiscal Outlook, we made adjustments to property transactions and residential investment in light of reforms to stamp duty land tax
This box evaluated anti-avoidance measures implemented between 2011-12 and 2013-14. The exercise confirmed that while these costings were subject to significant uncertainty, there was no evidence of systematic bias.
Public finances data are subject to regular classification and methodological changes. This box outlined the classification changes associated with the implementation of the new 2010 European System of Accounts (ESA10). Annex B of our March 2014 EFO explained these changes in more detail.
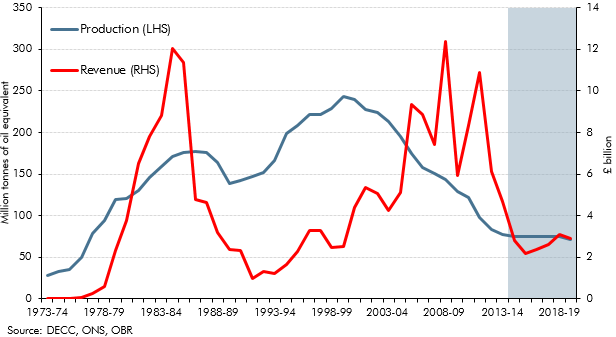
North sea oil and gas revenues have historically been volatile. This box showed how movements in revenues between the peaks and troughs since the early 1970s can be explained by drivers of taxable profits - the volume and price of production (which together provide a proxy for sales), the implied profit margin on those sales and the effective tax rate paid on those profits.
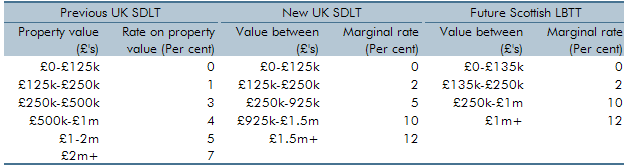
The Government announced substantial reforms to the residential stamp duty land tax (SDLT) system at Autumn Statement 2014. This box explored how the tax system changed and how these reforms were costed.
‘Computable general equilibrium’ (CGE) modelling is a tool for assessing the potential medium and long-term economic impact of policy changes. This box explored recent Government CGE studies of cuts to corporation tax and fuel duties alongside the potential impact of other recent tax rises and spending cuts.
This box explored the implications of the new 2010 European System of Accounts (ESA10) on our public finances forecast, ahead of its incorporation in our December 2014 EFO. Annex B of our March 2014 EFO explained these changes in more detail.
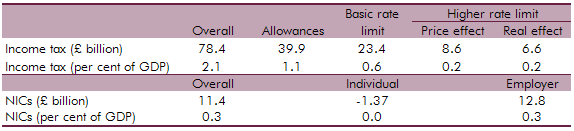
An additional rate of income tax of 50p for incomes over £150,000 was introduced in April 2010. Budget 2012 announced that this rate would be reduced to 45p from April 2013. This box explored how the incomes of those affected by this change evolved over this period - in particular the significance of forestalling and income shifting.
We updated our July 2013 analysis of fiscal drag on income tax and NICs to reflect new data, our latest assumptions and the effect of measures announced over the past year. This box outlined how fiscal drag effects income tax and NICs receipts and the long-term assumptions used.
In each Economic and fiscal outlook we publish a box that summarises the effects of the Government’s new policy measures on our economy forecast. These include the overall effect of the package of measures and any specific effects of individual measures that we deem to be sufficiently material to have wider indirect effects on the economy. In our March 2014 Economic and Fiscal Outlook, we made adjustments to inflation and business investment.
Receipts from capital gains tax (CGT), inheritance tax (IHT) and stamp duty land tax (SDLT) were expected to rise sharply over our March 2014 forecast. This box set out the drivers behind that rise, in particular the impact of rising effective tax rates.
In each Economic and fiscal outlook we publish a box that summarises the effects of the Government’s new policy measures on our economy forecast. These include the overall effect of the package of measures and any specific effects of individual measures that we deem to be sufficiently material to have wider indirect effects on the economy. In our December 2013 Economic and Fiscal Outlook, we adjusted our inflation forecast to reflect changes in fuel duty.
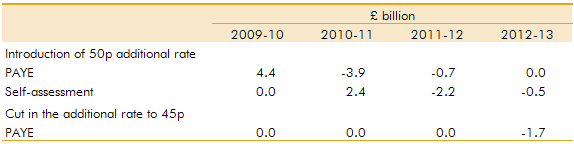
In recent years, the UK has entered into tax agreements with a number of offshore centres. This box evaluated the Autumn 2012 costing for the UK-Swiss tax agreement. More information can be found in Working paper No.8: Anti-avoidance costings: an evaluation
An additional rate of income tax of 50p for incomes over £150,000 was introduced in April 2010. Budget 2012 announced that this rate would be reduced to 45p from April 2013. This box explored how incomes were shifted (forestalled) in response to these policy changes
We updated our 2012 analysis of fiscal drag on income tax and NICs to reflect new data, our latest assumptions and the effect of measures announced over the past year. This box outlined how fiscal drag effects income tax and NICs receipts and the long-term assumptions used.
In each Economic and fiscal outlook we publish a box that summarises the effects of the Government’s new policy measures on our economy forecast. These include the overall effect of the package of measures and any specific effects of individual measures that we deem to be sufficiently material to have wider indirect effects on the economy. In our March 2013 Economic and Fiscal Outlook, we made adjustments to our forecasts of real GDP, business investment and inflation
The Whole of Government Accounts (WGA) contains information on future fiscal liabilities that are relevant for our forecast. This box explained how we ensured that those future liabilities reported in the WGA were fully reflected in our forecasts, where those liabilities were expected to affect the public finances.
In each Economic and fiscal outlook we publish a box that summarises the effects of the Government’s new policy measures on our economy forecast. These include the overall effect of the package of measures and any specific effects of individual measures that we deem to be sufficiently material to have wider indirect effects on the economy. In our December 2012 Economic and Fiscal Outlook, we made adjustments to our forecasts of real GDP, inflation and property transactions
We updated our 2011 analysis of fiscal drag on income tax and NICs to reflect new data, our latest assumptions and the effect of measures announced over the past year. This box outlined how fiscal drag effects income tax and NICs receipts and the long-term assumptions used.
In each Economic and fiscal outlook we publish a box that summarises the effects of the Government’s new policy measures on our economy forecast. These include the overall effect of the package of measures and any specific effects of individual measures that we deem to be sufficiently material to have wider indirect effects on the economy. In our March 2012 Economic and Fiscal Outlook, we made adjustments to our forecasts of real GDP, business investment and inflation.
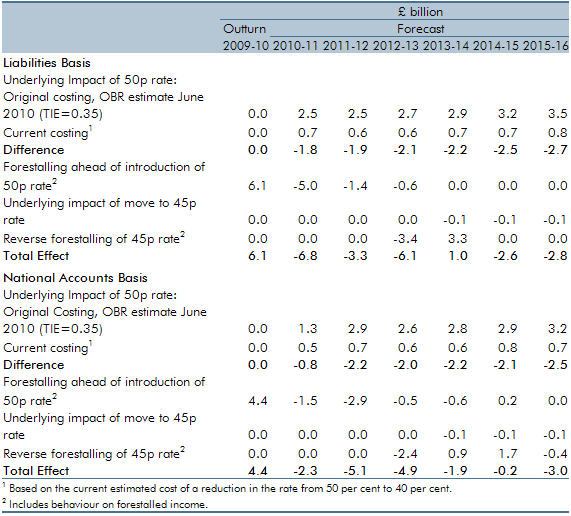
An additional rate of income tax of 50 per cent for incomes over £150,000 was introduced in April 2010. Budget 2012 announced that this rate would be reduced to 45 per cent from April 2013. This box set out how the Budget 2012 measure was costed, in particular the assumptions we made around behavioural responses and income shifting. Box 3.2 of our 2014 Forecast evaluation report reviewed this costing in detail.
In each Economic and fiscal outlook we publish a box that summarises the effects of the Government’s new policy measures on our economy forecast. These include the overall effect of the package of measures and any specific effects of individual measures that we deem to be sufficiently material to have wider indirect effects on the economy. In our November 2011 Economic and Fiscal Outlook, we made adjustments to our forecasts of inflation and property transactions.
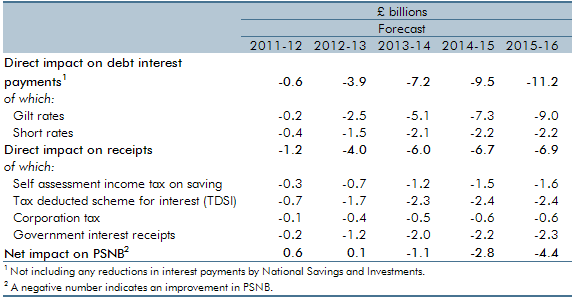
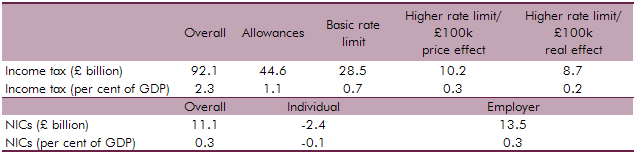
This box set out the impact of changes in interest rates on our public finances forecast, including debt interest spending and income tax receipts. Updated versions of our ready reckoners can be found on our website.
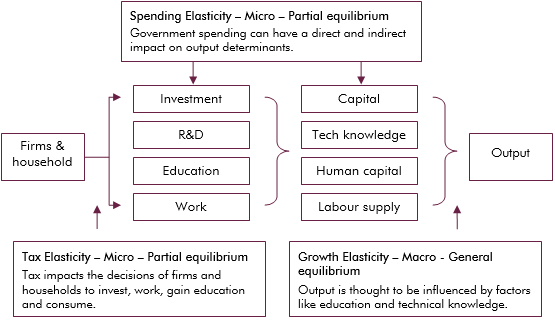
Economic theory suggests that tax and spending can impact output directly, such as expenditure on infrastructure, or indirectly, such as influencing the decisions of households and firms. This box explored the empirical evidence on whether tax and spending has a level (temporary) effect on output growth, or a growth (permanent) effect.
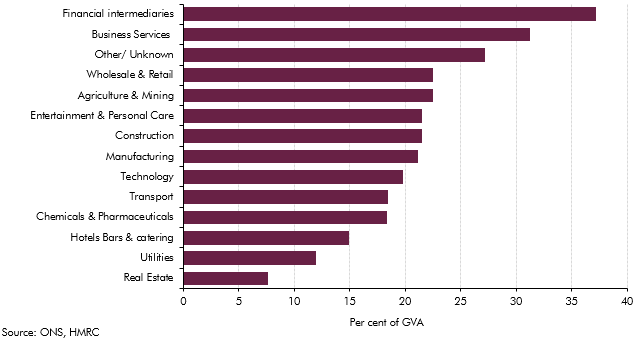
The sectoral landscape of the economy had changed markedly with the financial sector becoming increasing important. This box examined implications for tax revenue arising from the financial sector.
In each Economic and fiscal outlook we publish a box that summarises the effects of the Government’s new policy measures on our economy forecast. These include the overall effect of the package of measures and any specific effects of individual measures that we deem to be sufficiently material to have wider indirect effects on the economy. In our March 2011 Economic and Fiscal Outlook, we made adjustments to our forecast of inflation.
The world price of oil increased sharply in 2010, reflecting rising world demand and unrest in the Middle East and North Africa. This box explored the impact this had on our public finances forecast at the time, from higher North Sea oil and gas revenues to the second round effects stemming from higher inflation.
This box set out the various impacts that higher inflation has on the public finances. These include direct effects (e.g. on income tax and debt interest spending), the impact on nominal tax bases (such as household consumption) and the impact on departmental spending.
The OBR provides independent scrutiny of policy costings and determines any resultant impact on the economic forecast. An estimate of the impact of a policy measure is included in the public finances forecast only when a firm policy has been announced and there is sufficient detail to quantify the effect of the policy. This box summarised the policies that were included in our November 2010 forecast.
Our forecasts for tax receipts do not generally include any explicit assumptions about changes in the level of tax compliance. This box highlighted why our VAT forecast is the one exception.