
Box sets » GDP by income
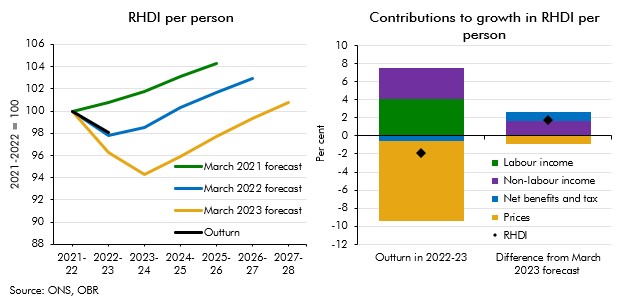
Real household disposable income turned out stronger than our recent forecasts expected for 2022-23. This box explained that differences are largely explained by net benefits and taxes as well as non-labour incomes providing stronger support to living standards than forecast.
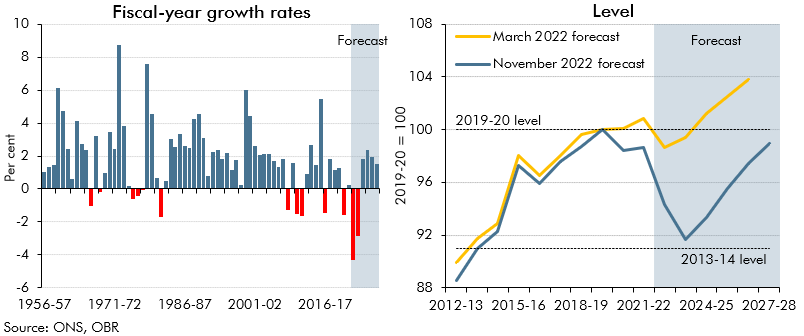
In 2022-23 and 2023-24, living standards are set for the largest fall on record. This box set out our forecast for real household income, the impact of government policy in buffering the income shock, and its implications for our consumption forecast.
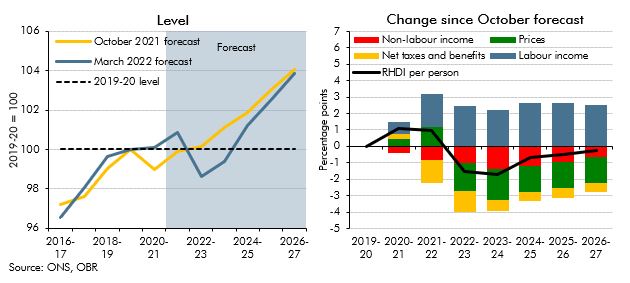
The cost of living has risen rapidly for households, with inflation reaching a 30-year high in January 2022 and the Russian invasion of Ukraine expected to increase inflation further. In this box we outlined our forecast for real household disposable incomes per person and explained that despite the Government's policy measures, 2022-23 is set to see the largest fall in living standards since ONS records began in 1956-57.
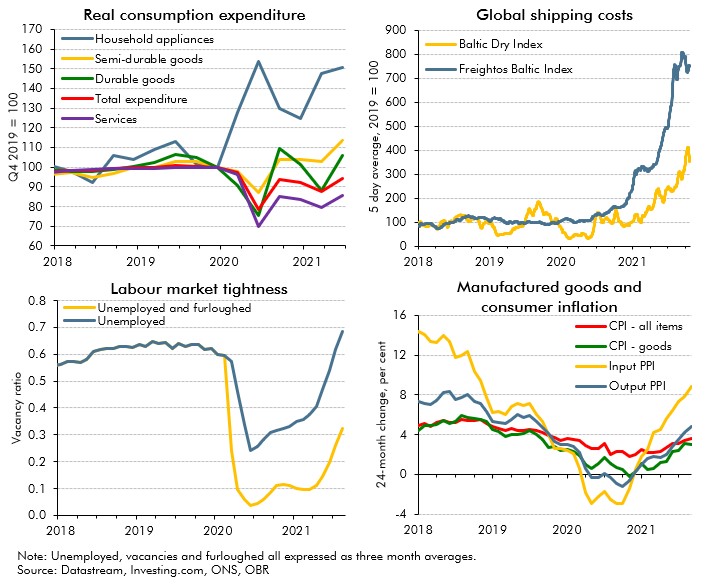
In October 2021 commentators became increasingly concerned that the inability of supply to keep up with demand in specific areas of the economy would hold back the recovery. In this box we examined these 'supply bottlenecks' in energy, product and labour markets, discussing their consequences for wage and price inflation.
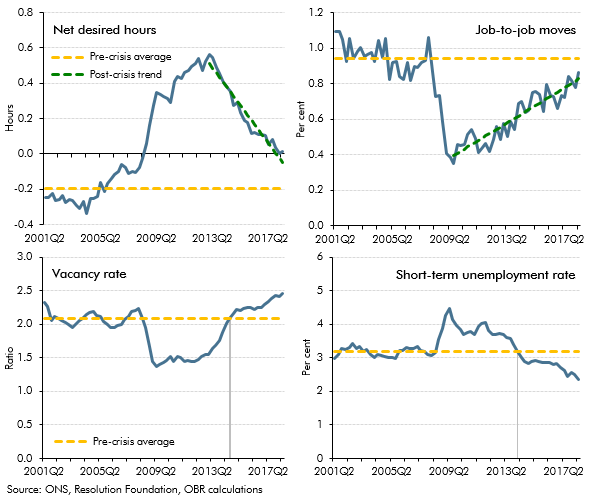
In the 2018 Economic and fiscal outlook we discussed how the unemployment rate – which had fallen to its lowest level since 1975 – may not necessarily give a complete picture of the extent of labour market slack. This box therefore looked at some other measures, some of which suggested there could be more spare capacity than was captured by the unemployment rate at that time and some of which could be used to argue that there was less.
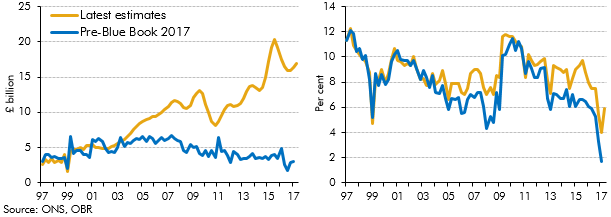
In recent years there has been a significant increase in the number of people setting themselves up as single-director companies (‘incorporations’), implying an increase in the share of household income received as dividends. ONS estimates of households dividend income were revised significantly as part of Blue Book 2017, and better capture this rise in incorporations. This box discussed the implications of these revisions, which implied a much higher level of household disposable income and household saving than previous estimates.
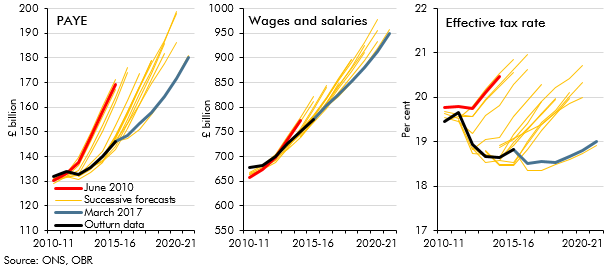
PAYE income tax is the Government’s single most important source of revenue, and one where our forecasts since 2010 have tended to be revised down over time. In this box from our March 2017 Economic and fiscal outlook, we explored the role that changes in the distribution of earnings might have played in explaining the shortfalls in income tax receipts.
In each Economic and fiscal outlook we publish a box that summarises the effects of the Government’s new policy measures on our economy forecast. These include the overall effect of the package of measures and any specific effects of individual measures that we deem to be sufficiently material to have wider indirect effects on the economy. In our March 2016 Economic and Fiscal Outlook, we made a number of economy forecast adjustments to GDP, business investment, wage growth, inflation and the housing market.
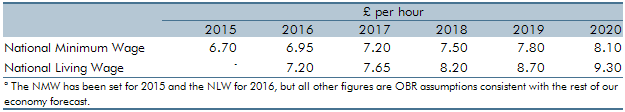
In July 2015, the Government announced the ‘National Living Wage’ (NLW) for workers aged 25 and above. This box from our November 2015 Economic and fiscal outlook outlined how revisions to the wider economy forecast affected our NLW forecast and also explored some of the potential labour market and employer responses to the NLW.
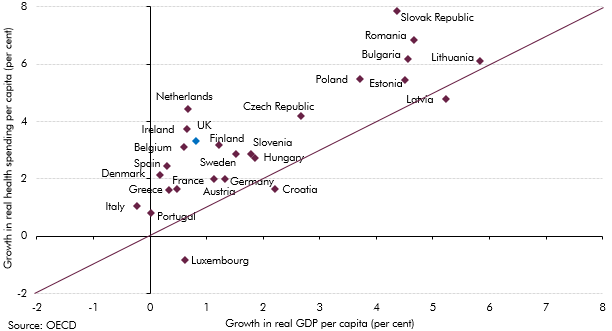
Health spending rose faster than GDP in almost all European countries over the past decade. This box investigated most notable long-term drivers of real spending on health care: demographic effects, income effects and other cost pressures.
In each Economic and fiscal outlook we publish a box that summarises the effects of the Government’s new policy measures on our economy forecast. These include the overall effect of the package of measures and any specific effects of individual measures that we deem to be sufficiently material to have wider indirect effects on the economy. In our March 2015 Economic and Fiscal Outlook, we made adjustments to nominal GDP, inflation and North sea production.
At Budget 2014, the Government announced a number of tax measures that increase the flexibility with which individuals can access their defined contribution (DC) pension assets. This box considered the effect of two possible sensitivities. First, the possibility that there would be more money flowing into the housing market, and second, that people could spend their pension pots relatively early in retirement, leading to greater reliance on income-related benefits.
In each Economic and fiscal outlook we publish a box that summarises the effects of the Government’s new policy measures on our economy forecast. These include the overall effect of the package of measures and any specific effects of individual measures that we deem to be sufficiently material to have wider indirect effects on the economy. In our March 2014 Economic and Fiscal Outlook, we made adjustments to inflation and business investment.
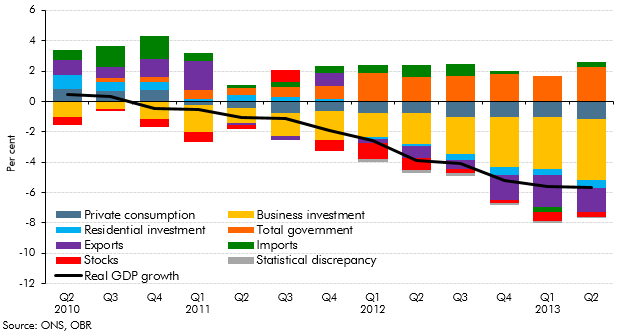
Each autumn, we publish our Forecast evaluation report (FER), a detailed examination of the performance of past economic and fiscal forecasts relative to the latest outturn data. This box discussed cumulative errors in our June 2010 real and nominal GDP forecasts in light of the significant revisions made by the ONS to real GDP growth between mid-2010 and mid-2012, and the implications this has had for the performance of our June 2010 public sector borrowing forecast
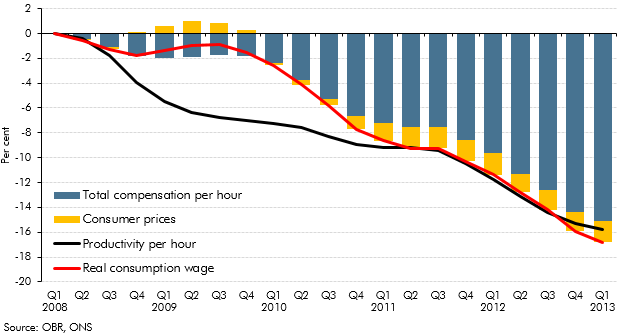
In the years following the late-2000s recession, productivity growth remained subdued, which would be expected to lead to lower wages. This box showed that while the real product wage grew more strongly than productivity growth since 2008, real consumption wage growth was weaker.
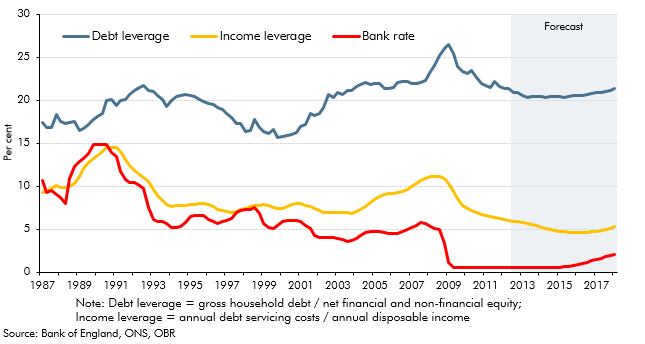
The household saving ratio continued to rise in 2012. This box explored the possible reasons for this, considering evidence from the latest available NMG household survey. The box also discussed the implications for household balance sheets, noting that in aggregate households appeared to have used higher saving to finance accumulation of more financial assets, rather than paying down debt.
Our general government employment (GGE) forecast is based on projections of the growth of the total government paybill and paybill per head, which is in turn based on the Government's latest spending plans. In this box we compared our GGE forecast against the outturn data since the start of the 2010 Spending Review period. This allowed some assessment of how public sector employers were progressing with their intended workforce reduction and how much adjustment would still be required.
In each Economic and fiscal outlook we publish a box that summarises the effects of the Government’s new policy measures on our economy forecast. These include the overall effect of the package of measures and any specific effects of individual measures that we deem to be sufficiently material to have wider indirect effects on the economy. In our March 2012 Economic and Fiscal Outlook, we made adjustments to our forecasts of real GDP, business investment and inflation.
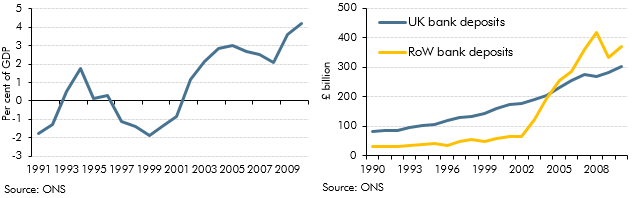
The corporate sector had run a significant surplus of profits over investment since 2003, and this surplus rose sharply following the crisis. This box explored some of the possible reasons for this, including the possibility that businesses may have used this to build up a buffer against future shocks. The box also discussed the uncertainties around the existing data, which may have overstated corporates' holdings of cash reserves.
Revisions to National Accounts data are a normal part of the Blue Book process, which reconciles the different measures of GDP and incorporates information from annual data sources. This box set out the key differences between the vintage of data used for the purposes of the October 2011 Forecast Evaluation Report and the data consistent with the 2011 Blue Book.
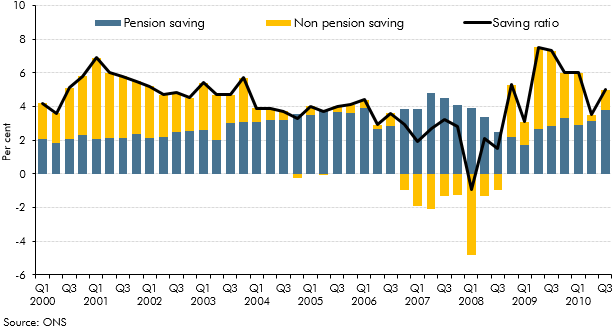
The household saving ratio captures both the disposable income that households do not spend on consumption, and changes in the equity households have in pension funds. This box described how the household saving ratio is calculated, and considered the relative contribution of pension and non-pension saving to the saving ratio over the preceding decade. The box also discussed possible factors behind recent movements in pension saving.