The household saving ratio continued to rise in 2012. This box explored the possible reasons for this, considering evidence from the latest available NMG household survey. The box also discussed the implications for household balance sheets, noting that in aggregate households appeared to have used higher saving to finance accumulation of more financial assets, rather than paying down debt.
This box is based on ONS income leverage and Bank of England debt leverage data from October 2012 and November 2012 respectively.
The household saving ratio – the average propensity of UK households to save out of current income – continued to rise in 2012. A significant contribution comes from an adjustment for employers’ net contributions to funded pension schemes,a rather than from active household savings decisions. This adjustment is driven by corporate balance sheet management and profitability, and has been quite variable in recent years. However, with or without this adjustment, by the third quarter of 2012 the saving ratio had risen to a level comparable to 2009 (the highest since the 1990s), when the economy was contracting severely.
Households may be choosing to save more for a number of reasons, including: tighter credit conditions, resulting in bigger down payments to buy a house; and fear of future negative income shocks, perhaps from fiscal consolidation or unemployment or a new tightening of credit conditions. The latest NMG Consulting surveyb shows a growing share of those respondents planning to increase their saving in 2013 doing so for a deposit, or to reduce their existing debts. Different sections of the population may also be affected in different ways: the young particularly by tighter credit conditions and greater deposit requirements for first-time home buyers.
Looking forward, improvements in credit conditions could put downward pressure on the saving ratio. The Funding for Lending Scheme (FLS) could encourage lenders to compete for new borrowers by lowering deposit requirements. A further rise in inflation and fall in real incomes could also reduce the ratio as households save less in order to continue consuming essentials. But concerns over future income levels are only likely to recede slowly, as economic growth and public finances stabilise, and we do not expect a rapid return to the record-low saving ratios seen prior to the crisis.
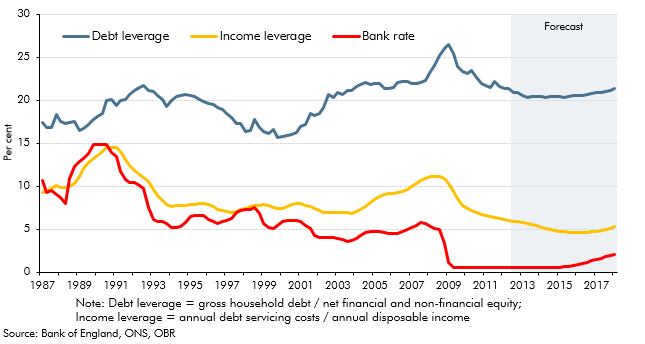
The higher saving ratio, combined with the resilience of nominal household disposable income levels (and further growth in 2012, see paragraph 3.53), has increased the flow of money into household balance sheets. Faced with the choice of purchasing new assets or paying off existing debts, households in aggregate appear to be choosing more financial assets, particularly deposits, perhaps in part due to higher collateral requirements for mortgages. The absolute level of household (loan) debt has even risen slightly, beyond its pre-recession peak. However, given resilient house prices, record low Bank rate and continued accumulation of financial assets, the effective burden of household debt has fallen steadily since the peak of the crisis (Chart A).
Given other key features of our forecast (a very gradual pick up in Bank rate, continued improvement in credit conditions, weak growth in disposable income and house prices), we expect the burden of servicing household debt, on average, to remain well below the crisis and pre-crisis period – even with a moderate pick up in new borrowing. We expect slower accumulation of debt than in our March 2012 forecast, given consistently weak actual borrowing data, by pre-crisis standards. But we do not expect a rapid or unstable path of debt reduction, which could induce a more significant response in the saving ratio, consumption and GDP growth.
Chart A: Household leverage indicators