
Our forecasts of income and expenditure allow us to produce a forecast of sector net lending – the balance of saving and capital spending for each sector. This provides a useful diagnostic on the coherence of the economy forecast. We also construct a forecast of the household balance sheet – the stock of households’ financial assets and liabilities – that is consistent with our forecast of households’ net lending.
Net lending and balance sheets
This Forecast in-depth page has been updated with information available at the time of the March 2026 Economic and fiscal outlook.
Household saving ratio
The household saving ratio is defined in the National Accounts as:

Our forecasts for nominal household consumption and household disposable income are described in the relevant sections of this guide.
The net pension equity adjustment represents the amount added to, or subtracted from, the net equity held by households in funded pension schemes. It equals contributions to funded pension schemes by employees and employers (both imputed and actual), less pension benefits paid out. We generally assume employers’ pension contributions grow in line with wages and salaries. Our forecast for employee pension contributions is largely determined by the gilt rate and closing pension liabilities, consistent with the National Accounts measure of this variable. Where necessary, we will make adjustments to each kind of contributions for the effect of policies, including auto-enrolment. Payments of pension benefits in our forecast grow in line with the relevant age group’s population, plus inflation.
While the household saving ratio forecast mechanically derives from the forecasts of its individual components, the ratio itself provides a useful diagnostic on the wider household income and spending forecasts. The profile of the saving ratio can therefore inform our judgements about household consumption and household disposable income. For this work, we typically consider a measure of the saving ratio that excludes the pension equity adjustment, as this component may be less visible to households (especially the imputed elements) and therefore less relevant for their consumption decisions.
Once we have a forecast for the saving ratio, household net lending is then household saving (the numerator of the saving ratio) less household gross capital formation. This last part is largely nominal household investment, which we forecast using real residential investment, house prices and the consumption deflator.
During the Covid pandemic in 2020, the household saving ratio rose to a record high, as consumer spending fell sharply due to public health restrictions, while government policy supported incomes. The saving ratio has since fallen back but remains elevated compared to pre-pandemic averages. We expect households to keep their saving high in the near term, both as a precaution against shocks and due to higher interest rates. Our forecast for the saving ratio then returns towards longer-run averages in the medium term.
Sector net lending
In the National Accounts framework underpinning our forecast, the income and expenditure of the different sectors of the economy imply a path for each sector’s net lending or borrowing from others. In principle, these sum to zero – for each pound borrowed, there must be a pound lent. In practice, ONS estimates of sector net lending do not sum precisely to zero, reflecting differences between the income and expenditure measures of GDP (the ‘statistical discrepancy’). We typically assume this difference remains broadly flat over the forecast period.
Once we have determined our forecasts for expenditure and income for each sector, this gives a forecast for net lending. Taking each sector in turn:
- Households’net lending position reflects household saving and household investment.
- The rest of worldsector’s net lending position largely follows from the current account.
- The public sectornet lending position comes directly from our forecast of the public finances.
- The corporate sectornet lending position reflects corporate profits and investment. It is treated as a residual in our forecast to ensure that net lending sums to zero across the whole economy. This is consistent with the ONS treatment of this sector in the National Accounts: corporate profits, for example, are often subject to ‘alignment’ adjustments to bring the income measure of GDP into line with the headline estimate. However, even though the net lending position of the corporate sector is reached as a residual, it is consistent with our forecast for corporate profits and corporate expenditure (such as business investment), as these elements are components of aggregate expenditure and aggregate income.
While our sectoral net lending forecasts are the arithmetic consequence of judgements and assumptions elsewhere in the forecast, they do not necessarily mark the end of the forecast process. The profile of each sector’s net lending provides an important overall diagnostic on the coherence of the economic forecast. This can prompt adjustments to the judgements we make about each sector’s income and expenditure in later rounds of the forecast.
During 2020, there were very large movements in sectors’ net lending positions due to the pandemic and the huge fiscal support provided in response. Net borrowing by the Government increased significantly, offset by higher saving (net lending) among the household and corporate sectors. As the effects of the pandemic receded, sectors’ net lending positions have moved back towards pre-pandemic positions.
Household balance sheet
The flow of funds constraint
Our forecast of the household sector balance sheet includes forecasts of assets and liabilities. The balance sheet forecast is ‘stock-flow consistent’: that is, households’ acquisition of assets and liabilities is consistent with their aggregate flows of income and saving. The change in the stock of assets or liabilities then reflects both households’ net acquisition of the relevant asset or liability and, where relevant, revaluation effects.
The household balance sheet is subject to the flow-of-funds constraint, as set out in the National Accounts:

Our forecast for household net lending is the starting point for forecasting the household balance sheet. The assets forecast is split into four elements: deposits, equity, pensions and insurance, and ‘other’ assets. The liabilities forecast is split into secured (i.e. mortgage) debt and unsecured debt. Our forecast starts by establishing a baseline forecast for each of these elements. To ensure consistency between the stock and flow positions of households’ financial accounts, any ‘residual’ between the net lending implied by the flows of saving and the net lending implied by our baseline forecast of the ‘stocks’ is apportioned across the components of the household balance sheet. These adjustments ensure that the household balance sheet forecast is consistent with the net lending path implied by our forecasts of income and expenditure. The following sections set out how we produce our baseline forecast for each element of the household balance sheet.
Household liabilities
- Our forecast for secured (mortgage) debtis composed of a path for borrowing for house purchases, less net repayments and write-offs. We project borrowing for house purchases using our forecasts for house prices, property transactions and an assumption about the loan-to-overall-value ratio. (This is the whole-economy equivalent of the familiar loan-to-value ratio in individual house purchases.) We project net repayments and write-offs using historical trends. Further details of this methodology can be found in Box 3.3 of our November 2016 Economic and fiscal outlook.
- The accumulation of unsecured debt in our forecast follows a relationship with several other variables including consumption, unemployment and property transactions. The forecast also includes an assumption that write-offs are a constant proportion of the stock.
Household assets
- Our forecast for householddeposits is informed by factors including the outlook for household consumption and interest rates.
- Changes in the value of households’ stock ofequity assets reflect both households’ acquisition of equities and revaluations as equity prices fluctuate. We project the net acquisition of equity assets in line with households’ net lending position. Revaluation effects are based on our forecasts for domestic and world equity prices.
- Our forecast for the stock of pension and insurance assetslikewise follows both the accumulation of those assets and revaluation effects. The accumulation of pension assets reflects our forecast for the net flow of pension saving, taken from the net pension equity adjustment in the household saving ratio. We forecast the accumulation of insurance assets using past trends and the rate of insurance premium tax. Revaluation effects use our forecast for domestic and world equity prices, along with long-term interest rates, which are used to discount part of the stock.
- Our forecast of ‘other’ assets, such as households’ debt securities, is informed by recent trends, as well as the outlook for nominal GDP growth.
Household net worth
The difference between the value of households’ financial assets and liabilities gives a value for their financial net worth. We also estimate the value of households’ physical assets (i.e. housing) using our forecasts of the housing stock and house prices. Taking financial net worth and the value of physical assets together, the total gives us a forecast for household net worth.
Boxes
Within each of our key publications we include topical ‘boxes’. These self-contained analyses are unique to this publication and tend to cover recent developments in the economy or public finances that complement the main discussion of our analyses.
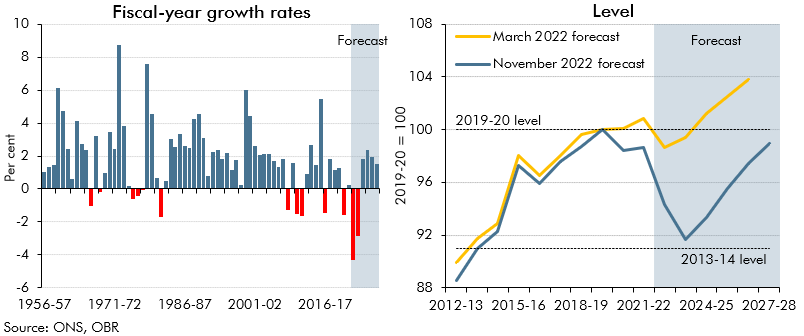
In 2022-23 and 2023-24, living standards are set for the largest fall on record. This box set out our forecast for real household income, the impact of government policy in buffering the income shock, and its implications for our consumption forecast.
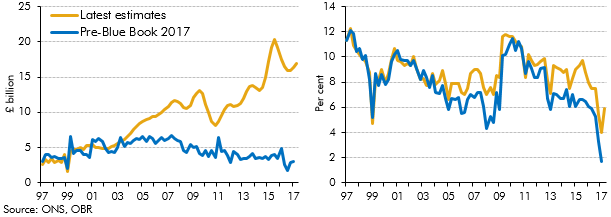
In recent years there has been a significant increase in the number of people setting themselves up as single-director companies (‘incorporations’), implying an increase in the share of household income received as dividends. ONS estimates of households dividend income were revised significantly as part of Blue Book 2017, and better capture this rise in incorporations. This box discussed the implications of these revisions, which implied a much higher level of household disposable income and household saving than previous estimates.
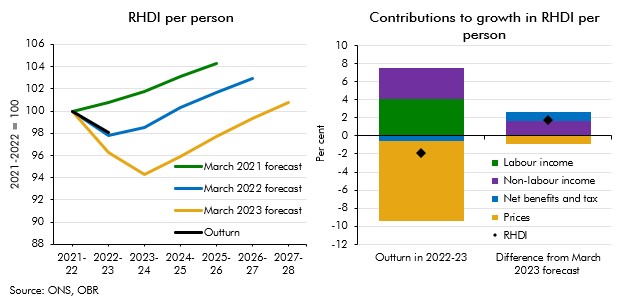
Real household disposable income turned out stronger than our recent forecasts expected for 2022-23. This box explained that differences are largely explained by net benefits and taxes as well as non-labour incomes providing stronger support to living standards than forecast.
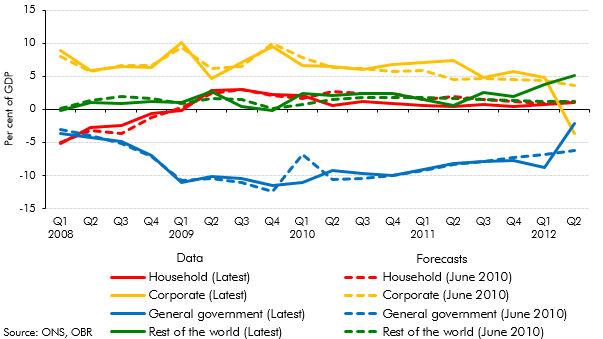
An alternative way to view the sectoral decomposition of the economy is to look at the financial balances of households, firms, government and the rest of the world. This box explored net lending by sector from 2008 to 2012, and how this compared with our June 2010 forecast
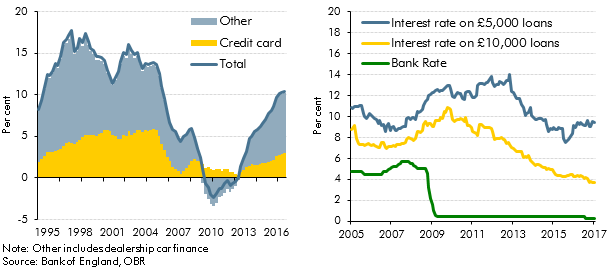
Strong growth in consumer credit in the run-up to our March 2017 Economic and fiscal outlook had prompted concerns among some commentators about its sustainability. In this box we considered the drivers of consumer credit growth, including the role of dealership car finance, and the extent to which it may have supported household consumption growth.

To investigate the effect of an ageing population on asset demand and rates of return in the context of the wider pension system, we have used the UK Overlapping Generations model (UK OLG). This box explained why the UK OLG is uniquely useful for this kind of life cycle analysis, presented an outline of the model's structure, and gave an overview of the data sources we used to calibrate the model.
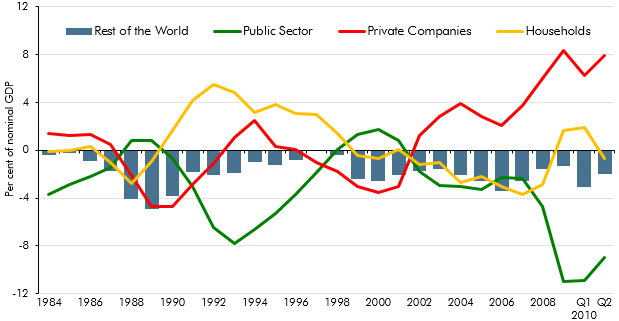
A rebalancing away from private consumption towards investment and net trade was a theme of our November 2010 forecast. This box set out the key features of domestic sector balances over the preceding two decades.
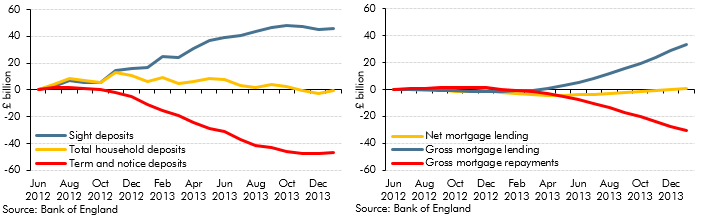
In 2013, households’ balances in ‘time deposit’ accounts (savings with fixed maturity) fell by £36 billion. This box outlined possible reasons for this by exploring the wider household savings behaviour. The cumulative change in annual deposit flows showed rapid increases in 'sight deposits'. This was possibly explained by narrowing spreads between 'time' and 'sight' deposit interest rates or normalisation of household investment behaviour. Changes in annual mortgage flows also suggested that revival of housing market activity could have been responsible for switching between deposit types. The ability of households to shift very large deposit balances over relatively short timeframes was one reason why the impact of savings and pensions measures discussed in Box 3.3 of the same EFO was subject to considerable uncertainty.
In each Economic and fiscal outlook we publish a box that summarises the effects of the Government’s new policy measures on our economy forecast. These include the overall effect of the package of measures and any specific effects of individual measures that we deem to be sufficiently material to have wider indirect effects on the economy. In our December 2012 Economic and Fiscal Outlook, we made adjustments to our forecasts of real GDP, inflation and property transactions
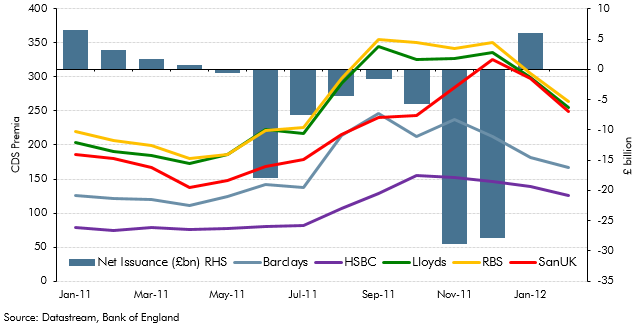
Central banks around the world launched two significant new market operations at the end of 2011. This included a program to provide liquidity support to the global financial system, as well as longer-term refinancing operations by the ECB. This box analysed the impact of these operations on the UK financial sector by looking at net capital issuance and five-year credit default swap (CDS) premia of UK banks. In light of these developments, we made adjustments to our forecast of CDS premia in our March 2012 forecast.
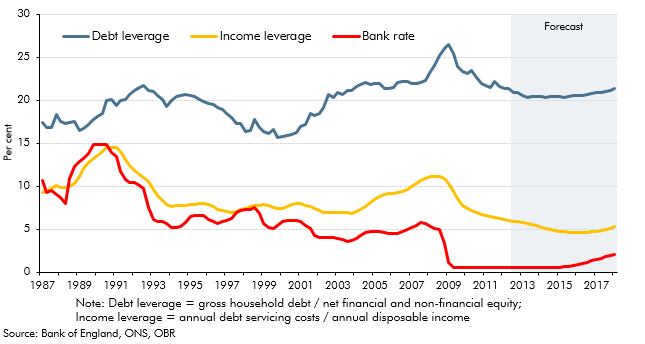
The household saving ratio continued to rise in 2012. This box explored the possible reasons for this, considering evidence from the latest available NMG household survey. The box also discussed the implications for household balance sheets, noting that in aggregate households appeared to have used higher saving to finance accumulation of more financial assets, rather than paying down debt.
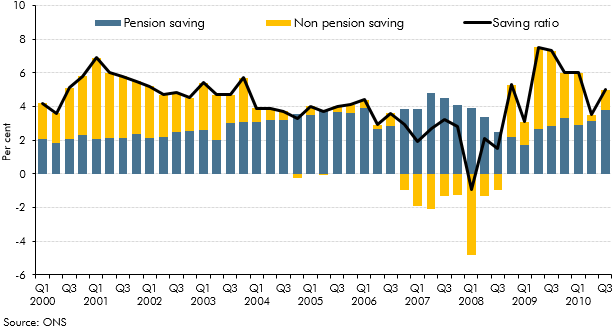
The household saving ratio captures both the disposable income that households do not spend on consumption, and changes in the equity households have in pension funds. This box described how the household saving ratio is calculated, and considered the relative contribution of pension and non-pension saving to the saving ratio over the preceding decade. The box also discussed possible factors behind recent movements in pension saving.
The Funding for Lending Scheme (FLS) was launched by the Bank of England and the Government in July 2012 to encourage banks and building societies to expand their lending by providing funds at lower rates than prevailing market rates. This box discussed the uncertainties associated with the transmission mechanism of this scheme and the possible impact on real GDP.
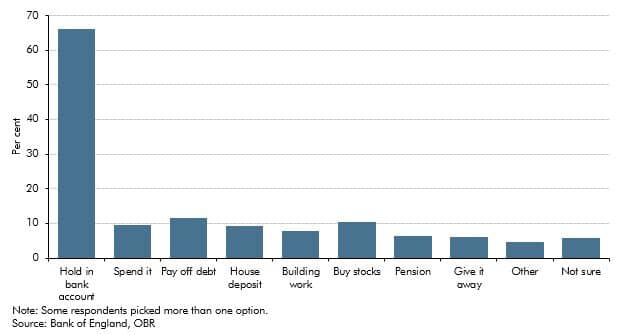
This box explored how the pandemic and associated policy response changed the flow of funds between the different sectors of the UK economy. It then considered the implications of how those flows unwind for the pace and sustainability of the recovery.
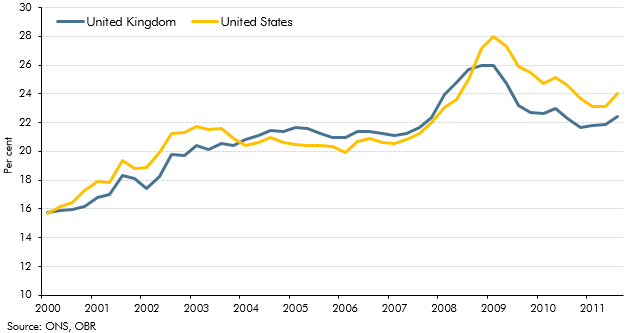
The path of the household debt-to income ratio since the crisis had led outside commentators to conclude that household deleveraging had further to run in the UK than the in the US. This box discussed some of the limitations of debt-to-income as a measure of leverage. An alternative measure is the debt to equity ratio - which takes into account both household assets and liabilities - which indicated that household leverage had fallen more slowly in the US than in the UK since the crisis.
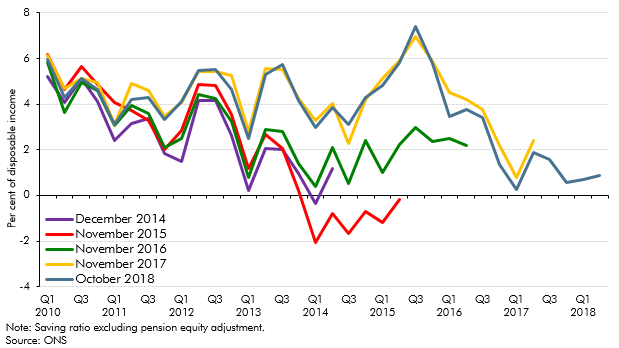
In our October 2018 forecast, the saving ratio – excluding pension contributions - was expected to turn negative, while unsecured debt was expected to rise steadily as a share of household income. In this box, we set out why this did not mean our growth forecast was dependent on a large and unsustainable increase in consumption, nor a significant expansion in consumer credit. Estimates of the saving ratio are subject to frequent revision, while only just over a third of unsecured debt relates to consumer credit, with a small and growing share made up by student loan debt. We also expect total interest payments on debt to remain subdued over the forecast period.
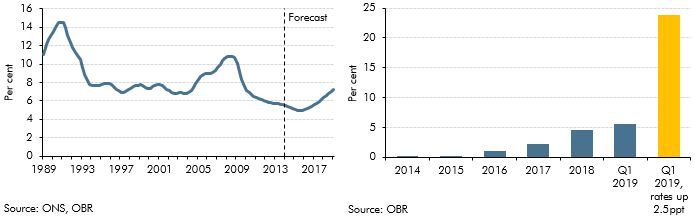
We expected debt servicing costs as a share of disposable income, or ‘income leverage’, to rise as our forecasts for house price inflation outstripped income growth and Bank Rate gradually increased. This box discussed the extent to which mortgage servicing costs were likely to increase over the forecast period and the implications of this for household behaviour, using information from the Bank of England/NMG survey.
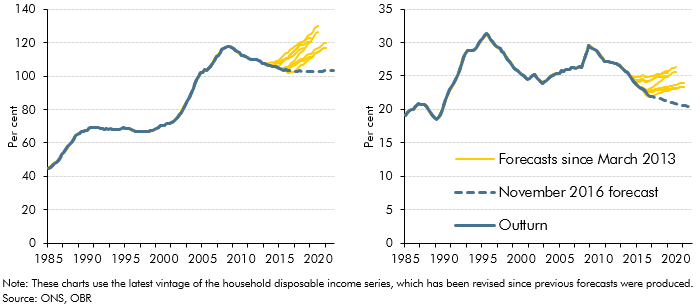
Before November 2016, our forecasts for mortgage debt (secured debt) were based on forecasts for mortgage demand and supply, as the determined by relationships in our house price model. In light of systematic forecast errors, this box outlined changes to our methodology for forecasting mortgage debt, which moved to an approach based on an accumulation identity.
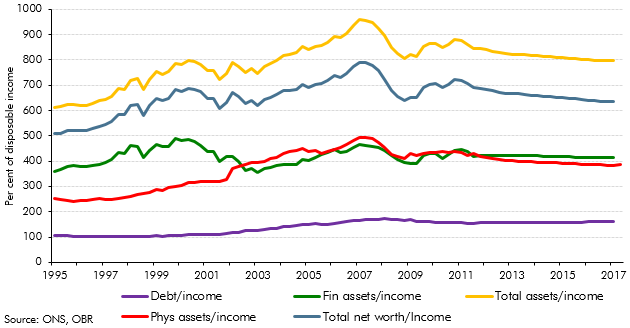
Our November 2011 forecast implied that households would take on around £480 billion of additional debt over the forecast period. This box discussed the implications of this for the household balance sheet, noting that a large part of the increase in household debt reflects borrowing for the purchase of assets. The box also discussed the downward revision in our household debt forecast since our previous EFO, which was largely accounted for by a combination of higher saving and a weaker housing market outlook.