
An alternative way to view the sectoral decomposition of the economy is to look at the financial balances of households, firms, government and the rest of the world. This box explored net lending by sector from 2008 to 2012, and how this compared with our June 2010 forecast
This box is based on ONS lending data from September 2012 .
An alternative way to view the sectoral decomposition of the economy is to look at the financial balances of households, firms, government and the rest of the world, which by definition sum to zero.
Chart B shows that, up until the recent double dip, the financial balances moved broadly in line with our June 2010 forecast. From the beginning of 2010 to the end of 2011 the corporate surplus and the government deficit both narrowed, while household net lending and the current account balance were little changed.
As the economy has shrunk unexpectedly over the most recent quarters, so the government’s negative financial balance has widened (aside from the most recent quarter, see below) rather than narrowing as in the June 2010 forecast. This has had its counterpart in higher external and corporate sector balances than we forecast (reflecting weaker net trade, foreign investment income and domestic corporate investment) rather than additional household deleveraging (i.e. higher saving).
Chart B: Net lending by sector
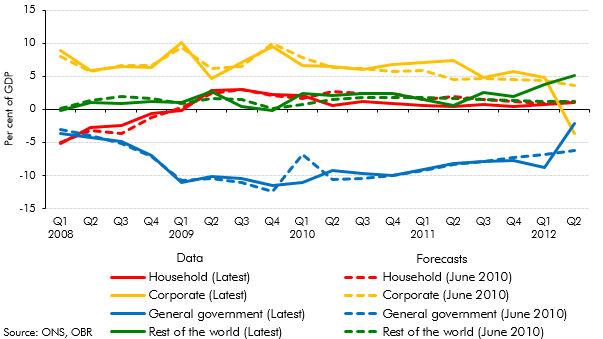
This broad picture has been muddied in the most recent quarter, as the one-off transfer of assets from Royal Mail’s historic pension fund to central government shows up as lower net lending by the corporate sector, and higher net lending (lower borrowing) by general government.