
Before November 2016, our forecasts for mortgage debt (secured debt) were based on forecasts for mortgage demand and supply, as the determined by relationships in our house price model. In light of systematic forecast errors, this box outlined changes to our methodology for forecasting mortgage debt, which moved to an approach based on an accumulation identity.
This box is based on ONS household secured debt data from October 2016 .
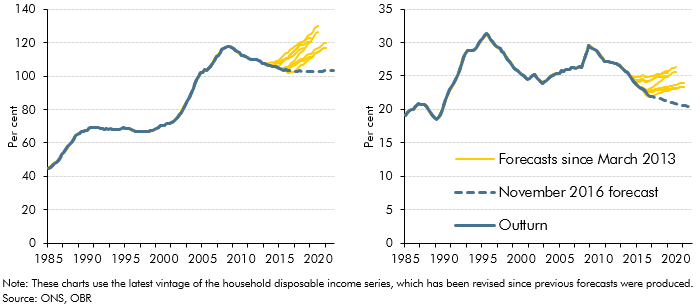
In recent years our forecast for mortgage debt – also described as secured debt – has been based on forecasts for mortgage demand and supply determined by relationships in our house price model.a Mortgage demand was forecast based on its relationship with mortgage rates, house prices, disposable income and loan-to-value ratios. Mortgage supply was then derived by combining demand with an assumption about rationing. This approach systematically over-estimated the pace at which mortgage debt would rise relative to incomes (Chart A).
These previous forecasts were consistent with our house price and property transactions forecasts at the time. They were also based on an assumption that mortgage rationing would ease over the forecast period, thereby leading to a gradual increase in the ratio of secured debt to the value of the housing stock (Chart B).
In light of the systematic forecast errors, and since we have not used our house price model in this forecast, we have used a different approach in this EFO. The accumulation of mortgage debt is built up from its constituent parts. In a given time period, it is determined by:
- borrowing for house purchases, which is equal to the product of average transacted house prices, the number of property transactions and the average loan-to-overall-value (LTOV) ratio. The LTOV is a whole economy equivalent of an individual loan-to-value ratio, including the effect of cash buyers that adds to the value of house purchases but not to mortgage debt. We have assumed that this ratio remains flat over the forecast period, broadly consistent with its recent trend. Our assumption of easing credit conditions in previous forecasts would have been consistent with this ratio rising; less
- net repayments made on mortgages and write-offs. We have assumed a repayment rate of 2.0 per cent, in line with the average rate between 2011 and 2016, and a write-off rate of 0.005 per cent a quarter, based on historical trends.
The judgement that the LTOV ratio remains flat over the forecast period, together with our assumption about repayment rates, means that we now expect the ratio of secured debt to the housing stock value to fall over the forecast period, at a slightly slower pace than recent years (Chart B). This judgement – together with a downward revision to property transactions over the forecast period – means that we have revised down our secured debt forecast significantly. The ratio of secured debt to household disposable income is now expected to remain broadly flat over the forecast period (Chart A).
Using this approach in previous forecasts would not have eliminated the errors – for example, we would still have overestimated the number of property transactions – but it would have reduced them substantially.
Chart A: Secured debt to income ratio and Chart B: Secured debt to gross housing wealth ratio
This box was originally published in Economic and fiscal outlook – November 2016