
Box sets » Net lending and balance sheets » Household balance sheet
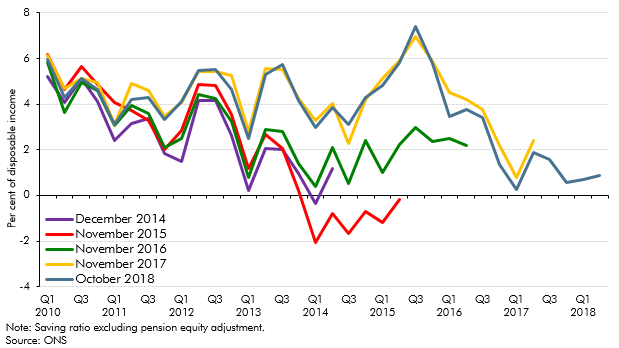
In our October 2018 forecast, the saving ratio – excluding pension contributions - was expected to turn negative, while unsecured debt was expected to rise steadily as a share of household income. In this box, we set out why this did not mean our growth forecast was dependent on a large and unsustainable increase in consumption, nor a significant expansion in consumer credit. Estimates of the saving ratio are subject to frequent revision, while only just over a third of unsecured debt relates to consumer credit, with a small and growing share made up by student loan debt. We also expect total interest payments on debt to remain subdued over the forecast period.
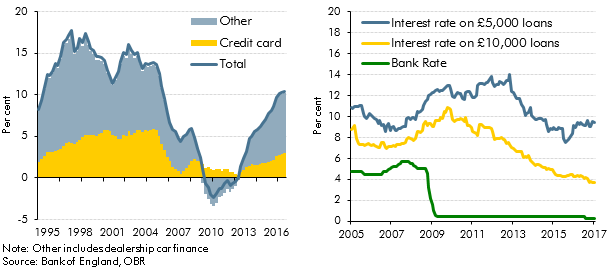
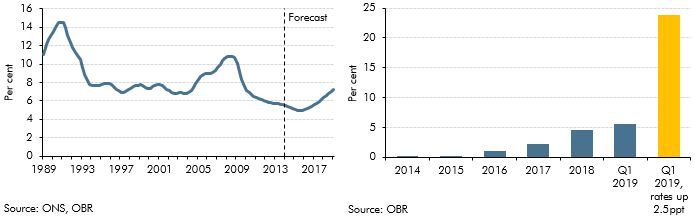
Strong growth in consumer credit in the run-up to our March 2017 Economic and fiscal outlook had prompted concerns among some commentators about its sustainability. In this box we considered the drivers of consumer credit growth, including the role of dealership car finance, and the extent to which it may have supported household consumption growth.
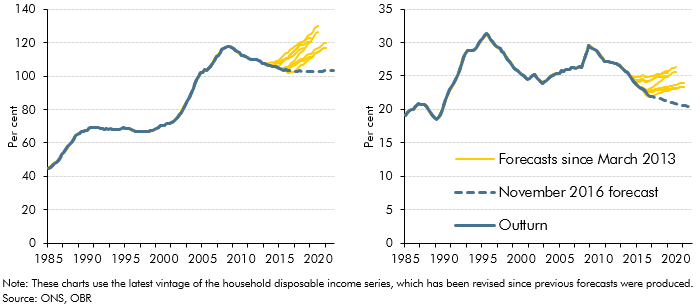
Before November 2016, our forecasts for mortgage debt (secured debt) were based on forecasts for mortgage demand and supply, as the determined by relationships in our house price model. In light of systematic forecast errors, this box outlined changes to our methodology for forecasting mortgage debt, which moved to an approach based on an accumulation identity.
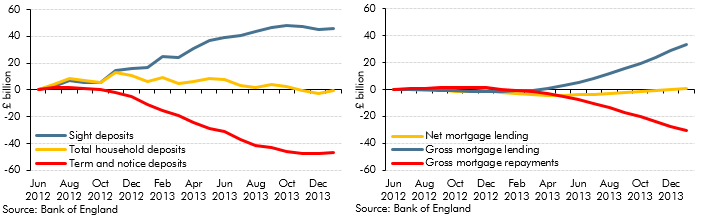
In 2013, households’ balances in ‘time deposit’ accounts (savings with fixed maturity) fell by £36 billion. This box outlined possible reasons for this by exploring the wider household savings behaviour. The cumulative change in annual deposit flows showed rapid increases in 'sight deposits'. This was possibly explained by narrowing spreads between 'time' and 'sight' deposit interest rates or normalisation of household investment behaviour. Changes in annual mortgage flows also suggested that revival of housing market activity could have been responsible for switching between deposit types. The ability of households to shift very large deposit balances over relatively short timeframes was one reason why the impact of savings and pensions measures discussed in Box 3.3 of the same EFO was subject to considerable uncertainty.
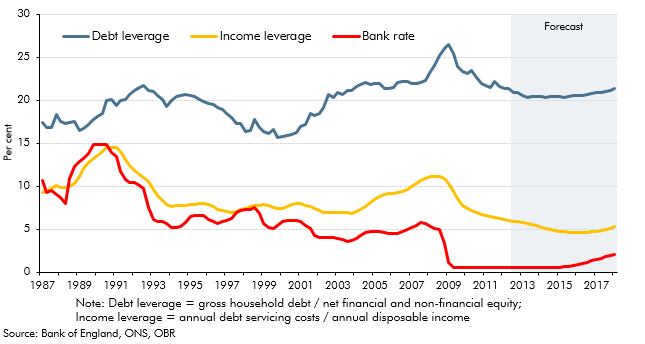
We expected debt servicing costs as a share of disposable income, or ‘income leverage’, to rise as our forecasts for house price inflation outstripped income growth and Bank Rate gradually increased. This box discussed the extent to which mortgage servicing costs were likely to increase over the forecast period and the implications of this for household behaviour, using information from the Bank of England/NMG survey.
The household saving ratio continued to rise in 2012. This box explored the possible reasons for this, considering evidence from the latest available NMG household survey. The box also discussed the implications for household balance sheets, noting that in aggregate households appeared to have used higher saving to finance accumulation of more financial assets, rather than paying down debt.
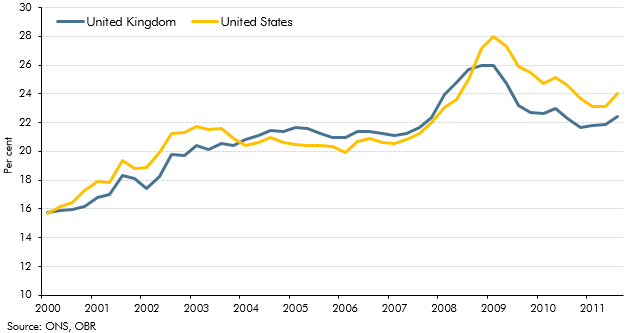
The path of the household debt-to income ratio since the crisis had led outside commentators to conclude that household deleveraging had further to run in the UK than the in the US. This box discussed some of the limitations of debt-to-income as a measure of leverage. An alternative measure is the debt to equity ratio - which takes into account both household assets and liabilities - which indicated that household leverage had fallen more slowly in the US than in the UK since the crisis.
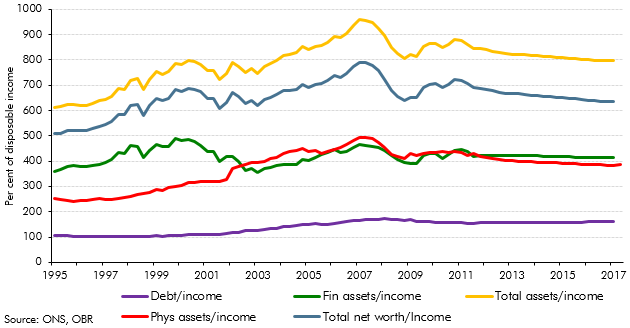
Our November 2011 forecast implied that households would take on around £480 billion of additional debt over the forecast period. This box discussed the implications of this for the household balance sheet, noting that a large part of the increase in household debt reflects borrowing for the purchase of assets. The box also discussed the downward revision in our household debt forecast since our previous EFO, which was largely accounted for by a combination of higher saving and a weaker housing market outlook.