
Our November 2011 forecast implied that households would take on around £480 billion of additional debt over the forecast period. This box discussed the implications of this for the household balance sheet, noting that a large part of the increase in household debt reflects borrowing for the purchase of assets. The box also discussed the downward revision in our household debt forecast since our previous EFO, which was largely accounted for by a combination of higher saving and a weaker housing market outlook.
This box is based on ONS households data from October 2012 .
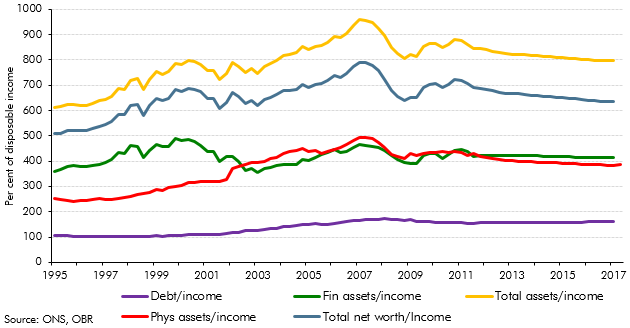
We forecast that households will take on around £480 billion of additional debt over the forecast period leaving household debt at 161 per cent of disposable income in 2016. A large part of this increase reflects borrowing by households to purchase assets, as activity in the housing market picks up. Our latest forecast is for households to purchase financial assets of around £500 billion over the forecast period. The purchase of assets, rather than the financing of consumption, is the most important driver of our household debt forecast. So if household debt were to be lower, this would not necessarily imply lower consumption or GDP growth.
Household net worth represents the difference between liabilities (debt) and assets. We expect household net worth to fall as a share of disposable income over the forecast period because the value of assets is expected to grow more slowly than incomes, while liabilities are expected to rise more quickly as activity in the property market recovers and as households borrow to fund the purchase of housing assets.
Chart A: The household balance sheet
Compared to March, our forecast for the increase in household debt by 2015 is around £215 billion lower. This reflects two main factors:
- Blue Book 2011 data revisions suggest that household saving, for a given level of income, was higher over recent years than previously thought. This means that households are likely to borrow less in the future than we previously thought. Overall, this reduces our household debt forecast by around £150 billion by 2015; and
- we now expect the housing market to take longer to recover. This reduces the amount of household borrowing necessary to fund property transactions by around £35 billion by 2015, with a similar reduction in expected household bank deposit holdings. Therefore, this change has very little impact on our forecast of household net worth overall.
The remainder of the change in the liabilities forecast since March reflects changes to the forecasts for the accumulation of physical and financial assets following revisions to outturn data.