Box sets » Economic data revisions
As we finalised our pre-measures forecast on 26 September, our forecast did not include the Quarterly National Accounts released on 30 September 2024, which contained Blue Book 2024 consistent revisions. This box examined the potential implications that including the latest data may have had on our forecast. We judged that the data revisions would have provided limited new information on current economic conditions, leaving our economic and fiscal forecast broadly unchanged.
As we closed our pre-measures forecast earlier than usual at October Budget 2021, our forecast did not include the Quarterly National Accounts released on 30 September 2021, which contained Blue Book 2021 consistent revisions. This box examined the potential implications that including the latest data may have had on our forecast. We judged that the data revisions and other developments since we closed our forecast would have largely offset one another, leaving our economic forecast broadly unchanged.
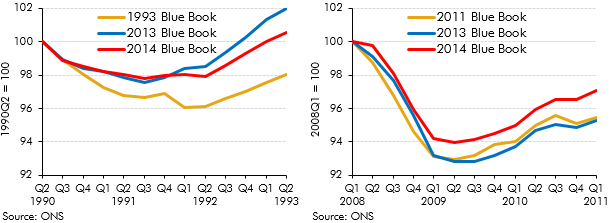
Revisions to National Accounts data are a normal part of the Blue Book process, which reconciles the different measures of GDP and incorporates information from annual data sources. This box explored how the estimated path of the 1990-92 and 2008-09 recessions and subsequent recoveries evolved over time, focusing in particular on revisions to GDP growth in 2011 and 2012.
All elements of GDP data are subject to revision, which creates one source of uncertainty in our forecasts. Business investment data are particularly prone to revision. In this box from our March 2017 Economic and fiscal outlook we looked at past revisions in business investment data and compared the volatility and average revision of UK data with those produced by other countries.
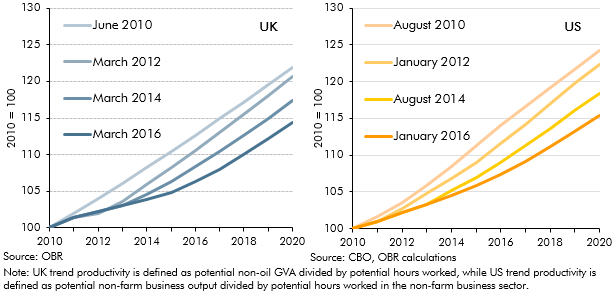
The path of productivity growth is a key driver of GDP growth in our forecast and is also one of the most uncertain judgements. In March 2016, given persistent weakness in outturn data, we revised down our forecast for productivity growth. But this issue was not specific to the UK, with productivity having disappointed in many other major advanced economies. This box compared different vintages of UK and US productivity and potential output forecasts since 2010 to illustrate this point.
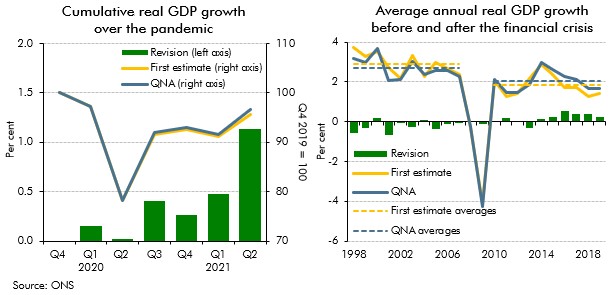
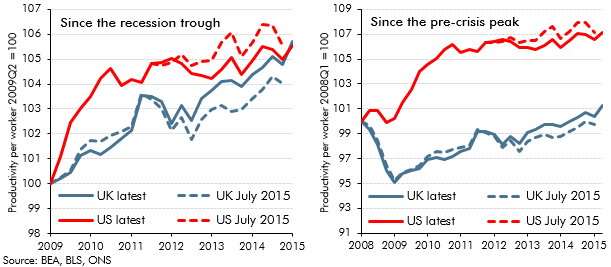
Recent estimates of UK GDP growth represent an early draft of economic history that will be revised, often substantially, over time. OECD found that initial estimates of UK GDP growth have tended to be revised up over time. This box also highlights revisions to estimates of US and UK productivity growth between July and November 2015, and the substantial productivity shortfall relative to the US and relative to the pre-crisis trend in the UK.
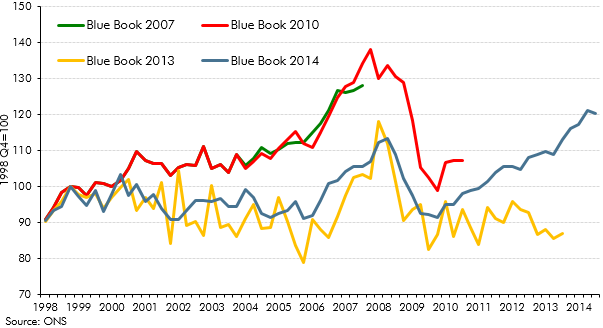
In recent years, historical path of business investment has been subject to significant revisions. This box discussed the revisions made to business investment estimates between 2007 and 2014. In Box 3.6 of our March 2014 Economic and fiscal outlook, we considered this issue from an international perspective.
Between 2012 and 2014, growth in the UK picked up, outpacing all other members of the G7. This box provided wider context for this strength in UK growth, comparing GDP, employment and productivity growth across G7 countries since 2008.
Public finances data are subject to regular classification and methodological changes. This box outlined the classification changes associated with the implementation of the new 2010 European System of Accounts (ESA10). Annex B of our March 2014 EFO explained these changes in more detail.
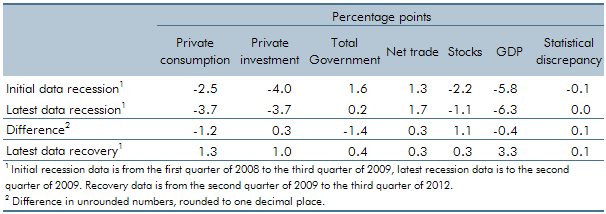
Revisions to National Accounts data are a normal part of the Blue Book process, which reconciles the different measures of GDP and incorporates information from annual data sources. The 2014 Blue Book contained particularly large changes because it was the first time that the National Accounts were published on an ESA10 accounting basis. This box set out some of the key changes in Blue Book 2014 and their impact on some of the key economy variables.
This box explored the implications of the new 2010 European System of Accounts (ESA10) on our public finances forecast, ahead of its incorporation in our December 2014 EFO. Annex B of our March 2014 EFO explained these changes in more detail.
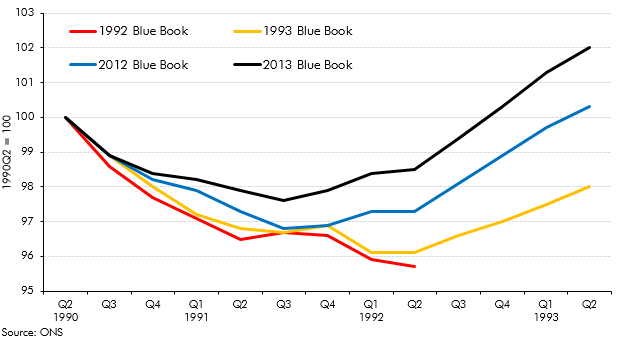
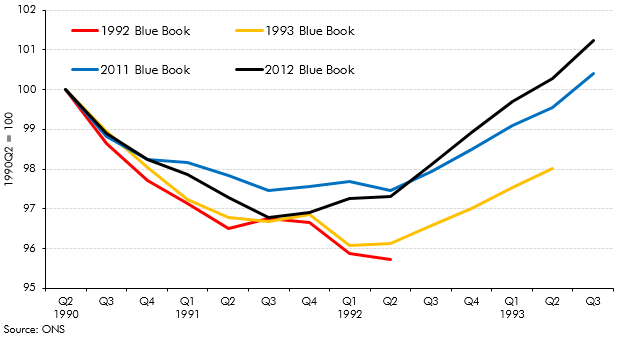
Revisions to National Accounts data are a normal part of the Blue Book process, which reconciles the different measures of GDP and incorporates information from annual data sources. This box explored how the estimated path of the 1990s recession and recovery evolved from estimates made in the 1992 Blue Book to estimates made in the 2013 Blue Book.
In our 2012 Forecast Evaluation Report, we noted that nominal GDP had held up closer to our June 2010 forecast than real GDP, helping to explain why our fiscal forecasts out to 2011-12 had remained broadly on track. This box in our 2013 Forecast Evaluation Report discussed how this assessment changed in light of revisions to GDP data. While nominal GDP now appeared to be weaker than forecast, the relatively tax-rich components - such as nominal consumption and wages and salaries - held up relatively well.
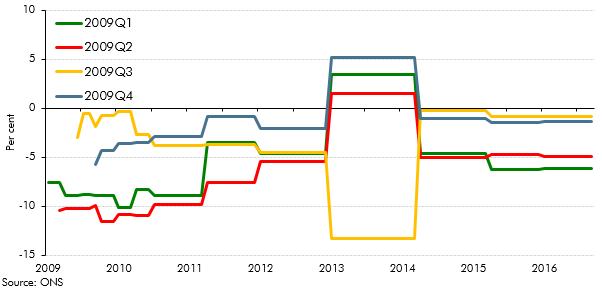
Revisions to National Accounts data are a normal part of the Blue Book process, which reconciles the different measures of GDP and incorporates information from annual data sources. This box explored the different picture of the late 2000s recession and recovery in light of the 2012 Blue Book.
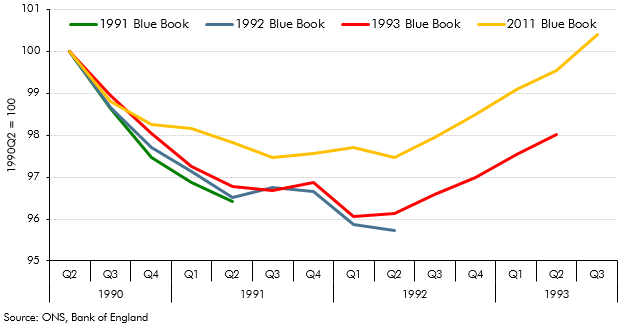
Each year, the ONS publishes the National Accounts ‘Blue Book’. The revisions it contains are often a source of revisions to our subsequent forecasts. In this box, we illustrated the scope for history to be rewritten by exploring how the reported pattern of the recession and recovery of the early 1990s had evolved between the Blue Books published shortly after the recession and the most recent Blue Books available at the time.
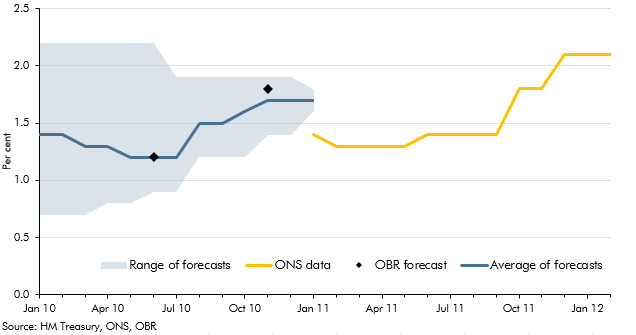
Both forecasts and National Accounts data are subject to revision. This box discussed how outside forecasts for growth in 2010 evolved through that year and compared these forecasts with ONS outturns, from the ONS' first estimate made in January 2011 through to their latest available estimate in February 2012.
Revisions to National Accounts data are a normal part of the Blue Book process, which reconciles the different measures of GDP and incorporates information from annual data sources. This box explored how the estimated path of the 1990s recession and recovery evolved from estimates made in the 1992 Blue Book to estimates made in the 2011 Blue Book.
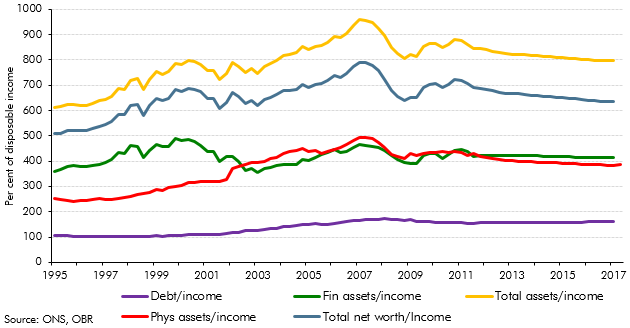
Our November 2011 forecast implied that households would take on around £480 billion of additional debt over the forecast period. This box discussed the implications of this for the household balance sheet, noting that a large part of the increase in household debt reflects borrowing for the purchase of assets. The box also discussed the downward revision in our household debt forecast since our previous EFO, which was largely accounted for by a combination of higher saving and a weaker housing market outlook.
Revisions to National Accounts data are a normal part of the Blue Book process, which reconciles the different measures of GDP and incorporates information from annual data sources. This box set out the key differences between the vintage of data used for the purposes of the October 2011 Forecast Evaluation Report and the data consistent with the 2011 Blue Book.

