
Revisions to National Accounts data are a normal part of the Blue Book process, which reconciles the different measures of GDP and incorporates information from annual data sources. This box explored how the estimated path of the 1990s recession and recovery evolved from estimates made in the 1992 Blue Book to estimates made in the 2013 Blue Book.
This box is based on ONS GDP data from September 2013 .
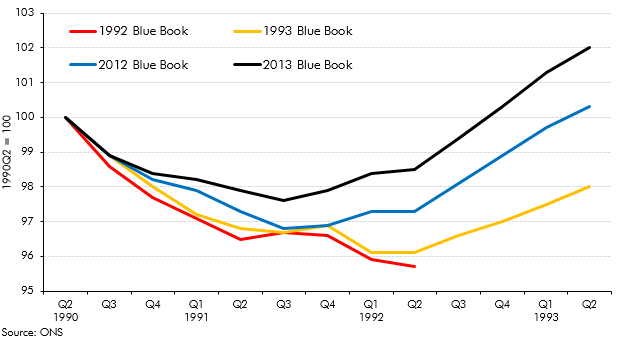
Chart A shows the estimated path of GDP from the second quarter of 1990 as recorded shortly after the recession ended, in the 1992 and 1993 Blue Books, as well as in the two most recent Blue Books, in 2012 and 2013. The 1992 Blue Book suggested that the economy shrank by 4.3 per cent from peak to trough and that there was a double-dip recession after a brief recovery at the end of 1991.
The 2012 vintage of data showed a smaller peak-to-trough decline of 3.2 per cent and no double dip. This year’s Blue Book has revised the decline down yet further to 2.4 per cent, and both vintages show a stronger recovery than was reported at the time. The latest data suggest cumulative growth in the three years from the pre-recession peak of 2.0 per cent, compared to a cumulative fall of the same amount estimated in the 1993 Blue Book, a difference of fully 4 percentage points.
Chart A: The changing profile of the 1990s recession and recovery
The first big revisions to the path of GDP in the early 1990s came in the 1998 Blue Book – reflecting new business survey data, a new vintage of the European System of Accounts and rebasing of the data to 1995 – and have continued subsequently. Later revisions tend to be prompted by methodological changes rather than by new or corrected information.