
As we closed our pre-measures forecast earlier than usual at October Budget 2021, our forecast did not include the Quarterly National Accounts released on 30 September 2021, which contained Blue Book 2021 consistent revisions. This box examined the potential implications that including the latest data may have had on our forecast. We judged that the data revisions and other developments since we closed our forecast would have largely offset one another, leaving our economic forecast broadly unchanged.
This box is based on ONS and OBR data from September and October 2021 .
Every year, the ONS updates the sources and methods for the UK National Accounts and publishes the latest estimates in its annual Blue Book publication. The 2021 Blue Book is set to be released on 29 October, but its implications for output up to and including 2019 were presaged in ONS publications on 28 June, 28 July and 8 September.a Blue Book changes for that period and up to the most recent data were also incorporated into the Quarterly National Accounts (QNA) for the second quarter of 2021, released on 30 September. As this was around a week after we finalised our pre-measures forecast on 24 September, these revisions were not incorporated into our forecast. In the QNA, the level of nominal GDP and cumulative real GDP growth since the onset of the pandemic were both revised up.
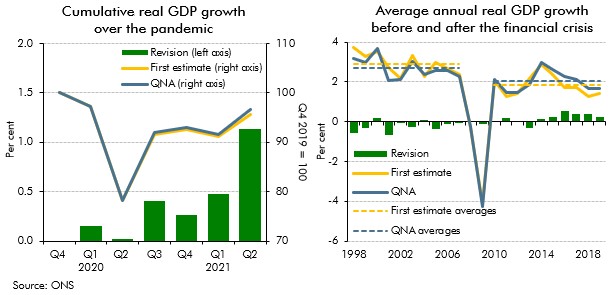
The revisions were partly due to incorporating more up-to-date data, including from the Financial Services Survey (FSS), which has raised the output of some financial institutions.b There were also methodological changes to the price indices used to deflate output.c These raised real growth in the telecoms sector, to account for the under-representation of internet services and an improvement in the handling of access charges for telecommunication services and incorporated ‘double deflation’ (so better accounting for changes in the prices of outputs and intermediate inputs in the calculation of real GDP). As the left-hand panel of Chart B shows, the revisions raised cumulative growth since the onset of the pandemic by 1.1 percentage points, leaving GDP in the second quarter of 2021 3.3 per cent lower than its pre-pandemic level, compared to an initial estimate of 4.4 per cent. Taken in isolation, these changes would have raised the starting level and near-term path of GDP in our forecast.
However, the QNA revisions were not the only significant piece of economic news since we closed our pre-measures forecast in late September that is relevant for our GDP forecast. Other developments, including higher gas prices, increased evidence of supply bottlenecks, and shortages in key occupations (discussed in Box 2.4), are likely to weigh on the recovery over the
next few months. We judge that the net impact of these post-forecast developments is likely to have left our forecast for the level of real GDP in early 2022 broadly unchanged. Moreover,
given the increased evidence of bottlenecks and shortages, we judge that the higher level of real GDP represents news about the strength of demand and the size of the near-term output gap,
rather than providing additional information about the underlying trajectory of potential output or prospects for the medium term.
The methodological revisions in Blue Book 2021 also imply modest changes in average real GDP growth in the decade before the financial crisis (down by 0.2 percentage points) and the
decade after it (up by 0.2 percentage points); see right-hand panel of Chart B. Although growth over the entire period is broadly unchanged, this reduces the corresponding post-crisis slowdown
in average annual productivity growth from 1.1 to 0.7 percentage points. Our forecast already assumes that productivity growth will pick up a little from the subdued rates seen since the
financial crisis and the revisions are broadly consistent with that.
Chart B: Real GDP revisions: over pandemic and annual since 1998
Nominal GDP is particularly important for understanding developments in the public finances as it represents the cash size of – and therefore tax base for – the economy as a whole. In the QNA,
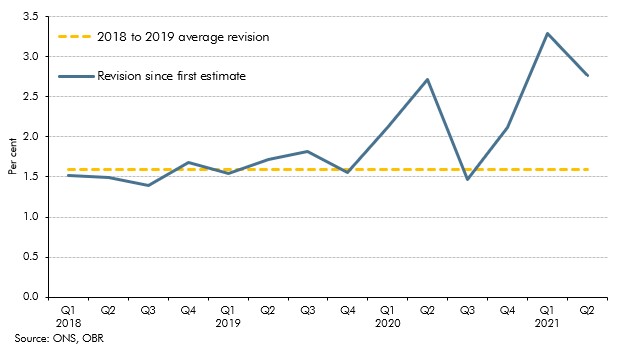
the level of nominal GDP was revised up by 2.8 per cent in the second quarter of 2021 (the latest quarterly outturn). As Chart C shows, 1.2 percentage points of the revision came from higher nominal growth since the fourth quarter of 2019. This largely corresponds to the upward revision to cumulative real growth outlined above. The remaining 1.6 percentage points (more than explained by the new FSS data) represents a general historical increase in the level of nominal GDP relative to real GDP (equivalently, a higher deflator). Since tax data are both more timely and less prone to revisions than nominal GDP data, the revisions have little impact on our fiscal forecast in cash terms. In outturn, it is offset by a correspondingly lower effective tax rate (and indeed brings the strength of nominal GDP growth more into line with the strength of receipts growth we had already seen during 2021-22). The higher level of nominal GDP will, however, have a purely arithmetic effect in lowering fiscal aggregates expressed as a share of nominal GDP (as we note in Chapter 3).
Chart C: Nominal GDP revisions
However, the period since we closed our forecast has also seen the accumulation of other news that would have been material to our projections for interest rates and other market-derived
assumptions as well as our forecast for inflation. And while the net effect of all post-forecast developments was probably neutral for real GDP (beyond the next couple of quarters), it was
probably negative overall for our fiscal forecast as discussed in Chapter 4.
This box was originally published in Economic and fiscal outlook – October 2021