
Box sets » Nominal GDP
As we finalised our pre-measures forecast on 26 September, our forecast did not include the Quarterly National Accounts released on 30 September 2024, which contained Blue Book 2024 consistent revisions. This box examined the potential implications that including the latest data may have had on our forecast. We judged that the data revisions would have provided limited new information on current economic conditions, leaving our economic and fiscal forecast broadly unchanged.
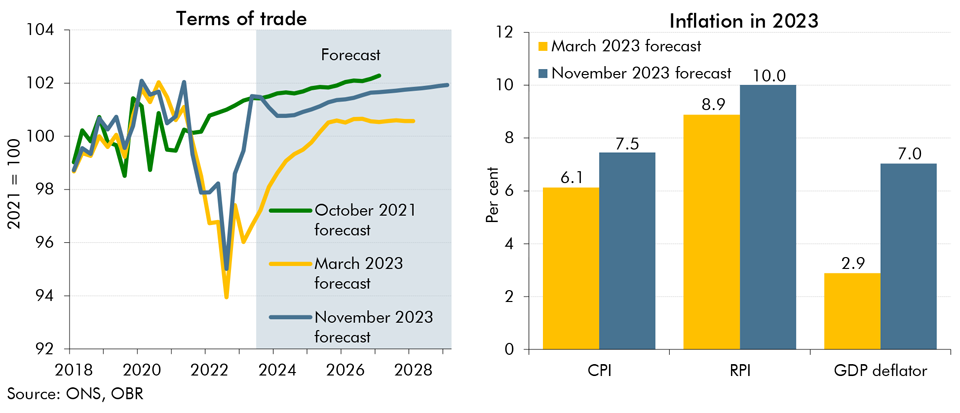
In our November 2023 forecast we expect inflation to be both more persistent and more domestically generated than in March. In this box we explored the reasons behind our assessment for inflation to be more domestically rather than externally driven and its implications for the public finances.
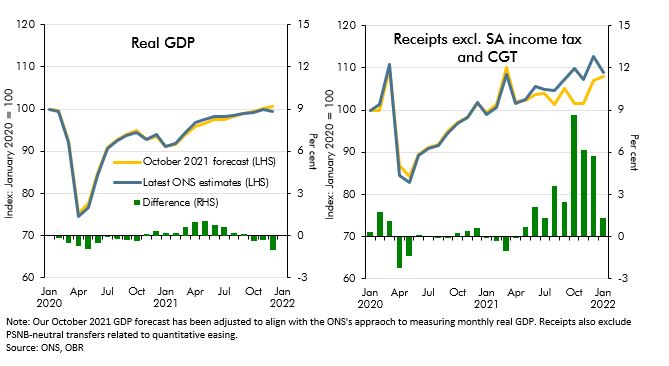
Since our October 2021 EFO the real economy has performed largely as expected in 21-22 but tax receipts have come in well above that forecast. In this box, we examined reasons why tax receipts have recovered so quickly particularly in comparison to economic data.
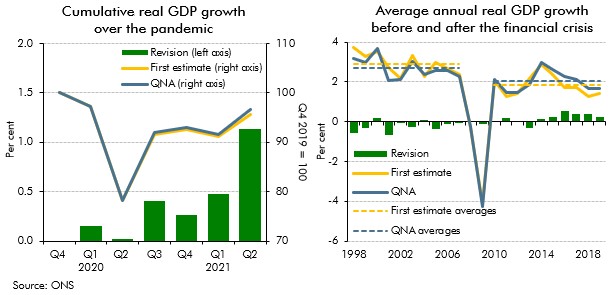
As we closed our pre-measures forecast earlier than usual at October Budget 2021, our forecast did not include the Quarterly National Accounts released on 30 September 2021, which contained Blue Book 2021 consistent revisions. This box examined the potential implications that including the latest data may have had on our forecast. We judged that the data revisions and other developments since we closed our forecast would have largely offset one another, leaving our economic forecast broadly unchanged.
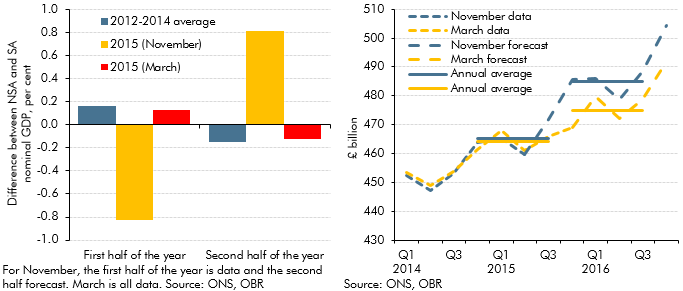
Our March 2016 Economic and fiscal outlook forecast was affected by an unusual quarterly profile of GDP growth on the non-seasonally adjusted measure that the Office for National Statistics uses as the denominator in fiscal measures. This box outlined that unusual pattern, how we had factored it into our forecast and the effects it had had on the profile of the debt-to-GDP ratio.
As part of our economic forecast, we produce forecasts for total employment and GDP per capita based on ONS population projections. Relative to our June 2010 forecast, employment in 2015 was 1 million higher than expected and GDP per capita over the period increased by 4.5 per cent lower. This box from our July 2015 Economic and fiscal outlook examined the reasons for these forecast errors.

In our 2015 Fiscal sustainability report, we assumed that GDP grows in line with its historical trend. This in effect implied 47 years of uninterrupted trend economic growth in our central projections. This box considered the alternative paths for debt as a share of GDP under an symmetric and asymmetric cycle, highlighting the sensitivity of the net debt projections to economic cycles.
An important economic development in the run-up to our March 2015 Economic and fiscal outlook was the sharp drop in oil prices, which had fallen to less than half the $115-a-barrel peak that they had reached in June 2014. In this box we considered the channels along which those lower oil prices were likely to affect the UK economy. (See also Box 2.1 from that EFO for a discussion of the demand- and supply-side factors contributing to lower oil prices.)
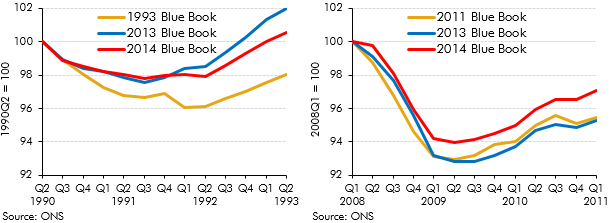
Revisions to National Accounts data are a normal part of the Blue Book process, which reconciles the different measures of GDP and incorporates information from annual data sources. The 2014 Blue Book contained particularly large changes because it was the first time that the National Accounts were published on an ESA10 accounting basis. This box set out some of the key changes in Blue Book 2014 and their impact on some of the key economy variables.
Each autumn, we publish our Forecast evaluation report (FER), a detailed examination of the performance of past economic and fiscal forecasts relative to the latest outturn data. This box discussed the OECD's and Bank of England's forecast errors, their explanations for these errors, and the lessons forecasters have learnt from the errors.
In our 2012 Forecast Evaluation Report, we noted that nominal GDP had held up closer to our June 2010 forecast than real GDP, helping to explain why our fiscal forecasts out to 2011-12 had remained broadly on track. This box in our 2013 Forecast Evaluation Report discussed how this assessment changed in light of revisions to GDP data. While nominal GDP now appeared to be weaker than forecast, the relatively tax-rich components - such as nominal consumption and wages and salaries - held up relatively well.
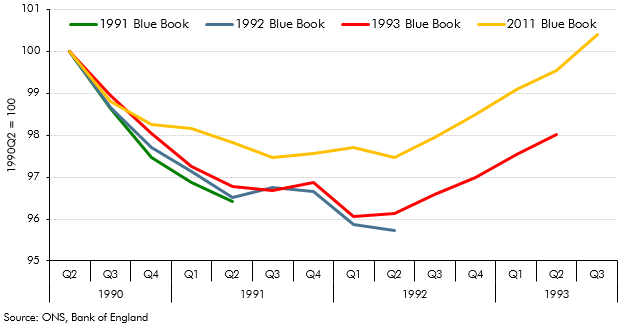
Revisions to National Accounts data are a normal part of the Blue Book process, which reconciles the different measures of GDP and incorporates information from annual data sources. This box explored how the estimated path of the 1990s recession and recovery evolved from estimates made in the 1992 Blue Book to estimates made in the 2011 Blue Book.
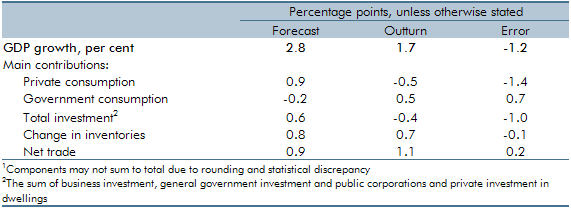
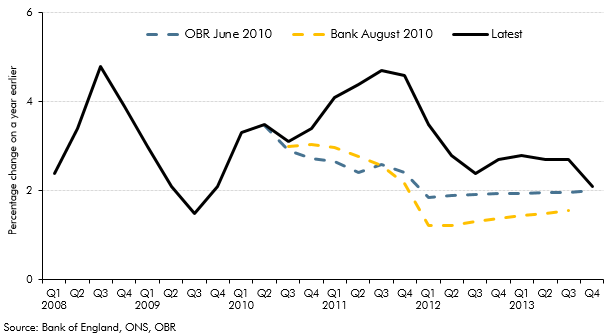
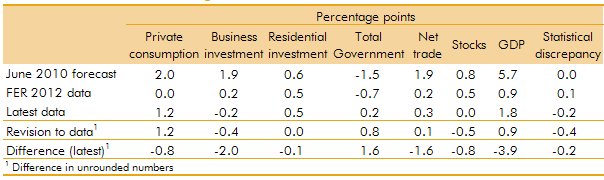
UK GDP had grown less quickly in 2010-11 than the OBR forecast in June 2010. This box decomposed the forecast error by expenditure component and discussed possible explanations, including the external inflation shock.
Revisions to National Accounts data are a normal part of the Blue Book process, which reconciles the different measures of GDP and incorporates information from annual data sources. This box set out the key differences between the vintage of data used for the purposes of the October 2011 Forecast Evaluation Report and the data consistent with the 2011 Blue Book.
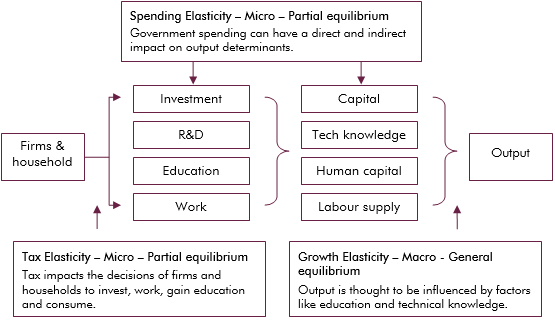
Economic theory suggests that tax and spending can impact output directly, such as expenditure on infrastructure, or indirectly, such as influencing the decisions of households and firms. This box explored the empirical evidence on whether tax and spending has a level (temporary) effect on output growth, or a growth (permanent) effect.
In our central forecast, interest rates are assumed to evolve in line with financial market expectations. For alternative economic scenarios which involve different paths for the output gap and inflation, it is useful to specify rules for the way monetary policy is set and for how output and employment will respond. In this box, we set out the rules that governed those relationships in the scenarios we analysed in the March 2011 Economic and fiscal outlook: a persistent inflation scenario and a weak euro scenario.