
In our November 2023 forecast we expect inflation to be both more persistent and more domestically generated than in March. In this box we explored the reasons behind our assessment for inflation to be more domestically rather than externally driven and its implications for the public finances.
This box is based on ONS, Datastream, Eikon and OfGEM data from October 2023 .
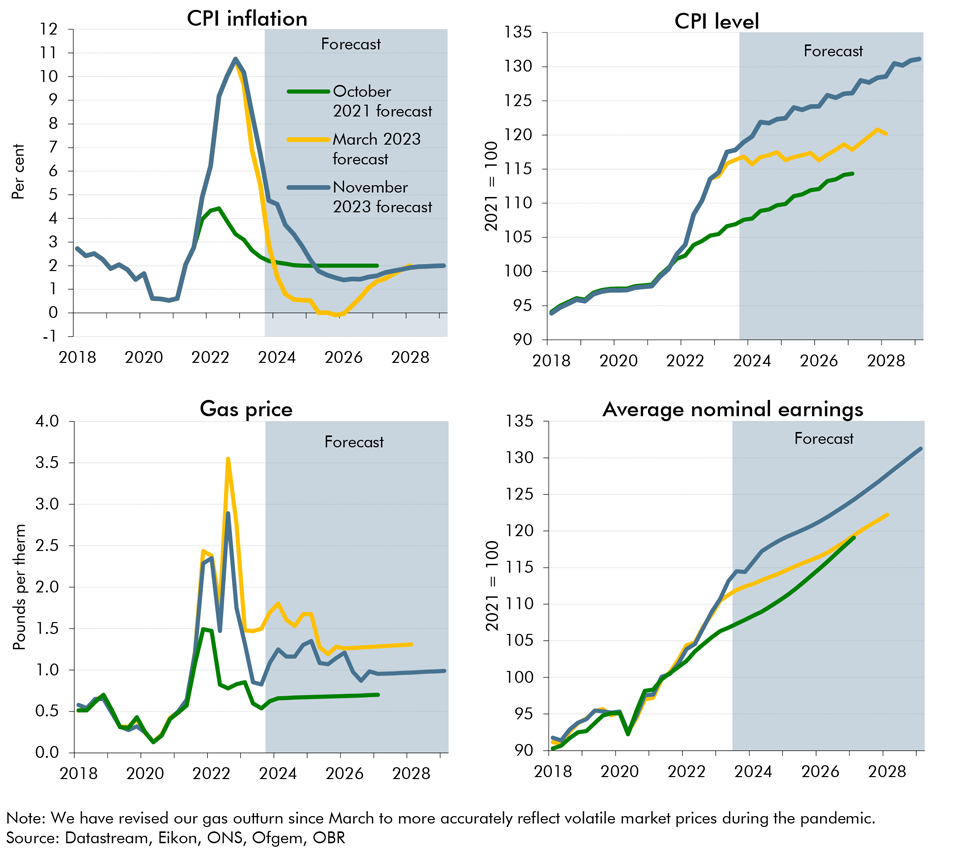
While it has fallen significantly over the course of 2023, CPI inflation is higher, and is expected to remain above the 2 per cent target for longer, than we had assumed in previous forecasts, as shown in the top left panel of Chart B. Our March 2023 central forecast was for inflation at 6.1 per cent in 2023 (well above the roughly 2 per cent a year in our October 2021 forecast), before falling sharply to average just under 0.8 per cent between 2024 and 2027. In this forecast, it averages 7.5 per cent over 2023 and then falls more slowly, averaging 2.1 per cent between 2024 and 2028. The CPI is therefore 7.0 per cent higher by the start of 2028 than in March (top-right panel of Chart B).
As well as being more persistent, we now expect inflation to be more domestically generated than in our March 2023 forecast, rather than being driven largely by external factors. This change in the expected composition of inflation is due to:
- Lower energy prices. Our March inflation forecast was driven by a sharp increase in the cost of imported energy. As shown in the bottom left panel of Chart B, gas prices are now expected to be around 36 per cent lower by the end of 2023 than in our March forecast. By 2027-28, the gap is still 26 per cent. This puts downward pressure on ‘imported’ energy inflation;
- Stronger second-round effects from the energy shock. We now estimate that the knock-on effect of energy costs on wider prices has been almost 50 per cent of their direct contribution to CPI inflation (rather than the 25 per cent assumed since our March 2022 forecast).a So, this pushes up ‘domestic’ inflation by more than in our previous forecasts;
- Less economic slack relative to March. As explained in Paragraph 2.17, we judge that the economy was operating around 0.5 per cent above its capacity in the second quarter of 2023. This is well ahead of the 1.3 per cent negative output gap we expected in March. A higher degree of excess demand in the first years of the forecast drives earnings and profits higher. Compared to March, we expect nominal earnings to be up 1.3 per cent by end-2023 and up 3.8 per cent by 2027-28 (bottom right of Chart B).
Chart B: Changes to inflation and inflationary pressures
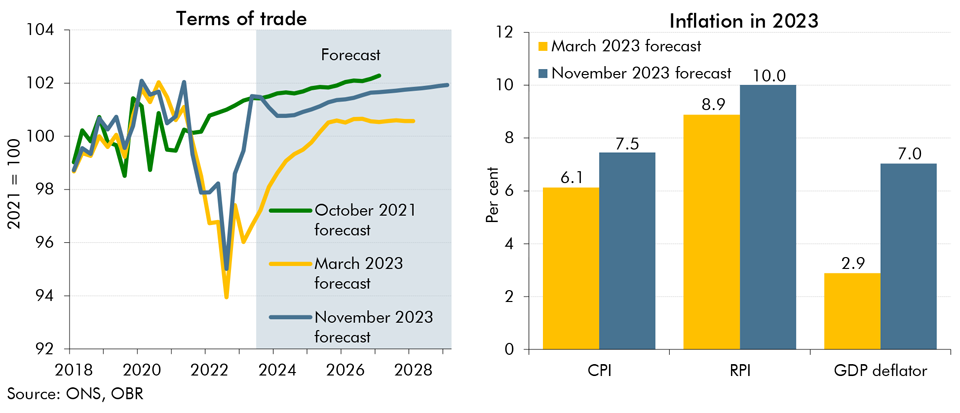
A sharper fall in imported energy prices, stronger growth in wages and profits, and revisions to outturn data have delivered a faster-than-expected recovery in the UK’s terms of trade (the price of UK exports relative to imports). We now forecast the terms of trade only slightly below levels seen prior to Russia’s invasion of Ukraine over the next five years (left panel, Chart C). This stronger recovery means more of the rise in CPI inflation is reflected in higher GDP deflator growth (a measure of the price of domestically-produced goods and services).b In March, we expected CPI and RPI inflation of 6.1 and 8.9 per cent respectively in 2023, but GDP deflator growth of just 2.9 per cent. We now expect 1.3 and 1.1 percentage points higher CPI and RPI inflation, respectively, at 7.5 and 10 per cent in 2023. But in an even larger revision, we expect 4.1 percentage points higher deflator growth, averaging 7.0 per cent in 2023 (right panel).
Chart C: Terms of trade forecasts and inflation in 2023
This shift in both the level and composition of inflation over the forecast period has important implications for the public finances. This is because:
- The GDP deflator is a key driver of tax revenues, whose bases (including wages, consumption and profits) depend on the nominal value of domestic economic activity. Frozen personal tax thresholds deliver a further boost to receipts through fiscal drag – as stronger nominal wage growth pushes more taxpayers into higher tax bands.
- CPI and RPI are key drivers of the cost of welfare benefits (most of which are indexed to CPI) and debt interest spending. Around a quarter of public debt is indexed to RPI and higher CPI inflation expectations tend to push up nominal interest rates on other government liabilities such as conventional gilts and Bank of England reserves.
- Departmental expenditure limits (DELs) over the current Spending Review period (up to 2024-25) are eroded by higher inflation, despite an increase in cash DELs at this Autumn Statement (£5.9 billion on average). From 2025-26, the Government assumes that day-to-day spending grows by an average of 0.9 per cent a year in real terms (using the GDP deflator), and capital spending remains frozen in cash terms. As a result, higher inflation does not fully feed through to higher departmental spending totals, and instead increases the cost pressure on departmental budgets within these overall totals.
These effects mean that this higher and more domestically driven inflation explains much of the improvement since March in the pre-measures fiscal outlook. It has led to a significant boost to nominal receipts, only partly offset by higher welfare and debt interest spending. Given departmental spending has not been fully adjusted to reflect inflation, it also leads to a decline in its real value. These fiscal consequences are set out in detail in Chapter 4.
This box was originally published in Economic and fiscal outlook – November 2023