In our 2012 Forecast Evaluation Report, we noted that nominal GDP had held up closer to our June 2010 forecast than real GDP, helping to explain why our fiscal forecasts out to 2011-12 had remained broadly on track. This box in our 2013 Forecast Evaluation Report discussed how this assessment changed in light of revisions to GDP data. While nominal GDP now appeared to be weaker than forecast, the relatively tax-rich components - such as nominal consumption and wages and salaries - held up relatively well.
In last year’s report, based on the outturn data at the time, it appeared that nominal GDP had held up closer to our June 2010 forecast than real GDP. We thought this went some way to explaining why our fiscal forecasts out to 2011-12 remained broadly on track despite real growth being much weaker than expected.
But over the past year the ONS have revised down nominal GDP growth and revised up real GDP growth, doubling the real growth rate over the two years following the election. As Chart 2.6 shows, our over-optimism in forecasting nominal GDP growth up to mid-2012 is now greater than our over-optimism for real GDP growth.
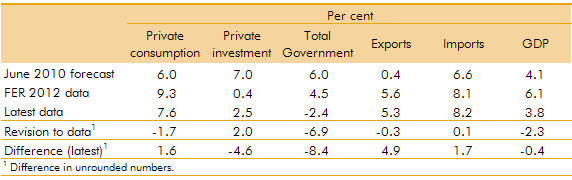
As shown in Table A, in addition to revising the level of GDP, the composition of growth has also been revised. Based on the earlier vintage of data, we attributed the underperformance of real GDP over our first two years in roughly equal measure to weaker private consumption, private investment and net trade. Revisions now suggest a clearer ordering, with business investment the biggest source of weakness, followed by net trade and then private consumption and stocks.
In some cases, even the direction of travel has been reversed: earlier estimates of a moderate rise in business investment have been replaced by a fall; government spending now adds to real growth, rather than subtracting from it; and private consumption, which had been flat, is now the largest contributor to GDP growth.
Most of these changes do not reflect revisions to the estimated cash value of these components of demand, but in the way they have been deflated to arrive at estimates for real GDP (Tables B and C). Nominal consumption growth has been revised a little higher, but private investment and net trade are little changed. The big revision on the nominal side relates to nominal government spending, which has been revised down, and a smaller share remains unexplained, as a statistical discrepancy.
Following methodological changes to the investment series, the investment deflator has been revised up, implying lower volumes for a given amount of cash spending. In contrast, the consumption deflator has been revised down, mainly on the housing side following changes in estimating imputed rents. The implied government spending deflator is also now estimated to have fallen, raising real expenditure by more than the downward revision to nominal spending.
Although nominal GDP now appears to have been much weaker than we originally forecast over the past three years, its relatively tax-rich components were closer to our June 2010 forecast. Nominal consumption, the main tax base for VAT, was slightly above forecast, and wages and salaries, the main tax base for income tax and national insurance contributions, also held up relatively well.
These changes are a reminder that the National Accounts data we have for the recent recession and the recovery are still very early drafts of economic history – and indeed the history of the previous recession is still being revised significantly from year to year even two decades after the event. A number of users have expressed themselves puzzled by the latest revisions to the investment data. And next year’s Blue Book will see a significant number of methodological changes to the National Accounts. So we should remember that any conclusions drawn from current data are necessarily provisional and are likely to remain so for some years to come.
Table A: Contributions to real GDP growth from 2010Q1 to 2012Q2
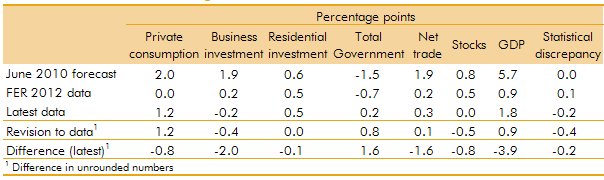
Table B: Contributions to nominal GDP growth from 2010Q1 to 2012Q2
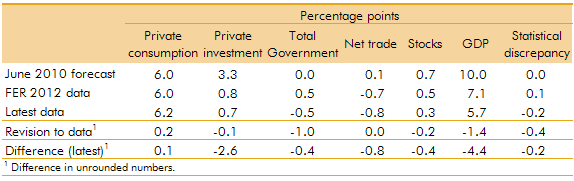
Table C: Growth in National Accounts deflators from 2010Q1 to 2012Q2