Revisions to National Accounts data are a normal part of the Blue Book process, which reconciles the different measures of GDP and incorporates information from annual data sources. This box explored how the estimated path of the 1990s recession and recovery evolved from estimates made in the 1992 Blue Book to estimates made in the 2011 Blue Book.
This box is based on ONS GDP and Bank of England Inflation Report data from October 2011 and October 2011 respectively.
Revisions to National Accounts data are a normal part of the Blue Book process, which reconciles the different measures of GDP and incorporates information from annual data sources, such as the Annual Business Survey and HMRC tax data. However, even after all data sources have been incorporated, methodological changes can mean further (and sometimes even larger) revisions years later.
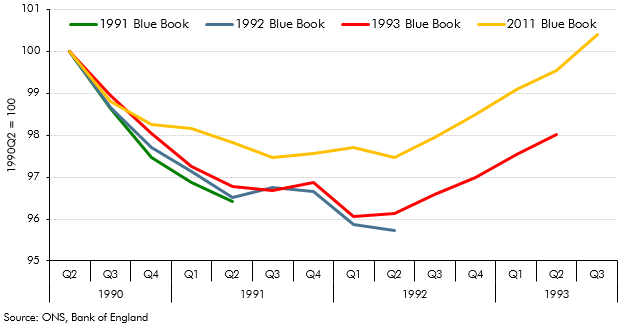
Looking at revisions to estimates of GDP in the early 1990s is instructive. Chart A shows the profile of the 1990s recession and recovery as recorded in the 1991 Blue Book, the two subsequent Blue Books, and in the 2011 Blue Book. The 1992 Blue Book suggested that the economy shrank by 4.3 per cent from peak to trough and that there was a pronounced ‘double dip’ recession after a brief recovery at the end of 1991. In contrast, the latest vintage of data shows a much smaller peak-to-trough decline of 2.5 per cent and no apparent double dip.
Chart A: The changing profile of the 1990s recession and recovery