
Our March 2016 Economic and fiscal outlook forecast was affected by an unusual quarterly profile of GDP growth on the non-seasonally adjusted measure that the Office for National Statistics uses as the denominator in fiscal measures. This box outlined that unusual pattern, how we had factored it into our forecast and the effects it had had on the profile of the debt-to-GDP ratio.
This box is based on ONS nominal GDP data from December 2015 .
The economy and public finances are affected by many factors, including some predictable ups and downs during the course of the year: Christmas boosts high street spending; people are more likely to move house in the summer than the winter; and so on.
The headline GDP data that form the basis of our economy forecast are ‘seasonally adjusted’ by the Office for National Statistics (ONS) to strip out those regular patterns. But the headline ONS public finances data on which our fiscal forecast – and the Government’s fiscal targets – are based are not. For consistency, when the ONS presents official estimates of the deficit or debt as a percentage of GDP, rather than in billions of pounds, it uses the non-seasonally adjusted (NSA) measure of nominal GDP as the denominator. Moreover, it uses different time periods to calculate the denominators:
- the ratio for the deficit in any given fiscal year is straightforward. It is the cash deficit divided by the sum of NSA nominal GDP over the four quarters that comprise the fiscal year. In other words, the second quarter of 2015 to the first quarter of 2016, for fiscal year 2015-16; and
- the ratio for net debt in a particular fiscal year is slightly less intuitive. Because debt is a stock rather than a flow, the conventional way to define the debt ratio for 2015-16 is to focus on the level of debt at the end of the year. This is calculated as the cash value of the debt at the end of the year divided by the sum of NSA nominal GDP for the previous and subsequent six months. In other words, from the fourth quarter of 2015 to the third quarter of 2016, for the 2015-16 fiscal year.
As a result, we need to forecast NSA nominal GDP for our fiscal forecast. We do that by applying a 3-year average of the quarterly seasonal factors implied by the ONS nominal GDP data to add a seasonal pattern to our forecast. This normally is not noteworthy, but in our November forecast it made a material difference to the path of the debt ratio and the revision between November and this forecast has been large. Chapter 5 sets out the implications this has had for the Government’s target to reduce debt as a share of GDP each year.
Headline nominal GDP growth during 2015 has slowed significantly – to 1.9 per cent in the year to the final quarter of 2015, far below the 3.9 per cent we forecast in November. As discussed below, this reflects ONS revisions through the year as well as the first estimate for the fourth quarter, which was published last month. Slower growth in seasonally adjusted nominal GDP would have reduced our forecast of the NSA measure anyway. But a change in the ONS estimates of the seasonal pattern through 2015 has pushed it down even further.
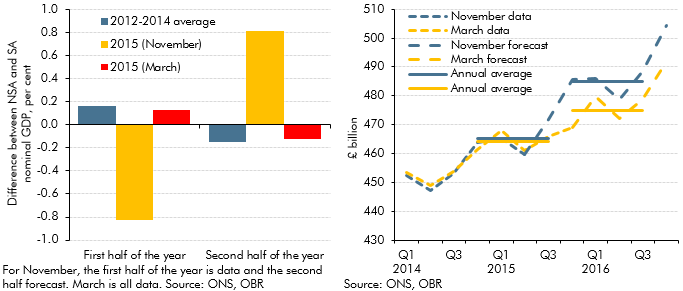
Chart A shows how the GDP estimates available at the time of our November forecast reported an unusually big gap between NSA and headline nominal GDP in the first half of 2015, with NSA low relative to the headline figure. These seasonal effects must by definition cancel out over the calendar year, so that meant that our forecast in November had to assume NSA GDP would be higher in the second half of the year, which boosted growth in NSA nominal GDP in the period used as the denominator for 2015-16 debt-to-GDP. The latest ONS data show a seasonal pattern through 2015 that looks more like previous years, which means the shortfall in NSA nominal GDP growth relative to our November forecast is even greater: 1.7 per cent year-on-year in the final quarter of 2015 relative to our forecast of 4.7 per cent.
Chart B shows how the combination of weaker headline nominal GDP growth and revisions to the estimated seasonal pattern of activity through 2015 have affected annual average growth in NSA nominal GDP in the denominator period for the 2015-16 debt-to-GDP calculation:
- in the first two quarters of 2015, the latest data have been revised up, as the revision to the implied seasonal factors more than offset weaker headline nominal GDP;
- in the second half of 2015, the latest data are much weaker than we forecast in November, with weakness in headline nominal GDP explaining around two-thirds of the shortfall and the change in the assumed seasonal pattern the rest;
- a lower expected level of nominal GDP in 2016, mainly due to the unexpected weakness at the end of 2015; and
- the combination of a slightly higher average level of NSA nominal GDP in the base year and a much lower level in the denominator year means that annual growth has been revised down from 4.3 per cent in November to 2.3 per cent in this forecast. For a given year-on-year change in the level of debt, it is that growth rate that affects the pace at which debt is estimated to rise or fall as a share of GDP.
Chart A: The seasonal profile of nominal GDP and Chart B: Non-seasonally adjusted nominal GDP growth data and forecasts
This box was originally published in Economic and fiscal outlook – March 2016