
Box sets » Public sector net debt

Public sector net debt (ex BoE) has risen substantially over the past 25 years, despite repeated government plans to get it falling. In this box, we examined the key drivers behind this upward trend, including the impact of major economic shocks, the persistent gap between forecasted and actual debt outcomes, and the increasing difficulty of stabilising debt due to structural fiscal pressures.

The UK’s fiscal position is increasingly vulnerable, by both historical and international standards. In this box, we considered the drivers of fiscal vulnerability, such as persistent large deficits, slower growth and higher interest rates, and the extent to which these may limit the Government's scope to respond to future economic shocks.
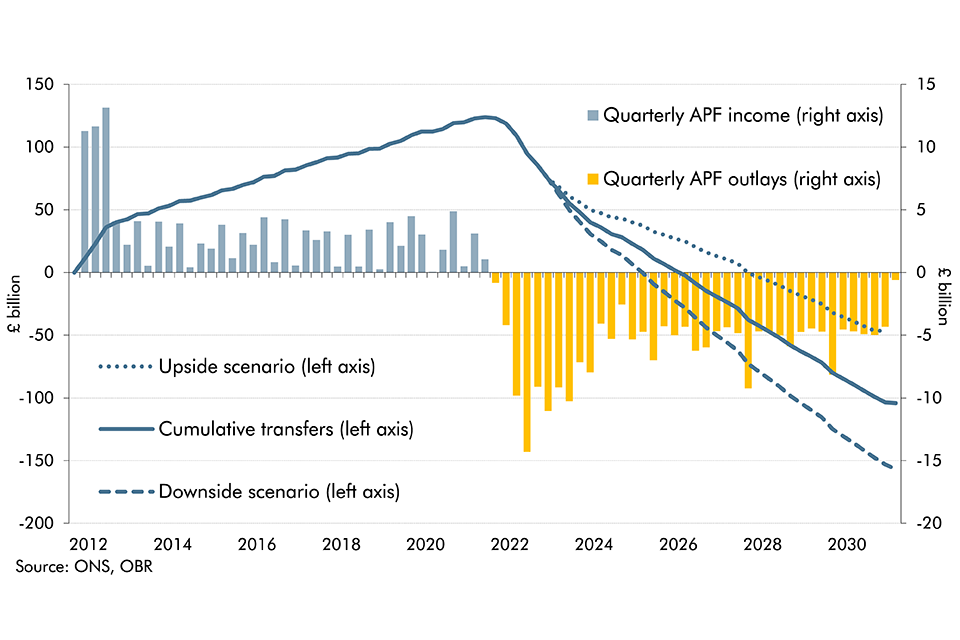
The Bank of England's Asset Purchase Facility (APF) conducts the Bank's operations for quantitative easing and tightening. In this box we updated our estimate of the lifetime direct costs of the APF and scenario analysis looked at the impact of changes in interest rates on this lifetime cost.

Public sector net debt (excluding the Bank of England) as a share of GDP has tripled since the beginning of this century. This box explored the drivers of the rise and its evolution over the forecast.
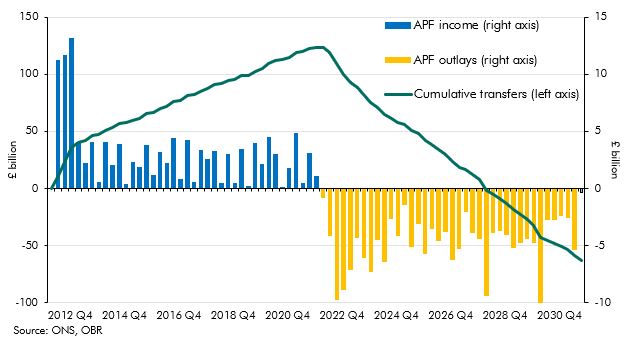
Up to July 2022 the Bank of England's quantitative easing (QE) activities had made large profits resulting in large transfers to the Treasury but since then flows have reversed. This box described what the whole lifetime direct costs of QE would be based on our March EFO assumptions.
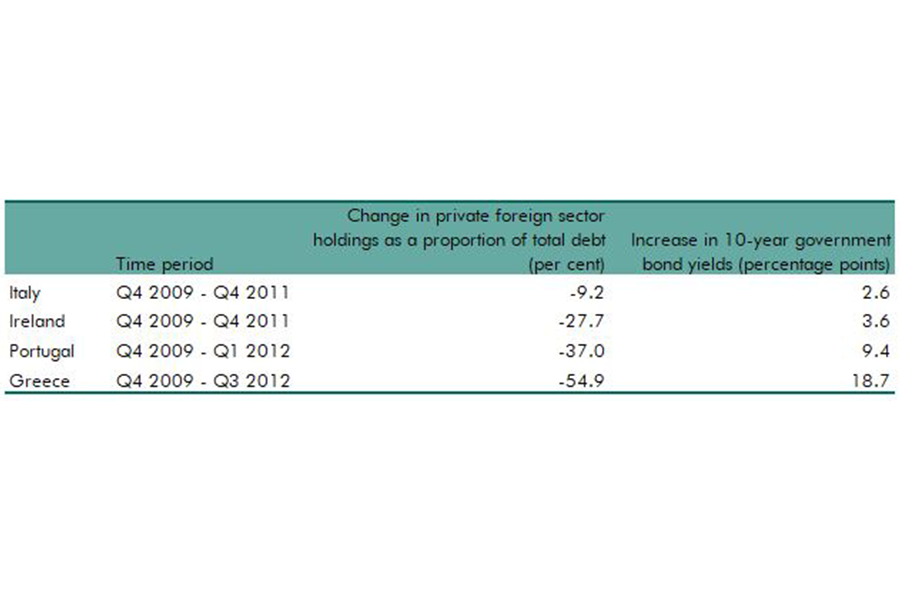
As the stock of foreign holdings of UK debt has risen this century, so have questions about the risks of increasing, relatively high, levels of these holdings. This box looked at the why holdings of debt by foreign investors may lead to greater market volatility.
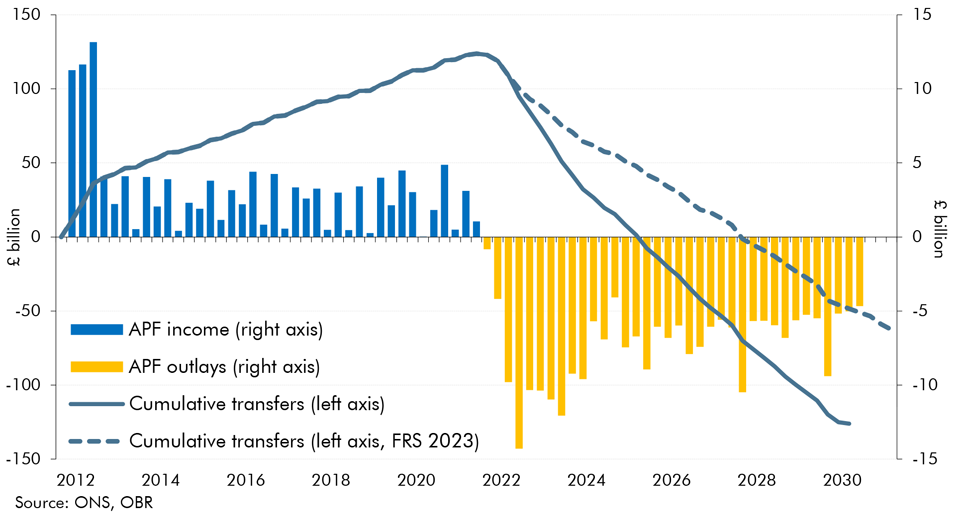
The Bank of England's Asset Purchase Facility (APF) conducts the Bank's operations for quantitative easing and tightening. Since the sharp rise in interest rates in 2022, historic profits from the APF have turned to losses. This box looked at the impact of these losses on fiscal aggregates and the lifetime direct cost of QE.
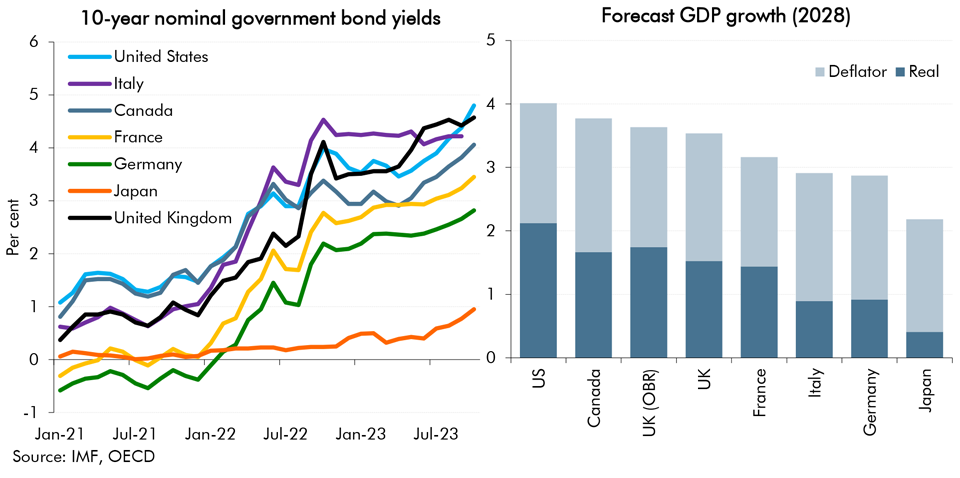
In our November 2023 forecast, alongside higher interest rates, we revised down our estimates for medium term growth. This box explored the challenging fiscal implications of the deterioration in the UK's growth-corrected interest rate, with comparison to other G7 economies.
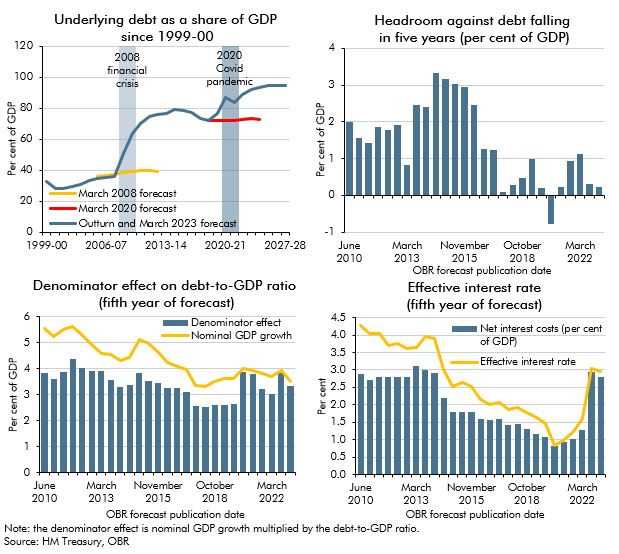
Since the financial crisis successive Chancellors have aimed to reduce debt as a share of GDP. This box looked at why that goal had proved difficult to achieve and in particular the challenges in our most recent forecasts.
We illustrate the uncertainty around our forecasts using a variety of approaches. This box described using stochastic simulations to produce fan charts, which could be used to enhance presentation of uncertainty in future EFOs, and showed some experimental results.
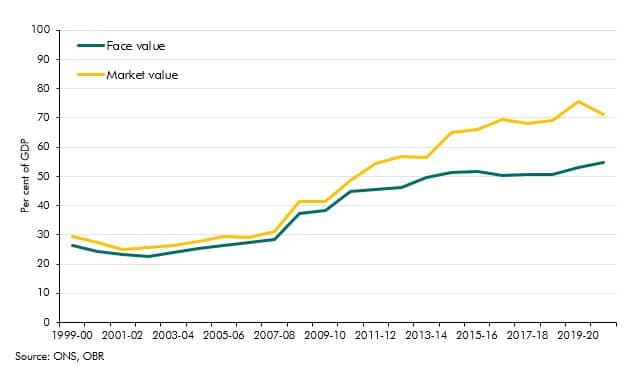
Government debt liabilities can be valued in various ways. In recent years market and face values have diverged sharply reaching 15% of GDP. In this box we explained why this has happened and why we use face value in our analysis.
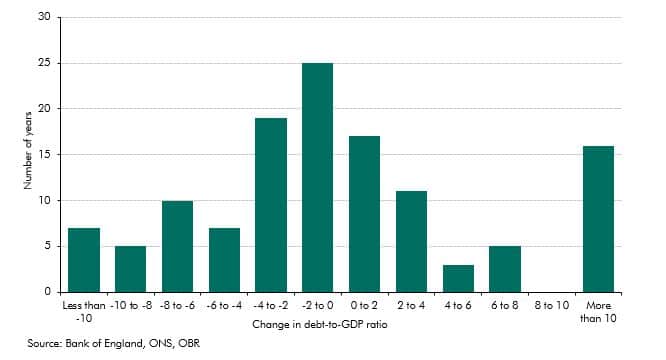
The history of UK government debt can be characterised as one of ‘punctuated equilibria’ in which long periods where the debt-to-GDP ratio is broadly stable or gradually falling are interspersed with occasional large increases in response to major shocks. This box looked at the instances of parge rises since 1900 and the long period of debt reduction after the second world war.
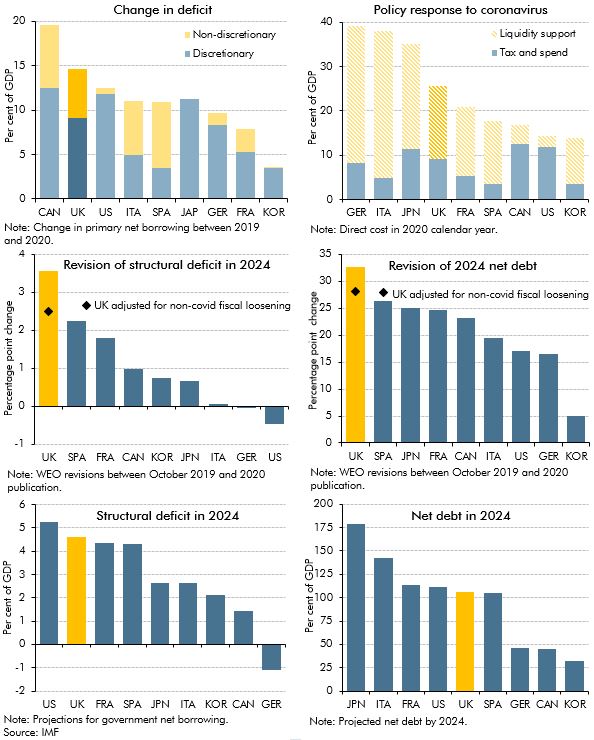
The pandemic has undoubtedly had a negative impact on public finances of countries around the world, but questions remain regarding the impact on the immediate and long-term fiscal positions of the UK relative to other major advanced economies. In this box, we considered the immediate term impact on primary deficits and the extent to which this reflected discretionary policy packages; the size of discretionary policy packages and the use of direct tax and spending policy versus liquidity support; and the impacts in the longer term on structural deficits and debt, including revisions between the IMF’s October 2019 and October 2020 WEO.
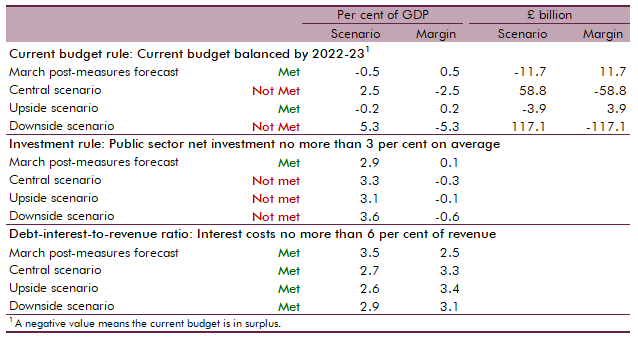
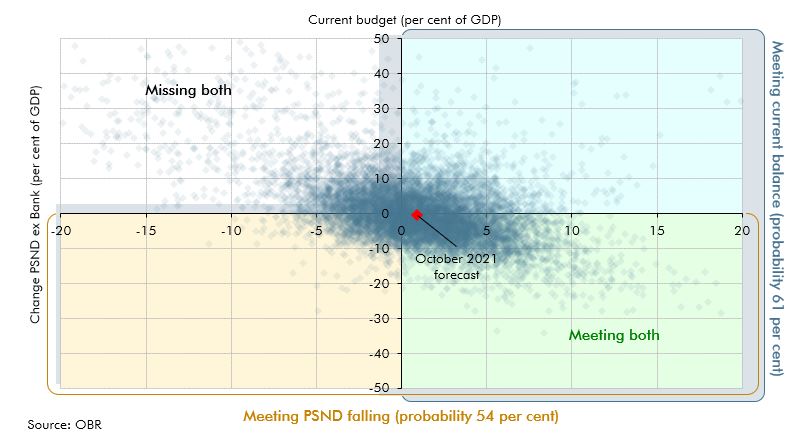
At Budget 2020 we assessed the Government's performance against the three proposed fiscal rules that featured in the Conservative Party's 2019 election manifesto. In this box we assessed whether the Government could meet these fiscal rules under our central, upside and downside scenarios.
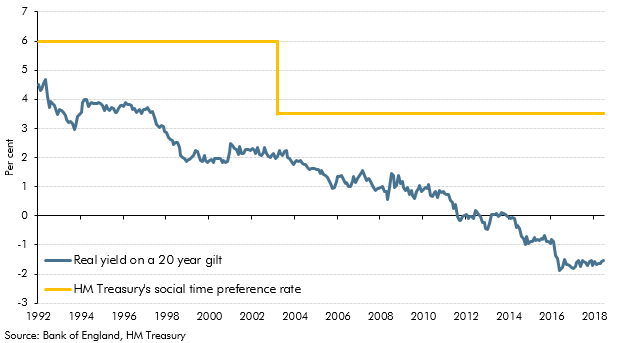
We incorporate sales of financial assets in our forecasts when firm details are available that allow the effects to be quantified with reasonable accuracy and allocated to a specific year. In the case of the sale of student loans the government also considers whether a sale offers value for money. This box looked at the way in which the Government uses discount rates to evaluate value for money, how this does not mean the sales strengthen the public finances and whether future sales are likely to proceed.
Public sector net financial liabilities (PSNFL) is a wider measure of the balance sheet than public sector net debt (PSND) and includes all financial assets and liabilities recognised in the National Accounts. In this box we examined some of these differences and presented a projection of the components of PSNFL.
When discussing the potential impact of fiscal risks on the public sector balance sheet in our 2017 Fiscal risks report, we focused on the Government’s target measure of public sector net debt and its broader, but less-well-known counterpart, public sector net financial liabilities. In this box we considered some of the pros and cons of three even broader measures of the public sector balance sheet.
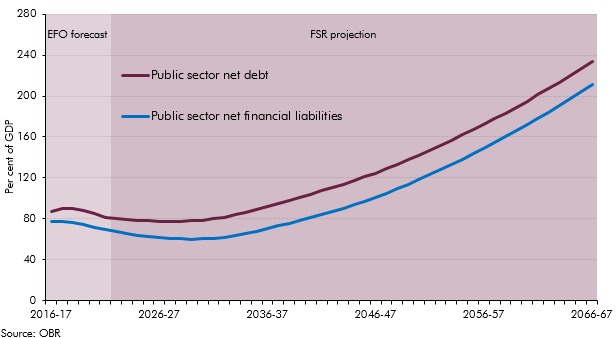
At Autumn Statement 2016 the Government asked us to forecast two new balance sheet metrics: PSND excluding the Bank of England and public sector net financial liabilities (PSNFL), a broader measure covering all the public sector’s financial assets and liabilities recorded in the National Accounts. This box presented our long-term projections for these two new balance sheet metrics with particular focus on PSNFL as PSND with and without the Bank of England tended to converge in our medium-term forecast and were expected to continue to do so over the long-term.
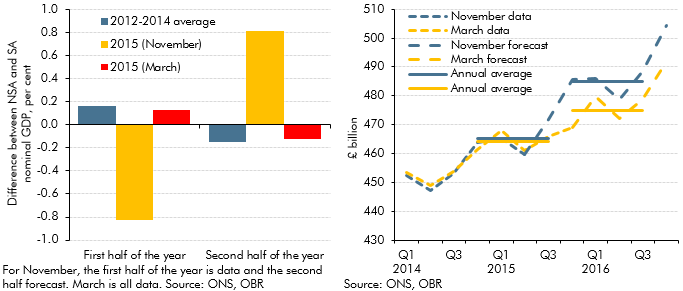
Our March 2016 Economic and fiscal outlook forecast was affected by an unusual quarterly profile of GDP growth on the non-seasonally adjusted measure that the Office for National Statistics uses as the denominator in fiscal measures. This box outlined that unusual pattern, how we had factored it into our forecast and the effects it had had on the profile of the debt-to-GDP ratio.

In our 2015 Fiscal sustainability report, we assumed that GDP grows in line with its historical trend. This in effect implied 47 years of uninterrupted trend economic growth in our central projections. This box considered the alternative paths for debt as a share of GDP under an symmetric and asymmetric cycle, highlighting the sensitivity of the net debt projections to economic cycles.
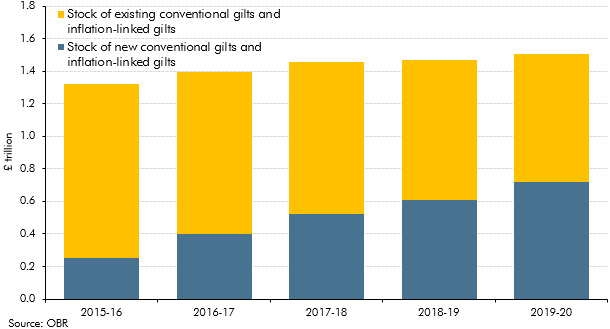
Our March 2015 Economic and fiscal outlook forecast highlighted large changes in our debt interest forecast since previous fiscal events and the added complexity that debt interest was expressed net of the effect of gilts held by the Bank of England Asset Purchase Facility (APF) associated with past quantitative easing. This box described how we produced the debt interest forecast and illustrated some of the sensitivities to which it was subject.
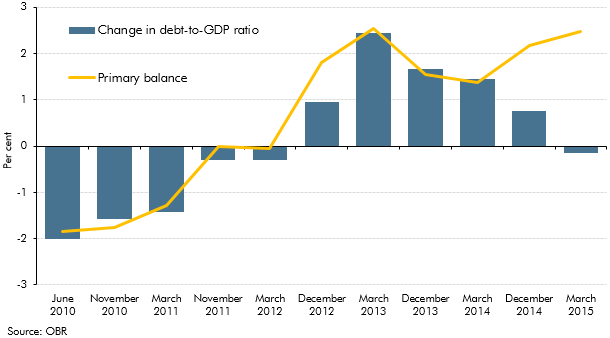
In our first June 2010 EFO, the debt-to-GDP ratio was forecast to fall by 2 per cent in 2015-16. This box explored how our debt-to-GDP forecast for 2015-16 evolved over time. It highlighted the contribution of the primary balance and the impact of other factors (including asset sales and the growth-interest differential) on the debt-to-GDP ratio forecast.
Public finances data are subject to regular classification and methodological changes. This box outlined the classification changes associated with the implementation of the new 2010 European System of Accounts (ESA10). Annex B of our March 2014 EFO explained these changes in more detail.
This box explored the implications of the new 2010 European System of Accounts (ESA10) on our public finances forecast, ahead of its incorporation in our December 2014 EFO. Annex B of our March 2014 EFO explained these changes in more detail.
Public finances data are subject to regular classification and methodological changes. This box outlined potential classification changes ahead of the PSF review. Annex B of our March 2014 EFO explained these changes in more detail.
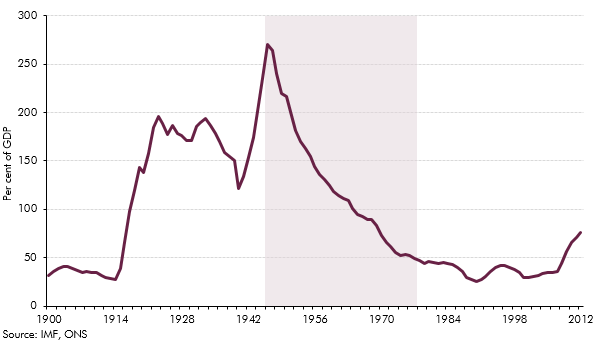
In assessing indicators of sustainability we examined the role of the gap between the real interest rate on government debt and the long-run growth rate of the economy. This box outlined the reasons behind Post-World War II debt reduction.
During the financial crisis, both Bradford & Bingley (B&B) and Northern Rock (Asset Management) (NRAM) were transferred to public ownership. The ONS has announced that it will reclassify both bodies into the central government sector. This box outlined the impact of the reclassification on our fiscal forecast.
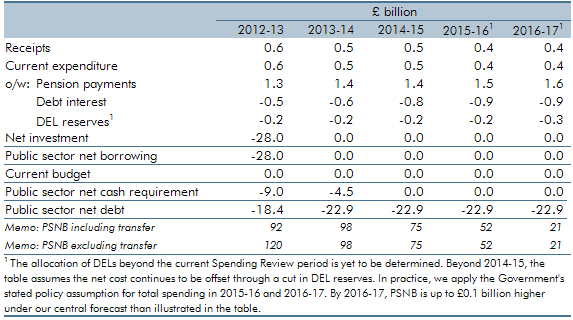
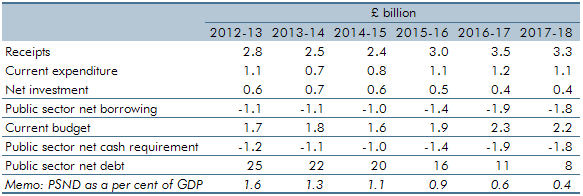
The Government announced that it intends to take on Royal Mail’s historic pension deficit with effect from April 2012. This box explored how the transfer of the relevant assets and liabilities will impact the public sector finances.
The Government announced in June 2011 that it intended to take on Royal Mail’s historic pension deficit with effect from April 2012. This box explored the provisional estimates of the impact this transfer had on the public finances.
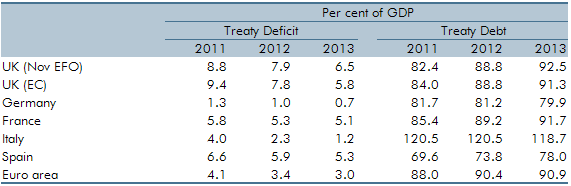
International organisations provide comparisons of deficit and debt levels. This box facilitated international comparisons by providing projections of Treaty debt and deficit on a calendar year basis.
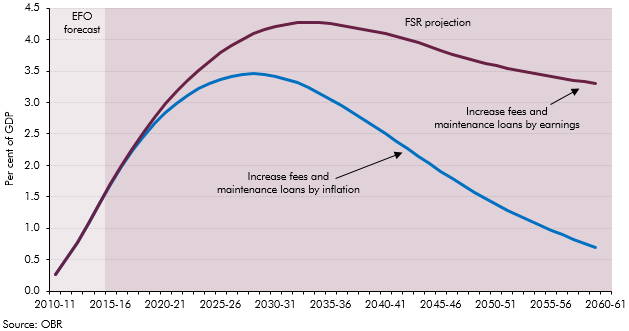
The Government carried out a number of reforms to the student finance support system, shifting funding from direct grants to loans to students. This box looked at the impact of student loans on public sector net debt.
There are several technical indicators of fiscal sustainability that stem from a forward-looking approach. This box considered a number of these indicators.