
Public sector net debt (excluding the Bank of England) as a share of GDP has tripled since the beginning of this century. This box explored the drivers of the rise and its evolution over the forecast.
This box is based on ONS and OBR data from March 2024 .
As shown in Chart A, since the beginning of the 21st century, public sector net debt excluding Bank of England (which the Government targets in its fiscal mandate) has increased sharply from 28.4 per cent of GDP in 2000-01 to 84.9 per cent of GDP in 2022-23. The evolution of debt as a share of GDP reflects three factors:
- the size of the primary budget balance – the difference between government spending excluding debt interest payments, and government receipts excluding interest receipts;
- the ‘growth-corrected’ interest rate (‘r-g’)– the difference between the interest rate paid on government debt (which raises the debt-to-GDP ratio) and the growth rate of output (which reduces it); and
- any financial transactions, valuation and classification effects – changes that are not reflected in borrowing but affect the government’s net cash requirement or the value of any liabilities or liquid assets that are captured in net debt.
Chart A: Public sector net debt (ex Bank of England) since 2000
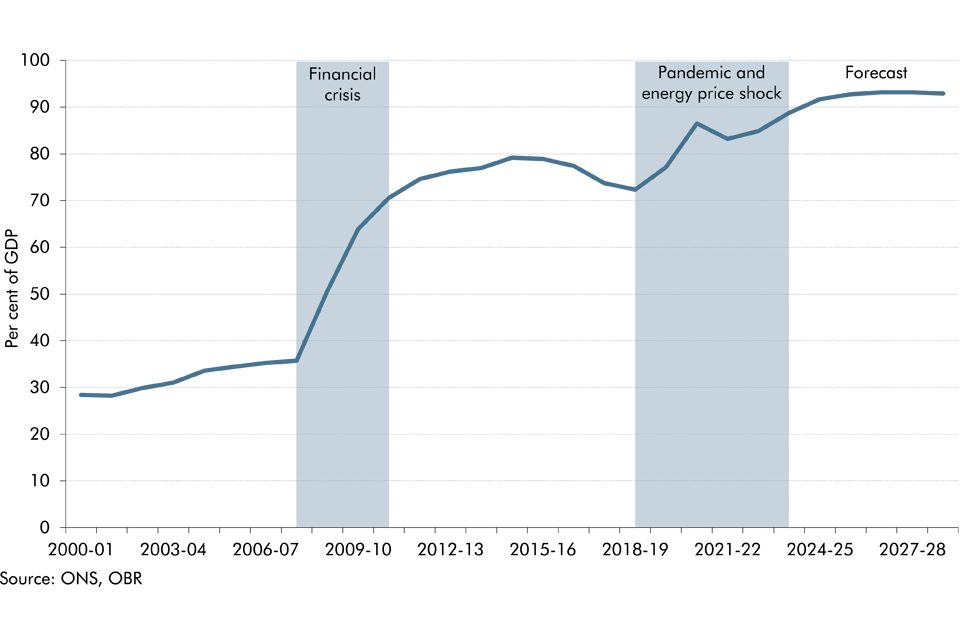
Chart B shows changes in net debt (excluding the Bank of England) divided into these three components.a It shows that:
- Between 2000 and 2007, the debt-to-GDP ratio rose by 7.4 per cent of GDP, due to a series of primary deficits which averaged 1.3 per cent of GDP after 2001-02. The contributions of financial transactions, and the growth-corrected interest rate, were both small and offsetting over this period.
- Between 2008 and 2010, the financial crisis led to debt rising by close to 35 per cent of GDP. This reflected a sharp rise in the primary deficit, with the cash value of spending rising relative to GDP (reflecting the sharp contraction in nominal GDP), while tax revenues fell even more sharply than GDP. The Government’s policy responses to the crisis in the form of purchases of bank shares, the acquisition of failed banks, and the provision of depositor compensation, meant financial transactions and valuation effects also pushed debt up sharply.
- Between 2011 and 2019, the debt-to-GDP ratio initially rose before levelling off and then falling in the final years of this period. The Government steadily reduced the primary deficit over this period, with the aim of reducing debt, and for most of this period this was supported by a favourable growth-corrected interest rate. Financial transaction and valuation effects (including from the quantitative easing or ‘QE’ operations of the Bank of England and the disposal of financial assets acquired through the financial crisis interventions) reduced debt by 1.7 per cent of GDP per year on average.
- From the end of 2019 to 2023, the combination of the pandemic and energy price shock led to debt rising by 12.6 per cent of GDP. The primary deficit peaked at 13.2 per cent of GDP in 2020-21, mainly due to the sizeable Covid policy support packages. The very sharp fall in growth at the start of the pandemic meant that the growth-corrected interest rate pushed debt up sharply initially, but this reversed even more dramatically when growth bounced back, and interest rates fell.
Chart B: Contributions to changes in the debt-to-GDP ratio (ex Bank of England)

In our central forecast, we expect the debt-to-GDP ratio (excluding the Bank of England) to rise by 3.9 per cent of GDP this year and then by a further 4.4 per cent of GDP between 2023-24 and 2027-28. In the final year, it falls modestly by 0.3 per cent of GDP. This reflects the net effect of:
- financial transactions and valuation effects which push up debt by an average of 1.9 per cent of GDP over the forecast period. These are partly driven by interest-related factors, through losses on the sales and redemption of gilts acquired during QE and held by the Bank of England’s Asset Purchase Facility. The rising stock of net outlays from student loans also adds to debt.b
- the growth-corrected interest rate which pushes down on debt over the forecast period by an average of -0.4 per cent of GDP per year. The growth-corrected interest rate offers less of a fiscal benefit than during the pre-pandemic period between 2011 and 2019 when it averaged -0.7 per cent of GDP; and
- the primary balance which moves from a primary deficit of 1.2 per cent of GDP in 2023-24 to a surplus of 1.6 per cent of GDP in 2028-29. If realised, this would be the largest primary surplus since the start of this century.
This box was originally published in Economic and fiscal outlook – March 2024
a Throughout this box, we use March-centred GDP for expressing the primary deficit and financial transactions and valuation effects as a share of GDP to provide a consistent decomposition of debt.
b In addition to rising net outlays, the change in the undergraduate student loan payment plan from “Plan 2” and “Plan 5” means that a higher share of net outlays are captured within financial transactions and valuation effects rather than the primary deficit.