In our first June 2010 EFO, the debt-to-GDP ratio was forecast to fall by 2 per cent in 2015-16. This box explored how our debt-to-GDP forecast for 2015-16 evolved over time. It highlighted the contribution of the primary balance and the impact of other factors (including asset sales and the growth-interest differential) on the debt-to-GDP ratio forecast.
In the first OBR forecast of this Parliament in June 2010, the debt-to-GDP ratio was forecast to fall by 2.0 per cent in 2015-16, comfortably meeting the supplementary target the Coalition Government set in its first Budget. As Chart A shows, over time that margin was reduced until in our December 2012 forecast we expected debt to rise by 1.0 per cent of GDP in 2015-16. The amount by which debt was expected to increase in 2015-16 peaked at 2.4 per cent of GDP in our March 2013 forecast. Since then, the gap has declined. And we now expect the debt-to-GDP ratio to fall in 2015-16, by the small margin of 0.2 per cent.
Chart A: Successive forecasts for the change in the debt-to-GDP ratio and primary balance in 2015-16
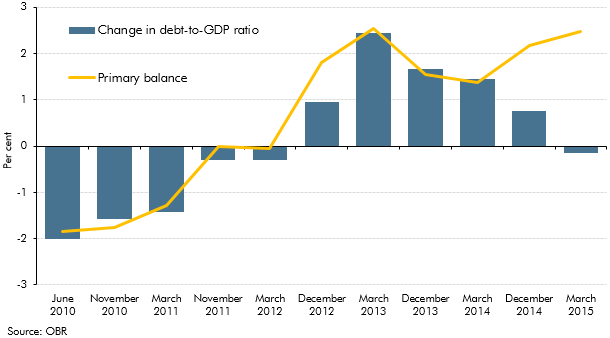
Chart A also shows that between June 2010 and March 2013 (and continuing up to March 2014), projected changes in the debt-to-GDP ratio in 2015-16 could largely be explained by our forecast of the primary balance. That has not been the case in our two most recent forecasts.
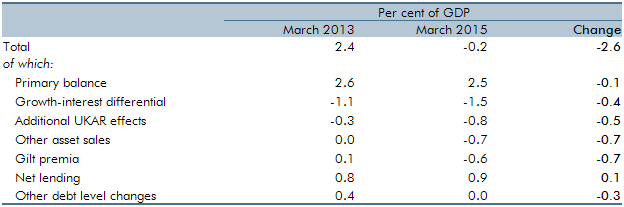
What has happened since March 2013 so that the debt-to-GDP ratio is now expected to fall? Table A uses the same decomposition of changes in the debt ratio as in Chart 5.2. It shows that:
- our forecast of the primary balance in 2015-16 has changed little since March 2013. The precise revision has been just 0.1 per cent of GDP, although this reflects an improvement up to March 2014 and then a reversal;
- the difference between interest rates and GDP growth in 2015-16 is more favourable in our latest forecast than it was in March 2013. Our nominal GDP growth forecast is 0.5 percentage points lower, but implied interest rates are 1.1 percentage points lower. The net effect is an additional 0.4 per cent of GDP reduction in the debt ratio; and
- the main factors helping to reduce the debt ratio in 2015-16 by more than expected in March 2013 do not reduce borrowing:
- running down UK Asset Resolution’s loan book, including through the sale of mortgage assets, reduces the ratio by another 0.5 per cent of GDP;
- other subsequently announced asset sales – notably Government shareholdings in Lloyds Banking Group – subtract 0.7 per cent of GDP from debt in 2015-16;
- gilts are now expected to be sold at a significant premium, which reduces the debt-to-GDP ratio by a further 0.7 per cent of GDP; and
- the net cash requirement has been lower than would be expected given our borrowing forecast in recent years, and we expect this to continue in 2015-16. This reduces the debt-to-GDP ratio by 0.3 per cent of GDP.
Table A: Sources of changes in the debt-to-GDP ratio in 2015-16